Huaxiang Liu*![]() | Kuok Tiung Lee
| Kuok Tiung Lee![]() | Sida Bai
| Sida Bai![]()
© 2023 IIETA. This article is published by IIETA and is licensed under the CC BY 4.0 license (http://creativecommons.org/licenses/by/4.0/).
OPEN ACCESS
The objectives of this study are to examine the motivations for people’s TikTok usage and the determinants of their continued use of the app. As a relatively new social media gaining unprecedented popularity so rapidly, it begs the question of why TikTokers keep using the app. This study is essential since social media marketers who seek to engage with Chinese consumers on TikTok and platform designers who wish to optimize the app might gain valuable insights from this study. The research model was developed by integrating uses and gratifications theory (UGT) with technology acceptance model (TAM). Based on descriptive analysis, TikTok is primarily used for entertainment (ENT) and information seeking (IS) motivations, followed by sociability seeking (SS) and escape (ESC) motivations, rather than for fashion (FAS) or money making (MM) reasons. Based on an analysis of 421 TikTokers utilizing structural equation modelling (SEM), perceived usefulness (PU) and attitude (ATT) have significant positive impacts on continuance intention (CI) of TikTok usage, whereas perceived ease of use (PEOU) exerts a significant negative effect, quite the opposite of previous research findings. PEOU and PU have both been shown to positively impact ATT toward TikTok. Meanwhile, PEOU has a significant positive effect on TikTok’s PU. There is significant positive impact of ENT and IS motivations on PEOU of TikTok, while FAS motivation exerts significant negative impact, whereas ESC, SS, and MM motivations are insignificant. Moreover, it has been revealed that ENT, SS, and IS motivations significantly contribute to TikTok’s PU, whereas FAS, ESC, and MM motivations are negligible. A total of twelve hypotheses were supported out of eighteen. Several theoretical and managerial implications have been drawn from the current research.
TikTok, uses and gratifications theory, technology acceptance model, motivations, continuance intention
Among the highest growing social networks worldwide, TikTok has established itself as one of the most popular [1]. In 2016, Beijing-based ByteDance launched TikTok as a short video app. Over 3 billion TikTok downloads have been recorded since its debut in 2016 [2]. There are 600 million Chinese users daily on the app who upload, browse, share, and follow content uploaded by other users. While TikTok boasts rapidly growing users, it is also notable for its high level of engagement with users. Despite having only been around for a short time, TikTok is currently the most used app in the world in minutes, surpassing Facebook [3]. This unprecedented popularity of a relatively new social network in such an incredibly short time raises the question of why TikTok users adopt the app and continue to use it.
In this study, we aim to examine people's motivations for using TikTok and the factors determining their continued use. Through the integration of two important theories to generate a more in-depth understanding, this study makes a valuable contribution by closing a major gap regarding the factors which affect the continued TikTok usage. As a conceptual framework, TAM can be applied to explore TikTok acceptance in that it is based on the premise that PEOU and PU have an impact on adoption, and therefore determine whether the systems will continue to be used in the long-term [4]. UGT seeks to understand how individuals use media. Rather than concentrating on how the media affects consumers, UGT stresses the role that consumers play in choosing certain media forms they can use to meet their psychological and social needs. Goal-oriented people choose media tools based on their needs, knowing what needs they have that need to be met [5]. Here are some of the considerations behind the integration of TAM and UGT. In the first place, TAM and UGT combined can provide a solution to TAM’s weaknesses and maintain its strengths while addressing the motivations of users. Furthermore, this integrated model is useful in predicting people’s continued use of TikTok.
2.1 Technology acceptance model
In 1985, Davis developed TAM to explain technology adoption behavior and was deemed by Chuttur [6] to be the leading model that explains and predicts system use. According to Davis [4], TAM focuses on two predictors of PEOU and PU that help to understand technology usage behaviors. A variety of researchers have often employed TAM as a means to gain insight into how people perceive their use of different technologies. Scherer et al. [7] report behavioral intentions and technology usage as outcome variables. In relation to the outcomes cited above, PEOU and PU of the system by individuals are key independent variables [8, 9]. Using TAM, it is attempted to develop an understanding of the reasons behind people’s adoption or exclusion of a certain technology [4, 10].
It is important to note, however, that TAM does have two limitations. Due to its generality and simplicity, the initial model does not identify antecedents that may have influenced PEOU and PU [11, 12]. Moreover, as Park [12] pointed out, while the model can be used to identify factors influencing individuals’ adoption and usage of certain technologies, it cannot adequately explain why people do so. The TAM must, furthermore, include factors related to target technology, context, and users, according to Shyu and Huang [13].
Considering the weakness of TAM, this paper introduces UGT, a commonly applied approach in communication research. As TAM focuses on the technology itself, whereas UGT looks at the motivations and experiences that are generated by the technology, it is crucial to integrate both theories into a broader conceptualization [14].
2.2 Uses and gratifications theory
UGT is an established theory in mass communications that explains how rational individuals choose particular media to fulfill certain socio-psychological needs [15]. In many studies, UGT has been used to examine how individuals utilize different media and the motives behind them. It is possible for people to use identical media for different reasons, as well as to experience different levels of gratifications. With no predefined set of constructs, UGT has been constantly revised and updated as research progresses.
This is not a new area of research to apply UGT to study social media. Using the framework of UGT, a popular line of studies on social media’s continued usage emphasizes the impact of distinct gratifications on continuation intentions as seen in Facebook [16, 17], microblogging [18], online games [19], WeChat [20], Instagram [21] and KakaoTalk [22]. The intent to continue TikTok’s usage has, however, never been addressed. UGT has been revived and rejuvenated by new forms of media, according to Rubin [23] and Ruggiero [24]. It was suggested by Bucknell Bossen and Kottasz [25] that new media platforms with distinctive features, such as TikTok, could be studied using this theoretical framework.
Unlike TAM, which focuses on external factors, UGT focuses on internal factors. Accordingly, we utilize UGT to identify internal factors of individuals, which is a weakness of TAM. Two reasons justify combining UGT with TAM in this study. Firstly, the combination incorporates user motivations while maintaining TAM’s parsimonious nature. Furthermore, this integration enables us to predict the continuation of TikTok usage.
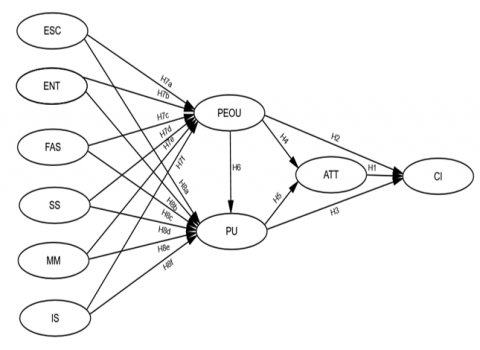
Figure 1 illustrates the model created for the current study.
3.1 Continuance intention
In information systems, the intention of individuals to use the system again after acceptance is called CI [26]. The psychological motivations of users to maintain a certain use of an information system has been emphasized by Bhattacherjee [26]. Ultimately, an information system’s success depends not on whether it is accepted, but rather on how it is used over time. In the wake of adoption, CI has been regarded as one of the most important behavioral outcomes. The possibility of users continuing to use TikTok for an extended period of time is defined as CI to use TikTok herein.
Figure 1. Research model
Note: ESC=Escape; ENT=Entertainment; FAS=Fashion; SS=Sociability Seeking; MM=Money Making; IS=Information Seeking; PEOU=Perceived Ease of Use; PU=Perceived Usefulness; ATT=Attitude; CI=Continuance Intention
3.2 Attitude
A person’s ATT toward a certain behavior can be described as their belief about the outcome of their behavior [27]. The ATT towards the behavior is comprised of behavioral beliefs and outcome evaluations, which are interpreted as people’s positive or negative assessment and judgement of the behavior, according to Ajzen [28]. It is found ATT is one of the strongest significant predictive factors of behavior intention when it comes to social media [29]. Therefore, we hypothesize the following.
H1: Attitude towards TikTok exerts a significant impact on continuance intention to utilize the app.
3.3 Perceived ease of use & perceived usefulness
Davis [4] introduced TAM, which drew upon the Theory of Reasoned Action and the Theory of Planned Behavior. In TAM, PEOU and PU are two key concepts, which refer to the extent to which people think it can save time and effort when interacting with the system, and their perception of the system’s ability to enhance their job performance.
According to Venkatesh [30] and Venkatesh et al. [31], people’s PEOU and PU of these technologies are predictive of their intention to make use of them. Across several studies, intention to adopt certain technologies was significantly influenced by both individuals’ PEOU and PU for those technologies [30, 32, 33]. However, the study by Camilleri and Falzon [34] as well as the study by Yang and Lee [35] found that only users’ PU of digital media streaming is positively related to their behavioral intentions regarding their usage of the services. Accordingly, the following hypotheses are put forth to investigate whether both PEOU and PU influence CI.
H2: Perceived ease of use exerts a significant impact on continuance intention to use TikTok.
H3: Perceived usefulness exerts a significant impact on continuance intention to use TikTok.
According to TAM, external factors affect PEOU and PU directly, thereby indirectly influencing users’ willingness to accept a new technology. It is believed that ATTs are influenced by PEOU and PU [4]. Therefore, we hypothesize the following.
H4: Perceived ease of use exerts a significant impact on attitude towards TikTok.
H5: Perceived usefulness exerts a significant impact on attitude towards TikTok.
Since the early 1990s, substantial research has been conducted demonstrating that PEOU positively impacts PU [32]. PEOU and PU have been reported to have positive relationships in a variety of studies [4, 12, 32, 36-40]. According to these theoretical underpinnings, if technologies can be easily used, then people are more inclined to use them. In contrast, when technologies are too complicated or hard to operate, people will not find them useful [34]. Accordingly, the present study hypothesizes what follows.
H6: Perceived ease of use exerts a significant impact on perceived usefulness.
3.4 Gratifications sought/ motivations
This study will employ the six UGT 1.0 gratifications sought explored by Meng and Leung [41] in their research on TikTok usage. As the first gratification sought, ESC is highlighted, suggesting that people believe by using TikTok, they can escape from work or study, as well as from the people close to them, such as their family members, friends, classmates and colleagues. ENT is another motivation, as people feel the app can entertain them. FAS is a third gratification sought by TikTok users, indicating a desire for FAS and style. As for the fourth motivation, it is SS, meaning users want to maintain contact with their friends and make new friends through TikTok. MM is the fifth gratification sought by TikTok users, as the platform allows users to earn money through live broadcasts and product promotions. In addition, IS is the sixth motivation, suggesting that people utilize TikTok to keep abreast of what’s going on [41]. According to Park’s [12] study, motivations for communication and instrumentality significantly impact PEOU, PU and subsequently influence the use and adoption of computer-based VoIP phone services. Based on these findings, it was concluded, TAM and UGT integration could be beneficial for examining how other new forms of communication technologies could be accepted by users. Following Park’s [12] study, we propose the following hypotheses.
H7: Motivations (a. Escape, b. Entertainment, c. Fashion, d. Sociability Seeking, e. Money Making, f. Information Seeking) exert a significant impact on perceived ease of use.
H8: Motivations (a. Escape, b. Entertainment, c. Fashion, d. Sociability Seeking, e. Money Making, f. Information Seeking) exert a significant impact on perceived usefulness.
Table 1. Demographics of respondents (N=421)
|
Measure |
Items |
Frequency |
Percentage (%) |
|
Age |
<=20 |
166 |
39.4 |
|
21-25 |
186 |
44.2 |
|
|
26-30 |
38 |
9.0 |
|
|
31-40 |
26 |
6.2 |
|
|
>=41 |
5 |
1.2 |
|
|
Gender |
Male |
134 |
31.8 |
|
Female |
287 |
68.2 |
|
|
Education Level |
Middle School |
8 |
1.9 |
|
Polytechnic School/ High School |
70 |
16.6 |
|
|
College/ University |
264 |
62.7 |
|
|
Graduate School |
79 |
18.8 |
|
|
Years of using TikTok |
<0.5 year |
112 |
26.6 |
|
0.5-1 year |
67 |
15.9 |
|
|
1-2 years |
82 |
19.5 |
|
|
2-3 years |
82 |
19.5 |
|
|
3-4 years |
52 |
12.4 |
|
|
4-5 years |
16 |
3.8 |
|
|
>5 years |
10 |
2.4 |
|
|
TikTok usage frequency |
Less than once every week |
148 |
35.2 |
|
Two to three times every week |
67 |
15.9 |
|
|
Four to five times every week |
32 |
7.6 |
|
|
Once every day |
37 |
8.8 |
|
|
Two to three times every day |
54 |
12.8 |
|
|
Four to five times every day |
26 |
6.2 |
|
|
More than five times every day |
57 |
13.5 |
|
|
Daily time spent on TikTok |
<15 minutes |
155 |
36.8 |
|
15-30 minutes |
73 |
17.3 |
|
|
30-60 minutes |
103 |
24.5 |
|
|
1-2 hours |
48 |
11.4 |
|
|
2-3 hours |
20 |
4.8 |
|
|
3-4 hours |
11 |
2.6 |
|
|
>4 hours |
11 |
2.6 |
4.1 Data collection and sample
The authors obtained ethical approval for this study from University Malaysia Sabah’s Research and Ethics Committee. All participants gave their informed consent to participate in this study. Researchers complied with ethical guidelines when gathering data and ensured that all information provided by respondents was used only for research purposes.
Owing to practicality and expense restrictions, it is unrealistic and impossible to research the whole population. Even if it was possible to study the entire population, it is prohibitive in terms of time, costs, and other human resources [42]. To gather data for this research, non-probability sampling methods were used. This is due to the fact that not every unit in the population, namely TikTokers, can be assured to be included in the sample since this is a voluntary survey and only interested respondents are asked to participate. The appropriateness of the sample size may be generally evaluated using the following criteria, according to studies of Tabachnick and Fidell [43] and Comrey and Lee [44]: 100 is considered poor; 200 is considered fair; 300 is considered good; 500 is considered very good; and 1000 or more is considered excellent. As a result, a sample size of over 300 is considered good.
As part of this study, data were collected from July 3 through August 29, 2022 using Tencent’s questionnaire (https://wj.qq.com/). Convenience sampling was utilized to distribute the online survey link. Only one submission was allowed per IP address. There was no name associated with any of the respondents and all information was voluntarily disclosed. A description of the research scheme and its goals were presented in the questionnaire at the outset. As a means of minimizing meaning errors and guaranteeing accuracy, back translation [45] was employed. The survey, written in English initially, was then translated into mandarin by a linguistically proficient third party before being translated back into English. There is an appendix listing the items measured for the study. Pre-testing was conducted on 44 individuals prior to the survey to make sure every question was well-structured, thorough, and reliable. The pilot study feedback led to the revision of several perplexing questions. There were a total of 505 questionnaires collected. Those questionnaires scoring the same or taking less than two minutes to complete were eliminated from the analysis. In total, 421 valid samples were processed subsequently for analysis. A demographic breakdown of the sampled participants is shown in Table 1. In this sample, 44.2% of the participants are between the ages of 21-25; 39.4% are under 20. As for gender distribution, the majority of samples are female, making up 68.2%. In terms of education level, there are relatively more “College/University” participants with a proportion of 62.7% in the sample. 26.6% of TikTok users have used the platform for less than half a year. For TikTok usage frequency, “Less than once every week” accounts for the highest proportion of 35.2%. There are relatively more people who spend less than 15 minutes on TikTok on a daily basis, accounting for 36.8% of the sample.
4.2 Construct measurement
According to our research model, there are ten constructs, including CI, ATT, PEOU, PU, ESC, ENT, FAS, SS, MM and IS. Measures of each construct were based on multiple item scales. All measurement instruments derived from existing research were then adjusted in order to fit the TikTok research scenario. Bhattacherjee [26] was the source of items for CI. The list of ATT items was based on Taylor and Todd [46]. Several items from Joo and Sang [32] were modified to serve as PEOU items. There were items for PU that came from Camilleri and Falzon [34]. For ESC, items were drawn from Meng and Leung [41] and Lee et al. [47]. In this study, we modified the items of ENT from Meng and Leung [41] & Tao and Zhu [48]. FAS items were sourced from Meng and Leung [41]. This article borrowed SS items from Meng and Leung [41] and Lee et al. [47]. Modifications to items for MM have been made based on Meng and Leung [41]. A selection of items for IS was taken from Meng and Leung [41]. All measuring items were rated from strong disagreement to strong agreement using a 7-point Likert scale.
4.3 A brief overview of analysis
Data were analyzed via confirmatory factor analysis (CFA) and SEM. In CFA, the underlying latent variable structure is already known, such as in this study, and the validity of the measurement items was evaluated against the proposed factor structures. In the current study, hypotheses were tested using SEM. For estimating relationships among different independent and dependent variables, SEM is commonly used in empirical research. An examination of the factors that influence people’s CI when it comes to TikTok was conducted using the two-stage analytical technique developed by Anderson and Gerbing [49].
Reliability and validity tests were undertaken first. To form model fit indices, the ratio of chi-square to degrees of freedom (χ2/df), the goodness-of-fit index (GFI), the adjusted goodness-of-fit index (AGFI), the incremental fit index (IFI), the comparative fit index (CFI) and the Tucker-Lewis index (TLI), the standardized root mean squared residual (SRMR), the root mean square error of approximation (RMSEA) were combined [50-52]. Cronbach’s Alpha (α) and composite reliability (CR) [53] were utilized to test the internal consistency of all constructs in the conceptual model. It was recommended that CR be at least 0.70 to be adequate [54]. The average variance extracted (AVE), the square root of AVE, and the correlation values [55] served to validate our measurement model’s convergent and discriminant validity. To assess the convergent and discriminant validity, we checked whether the AVEs of each construct are greater than their correlation with other constructs, as well as whether each item’s loading on its assigned construct is higher than that on other constructs [55, 56].
Secondly, this research utilized structural equation analysis for testing the hypotheses, including investigating whether the hypotheses hold and an analysis of the relationships among the different variables under study. Statistical analyses were performed with SPSS 23.0, SPSSAU and AMOS 24.0.
5.1 Descriptive analysis
As shown in Table 2, similar to the study results of Meng and Leung [41], people use TikTok primarily for ENT motivation, with a mean of 4.488, followed by IS motivation, with a mean of 4.089. It is clear from the data that most people don’t use TikTok for FAS or MM reasons; the means of these motivations are 2.959 and 2.854 respectively, relatively low compared with other motivations. Most people find TikTok easy to use as the mean of PEOU is 5.341. TikTok is considered useful by most people since the mean of PU is 4.619. The mean of ATT is 4.130, indicating that most people hold a positive ATT toward TikTok use. It looks like most people will keep using TikTok, since the mean score of CI is 4.108.
5.2 An Evaluation of the measurement model
An estimation of this model’s goodness of fit began with confirmatory factor analysis (CFA). We applied CFA as a means of evaluating the quality of our proposed measures by examining whether the specific items load accurately under the construct where they belong. It is recommended to have at least two items in a construct, with each item factor loading being greater than 0.50 [50]. Based on the analysis, all constructs in this study appear to have good measurement properties due to their reflective nature, in accordance with suggestions made by Chin [57] and Fornell and Larcker [55]. The outcomes of CFA can be found in Table 3.
Table 2. Descriptive analysis (N=421)
|
Constructs |
Min |
Max |
Mean |
Std. Deviation |
Median |
|
ESC |
1.000 |
7.000 |
3.196 |
1.649 |
3.000 |
|
ENT |
1.000 |
7.000 |
4.488 |
1.672 |
4.667 |
|
FAS |
1.000 |
7.000 |
2.959 |
1.697 |
2.667 |
|
SS |
1.000 |
7.000 |
3.558 |
1.780 |
3.667 |
|
MM |
1.000 |
7.000 |
2.854 |
1.840 |
2.333 |
|
IS |
1.000 |
7.000 |
4.089 |
1.901 |
4.333 |
|
PEOU |
1.000 |
7.000 |
5.341 |
1.591 |
5.667 |
|
PU |
1.000 |
7.000 |
4.619 |
1.765 |
5.000 |
|
ATT |
1.000 |
7.000 |
4.130 |
1.623 |
4.333 |
|
CI |
1.000 |
7.000 |
4.108 |
1.775 |
4.000 |
Table 3. Confirmatory factor analysis
|
CI |
PEOU |
MM |
FAS |
ESC |
ENT |
SS |
IS |
PU |
ATT |
|
|
CI1 |
.781 |
.153 |
.096 |
.173 |
.095 |
.215 |
.186 |
.192 |
.206 |
.260 |
|
CI2 |
.844 |
.144 |
.094 |
.181 |
.073 |
.148 |
.144 |
.139 |
.221 |
.156 |
|
CI3 |
.811 |
.166 |
.098 |
.152 |
.118 |
.227 |
.238 |
.179 |
.162 |
.107 |
|
PEOU1 |
.087 |
.898 |
.026 |
.009 |
-.018 |
.063 |
.014 |
.190 |
.070 |
.157 |
|
PEOU2 |
.115 |
.898 |
.003 |
-.038 |
.024 |
.083 |
.016 |
.106 |
.168 |
.127 |
|
PEOU3 |
.161 |
.840 |
.091 |
.038 |
.012 |
.095 |
.155 |
.037 |
.275 |
.043 |
|
MM1 |
.093 |
.066 |
.895 |
.154 |
.132 |
.051 |
.182 |
.117 |
.037 |
.018 |
|
MM2 |
.090 |
.022 |
.909 |
.173 |
.115 |
.069 |
.163 |
.089 |
.100 |
.048 |
|
MM3 |
.049 |
.042 |
.876 |
.242 |
.079 |
.042 |
.186 |
.109 |
.064 |
.098 |
|
FAS1 |
.147 |
.022 |
.177 |
.809 |
.144 |
.197 |
.200 |
.127 |
.138 |
.061 |
|
FAS2 |
.161 |
-.027 |
.237 |
.824 |
.185 |
.111 |
.182 |
.204 |
.083 |
.031 |
|
FAS3 |
.141 |
.018 |
.246 |
.821 |
.193 |
.070 |
.131 |
.115 |
.041 |
.113 |
|
ESC1 |
.114 |
.060 |
.003 |
.038 |
.785 |
.292 |
.015 |
.176 |
.054 |
.127 |
|
ESC2 |
.057 |
-.007 |
.177 |
.211 |
.856 |
.041 |
.157 |
.050 |
.060 |
-.005 |
|
ESC3 |
.048 |
-.025 |
.137 |
.185 |
.866 |
.125 |
.083 |
.013 |
.022 |
.005 |
|
ENT1 |
.165 |
.103 |
.047 |
.038 |
.288 |
.759 |
.237 |
.175 |
.166 |
.154 |
|
ENT2 |
.299 |
.095 |
.027 |
.270 |
.314 |
.639 |
.143 |
.209 |
.164 |
.151 |
|
ENT3 |
.224 |
.130 |
.116 |
.197 |
.115 |
.789 |
.149 |
.148 |
.133 |
.160 |
|
SS1 |
.234 |
.058 |
.300 |
.228 |
.107 |
.111 |
.744 |
.232 |
.046 |
.103 |
|
SS2 |
.149 |
.122 |
.245 |
.156 |
.116 |
.235 |
.769 |
.122 |
.207 |
.066 |
|
SS3 |
.216 |
.060 |
.216 |
.235 |
.135 |
.167 |
.772 |
.191 |
.143 |
.125 |
|
IS1 |
.205 |
.189 |
.163 |
.189 |
.110 |
.193 |
.196 |
.785 |
.227 |
.119 |
|
IS2 |
.255 |
.148 |
.176 |
.235 |
.116 |
.123 |
.212 |
.769 |
.193 |
.132 |
|
IS3 |
.149 |
.239 |
.145 |
.176 |
.133 |
.334 |
.212 |
.661 |
.267 |
.177 |
|
PU1 |
.287 |
.318 |
.110 |
.128 |
.083 |
.160 |
.176 |
.261 |
.743 |
.201 |
|
PU2 |
.310 |
.329 |
.095 |
.106 |
.085 |
.195 |
.174 |
.273 |
.682 |
.247 |
|
PU3 |
.256 |
.325 |
.110 |
.133 |
.058 |
.209 |
.150 |
.235 |
.747 |
.214 |
|
ATT1 |
.305 |
.314 |
.079 |
.133 |
.109 |
.318 |
.136 |
.254 |
.331 |
.594 |
|
ATT2 |
.297 |
.292 |
.111 |
.139 |
.056 |
.236 |
.171 |
.152 |
.309 |
.697 |
|
ATT3 |
.451 |
.230 |
.126 |
.096 |
.087 |
.249 |
.133 |
.211 |
.252 |
.618 |
Extraction method: principal component analysis
Rotation method: Caesar’s normalized maximum variance method
Estimating the measurement model was done using maximum likelihood estimation. According to Table 4, all fit indices except GFI fall within acceptable ranges [50-52]. In spite of this, what worth noting is that Cohen [58] believes 0.80 to be the minimum value of a reasonably good fit, so a GFI value lower than 0.90 might also indicate an adequate fit. Different tests were then performed to evaluate the reliability and validity of the measuring model. As a first step, Cronbach’s Alpha (α) and composite reliability (CR) were evaluated to determine the internal consistency within the conceptual model. It is evident that there is strong internal consistency within all constructs, as illustrated by Table 5, with all Cronbach’s α and CR values exceeding the 0.70 cutoff value [53]. Further validation of the measuring model’s convergent and discriminant validity was carried out by examining the average variance extracted (AVE), the square root of AVE, and the correlation values. In light of the fact that all of the AVEs in this model, as displayed in Table 5, are greater than the proposed minimal cutoff of 0.50 and that the square roots of the AVEs essentially exceed the correlation values between construct pairs, as illustrated in Table 6, we conclude that the research model appears to have a high degree of convergent and discriminant validity [55].
Table 4. Model fit indices
|
Fit Index |
χ2/df |
SRMR |
RMSEA |
GFI |
AGFI |
IFI |
CFI |
TLI |
|
Recommended Value |
≤3 |
<0.08 |
<0.08 |
>0.9 |
>0.8 |
>0.9 |
>0.9 |
>0.9 |
|
Observed Value |
2.478 |
0.067 |
0.059 |
0.872 |
0.840 |
0.956 |
0.956 |
0.949 |
Table 5. Cronbach’s Alpha (α), composite reliability (CR), and average variance extracted (AVE)
|
Constructs |
Items |
Unstd. |
S.E. |
t-Value |
P |
Factor Loading |
Cronbach’s a |
CR |
AVE |
|
ESC |
ESC1 |
1.000 |
0.715 |
0.855 |
0.862 |
0.677 |
|||
|
ESC2 |
1.124 |
0.071 |
15.816 |
*** |
0.869 |
||||
|
ESC3 |
1.098 |
0.069 |
15.819 |
*** |
0.874 |
||||
|
ENT |
ENT1 |
1.000 |
0.868 |
0.876 |
0.878 |
0.705 |
|||
|
ENT2 |
0.983 |
0.052 |
18.798 |
*** |
0.817 |
||||
|
ENT3 |
0.895 |
0.047 |
19.136 |
*** |
0.834 |
||||
|
FAS |
FAS1 |
1.000 |
0.859 |
0.913 |
0.915 |
0.782 |
|||
|
FAS2 |
1.079 |
0.043 |
25.219 |
*** |
0.947 |
||||
|
FAS3 |
0.974 |
0.044 |
22.232 |
*** |
0.843 |
||||
|
SS |
SS1 |
1.000 |
0.852 |
0.904 |
0.905 |
0.760 |
|||
|
SS2 |
0.967 |
0.045 |
21.326 |
*** |
0.845 |
||||
|
SS3 |
1.047 |
0.045 |
23.023 |
*** |
0.917 |
||||
|
MM |
MM1 |
1.000 |
0.920 |
0.949 |
0.950 |
0.863 |
|||
|
MM2 |
1.051 |
0.030 |
35.548 |
*** |
0.957 |
||||
|
MM3 |
0.998 |
0.032 |
31.332 |
*** |
0.909 |
||||
|
IS |
IS1 |
1.000 |
0.955 |
0.926 |
0.928 |
0.811 |
|||
|
IS2 |
0.952 |
0.032 |
29.750 |
*** |
0.897 |
||||
|
IS3 |
0.861 |
0.033 |
26.136 |
*** |
0.846 |
||||
|
PEOU |
PEOU1 |
1.000 |
0.885 |
0.913 |
0.914 |
0.781 |
|||
|
PEOU2 |
1.047 |
0.041 |
25.773 |
*** |
0.925 |
||||
|
PEOU3 |
0.998 |
0.044 |
22.682 |
*** |
0.839 |
||||
|
PU |
PU1 |
1.000 |
0.961 |
0.959 |
0.959 |
0.886 |
|||
|
PU2 |
0.943 |
0.025 |
37.110 |
*** |
0.916 |
||||
|
PU3 |
0.968 |
0.023 |
42.154 |
*** |
0.946 |
||||
|
ATT |
ATT1 |
1.000 |
0.903 |
0.923 |
0.924 |
0.801 |
|||
|
ATT2 |
0.957 |
0.036 |
26.924 |
*** |
0.907 |
||||
|
ATT3 |
0.973 |
0.038 |
25.426 |
*** |
0.875 |
||||
|
CI |
CI1 |
1.000 |
0.934 |
0.948 |
0.948 |
0.858 |
|||
|
CI2 |
1.017 |
0.030 |
33.584 |
*** |
0.924 |
||||
|
CI3 |
1.041 |
0.031 |
33.267 |
*** |
0.921 |
***P<0.001
Table 6. Construct correlations and discriminant validity
|
CI |
ATT |
PU |
PEOU |
IS |
MM |
SS |
FAS |
ENT |
ESC |
|
|
CI |
0.926 |
|||||||||
|
ATT |
0.788 |
0.895 |
||||||||
|
PU |
0.699 |
0.831 |
0.941 |
|||||||
|
PEOU |
0.402 |
0.586 |
0.616 |
0.884 |
||||||
|
IS |
0.637 |
0.708 |
0.728 |
0.444 |
0.900 |
|||||
|
MM |
0.329 |
0.335 |
0.331 |
0.138 |
0.433 |
0.929 |
||||
|
SS |
0.616 |
0.575 |
0.566 |
0.260 |
0.658 |
0.576 |
0.872 |
|||
|
FAS |
0.492 |
0.428 |
0.411 |
0.093 |
0.564 |
0.533 |
0.612 |
0.884 |
||
|
ENT |
0.678 |
0.749 |
0.635 |
0.343 |
0.677 |
0.311 |
0.626 |
0.530 |
0.840 |
|
|
ESC |
0.306 |
0.289 |
0.257 |
0.061 |
0.357 |
0.354 |
0.402 |
0.488 |
0.548 |
0.823 |
Note: AVE square roots are indicated with bold italics on the diagonal. The correlations are off diagonal.
5.3 Examining the structure model
Once the measurements’ goodness-of-fit, reliability and validity had been established, the hypotheses were tested. Detailed results are presented in Table 7, from which we can see that the majority of hypotheses were confirmed.
According to the results, ATT, PEOU and PU significantly affect the CI of TikTok usage. To be specific, the standardized path coefficient (β) value of ATT→CI is 0.672>0, and this path is significant at 0.001 level (z=8.886, p=0.000<0.05), which shows that ATT has a significant positive impact on CI. The β value of PEOU→CI is -0.141<0, and there is significance in this path at 0.01 level (z=-3.088, p=0.002<0.05), suggesting that PEOU exerts a significant negative influence over CI, quite the contrary of what TAM suggests that individuals' PEOU of certain technologies would positively predict their future use of those technologies [7, 9, 37, 39]. The β value of PU→CI is 0.235>0, and this path appears significant at 0.01 level (z=3.151, p=0.002<0.05), which reveals that PU has a significant positive impact on CI. Hypotheses 1, 2 and 3 are clearly supported. There are significant influences of PEOU and PU on ATT towards TikTok usage, which support their respective hypotheses H4 and H5. The β value of PEOU→ATT is 0.097>0, and this path presents significance at 0.05 level (z=2.305, p=0.021<0.05), which demonstrates that PEOU exerts a significant positive impact on ATT. The β value of PU→ATT is 0.785>0, and this path displays significance at 0.001 level (z=17.535, p=0.000<0.05), indicating that PU has a significant positive impact on ATT. In the meantime, PU of TikTok is significantly affected by PEOU. The β value of PEOU→PU is 0.346>0, and this path yields significance at 0.001 level (z=9.057, p=0.000<0.05), revealing that PEOU exerts a significant positive impact on PU. Hypothesis 6 is thus supported. Results show that ENT, FAS and IS have significant impacts on PEOU of TikTok, whereas ESC, SS and MM have little impact. The β value of ENT→PEOU is 0.217>0, and this path reaches significance at 0.05 level (z=2.458, p=0.014<0.05), which suggests that ENT has a significant positive impact on PEOU. The β value of FAS→PEOU is -0.247<0, and this path is significant at 0.001 level (z=-3.491, p=0.000<0.05), indicating that FAS exerts a significant negative impact on PEOU. The β value of IS→PEOU is 0.467>0, and this path exhibits significance at 0.001 level (z=5.891, p=0.000<0.05), meaning that IS has a significant positive impact on PEOU. The three paths ESC (z=-1.754, p=0.079>0.05), SS (z=-0.179, p=0.858>0.05), and MM (z=0.784, p=0.433>0.05) →PEOU do not show any significance. Therefore, ESC, SS, and MM do not have any significant impact on PEOU. Accordingly, hypotheses 7b, 7c, and 7f hold, while hypotheses 7a, 7d and 7e do not. As well as that, ENT, SS and IS significantly contribute to PU of TikTok, whereas ESC, FAS and MM have negligible effects. The β values of ENT and IS →PU are 0.266 and 0.345 respectively, both>0, and the two paths ENT (z=4.492, p=0.000<0.05) and IS (z=6.272, p=0.000<0.05) achieve significance at 0.001 level, which confirms that ENT and IS have significant positive impacts on PU. The β value of SS→PU is 0.110>0, and this path displays significance at 0.05 level (z=2.012, p=0.044<0.05), showing that SS exerts a significant positive impact on PU. The three paths ESC (z=-1.910, p=0.056>0.05), FAS (z=0.535, p=0.593>0.05), and MM (z=0.275, p=0.783>0.05) →PU do not appear to be significant. Therefore, ESC, FAS, and MM do not have significant impact on PU. In this regard, hypotheses 8b, 8d, and 8f stand supported, whilst hypotheses 8a, 8c, and 8e are rejected.
Table 7. Tests of hypotheses
|
Research Hypothesis |
Path Relations |
Unstd. |
S.E. |
Z |
P |
Std. |
Results |
||
|
H1 |
ATT |
→ |
CI |
0.718 |
0.081 |
8.886 |
*** |
0.672 |
Supported |
|
H2 |
PEOU |
→ |
CI |
-0.162 |
0.053 |
-3.088 |
0.002 |
-0.141 |
Supported |
|
H3 |
PU |
→ |
CI |
0.230 |
0.073 |
3.151 |
0.002 |
0.235 |
Supported |
|
H4 |
PEOU |
→ |
ATT |
0.104 |
0.045 |
2.305 |
0.021 |
0.097 |
Supported |
|
H5 |
PU |
→ |
ATT |
0.718 |
0.041 |
17.535 |
*** |
0.785 |
Supported |
|
H6 |
PEOU |
→ |
PU |
0.409 |
0.045 |
9.057 |
*** |
0.346 |
Supported |
|
H7a |
ESC |
→ |
PEOU |
-0.119 |
0.068 |
-1.754 |
0.079 |
-0.115 |
Rejected |
|
H7b |
ENT |
→ |
PEOU |
0.203 |
0.083 |
2.458 |
0.014 |
0.217 |
Supported |
|
H7c |
FAS |
→ |
PEOU |
-0.230 |
0.066 |
-3.491 |
*** |
-0.247 |
Supported |
|
H7d |
SS |
→ |
PEOU |
-0.013 |
0.073 |
-0.179 |
0.858 |
-0.015 |
Rejected |
|
H7e |
MM |
→ |
PEOU |
0.042 |
0.054 |
0.784 |
0.433 |
0.050 |
Rejected |
|
H7f |
IS |
→ |
PEOU |
0.365 |
0.062 |
5.891 |
*** |
0.467 |
Supported |
|
H8a |
ESC |
→ |
PU |
-0.101 |
0.053 |
-1.910 |
0.056 |
-0.083 |
Rejected |
|
H8b |
ENT |
→ |
PU |
0.293 |
0.065 |
4.492 |
*** |
0.266 |
Supported |
|
H8c |
FAS |
→ |
PU |
0.028 |
0.052 |
0.535 |
0.593 |
0.025 |
Rejected |
|
H8d |
SS |
→ |
PU |
0.114 |
0.056 |
2.012 |
0.044 |
0.110 |
Supported |
|
H8e |
MM |
→ |
PU |
0.011 |
0.042 |
0.275 |
0.783 |
0.012 |
Rejected |
|
H8f |
IS |
→ |
PU |
0.319 |
0.051 |
6.272 |
*** |
0.345 |
Supported |
***P<0.001
6.1 Discussion
As per survey results, TikTok is used primarily for ENT and IS motivations, followed by SS and ESC motivations, similar to that of Meng and Leung [41]. Based on the data, contrary to what Lu and Lu [59] and Meng and Leung [41] claimed, it is evident that most people don’t use TikTok for FAS or MM reasons. The participants believe that using TikTok helps them relax or rest, as well as relieve their stress, in line with studies on UGT, in which scholars conclude that media technologies are often viewed as forms of ENT [60-62]. To satisfy their information needs, most respondents use TikTok to keep up with recent events and to find interesting information, which is also consistent with previous research [10, 63]. Contrary to Mull and Lee [64] and Vaterlaus and Winter [65], the current research finds most people do not use TikTok for FAS or MM motivations. As for FAS, the finding of this research is supported by Curras-Perez et al. [66], who claimed that people use social networks to form social links with friends, family, and acquaintances, and to have fun and entertainment, rather than being fashionable or up-to-date. According to Meng and Leung [41], MM is an additional motivation for TikTokers to use the platform to earn money through livestreaming and product promotion. Despite the fact that our research findings do not support it at present, TikTok's commercial and money-making advantages may become increasingly important as more users adopt the app and continue to use it [65].
This study shows that people generally perceive TikTok as an easy-to-use and useful application, in agreement with Vaterlaus and Winter [65]’s finding. Participants find it easy to learn how to operate TikTok, with most reporting no difficulty using the app skillfully. Furthermore, they have an easy time interacting with TikTok thanks to its simple interface, similar to what Vaterlaus and Winter [65] found. With TikTok, people are able to access content faster than with traditional video services, providing them with a useful alternative, consistent with Lu and Lu [59]. Additionally, TikTok offers a better experience when it comes to watching informative or entertaining videos, the same as Wang [67] mentioned. Besides that, TikTok also facilitates people’s studies or work, which Scherr and Wang [68] also noted. Most people have a positive ATT toward TikTok since they find it enjoyable and satisfying to use the service and consider using it a good idea. Consequently, much of the research participants are committed to using TikTok and to doing so regularly in the future.
Based on SEM analysis, PU and ATT are significant positive antecedents of people’s intention to continue using TikTok, whereas PEOU is a significant negative predictor, contrary to what many researchers have reported PEOU to be a positive predictor, such as Kim and Wang [69], Dhir et al. [70] and Dalvi-Esfahani et al. [71]. When the usefulness of TikTok is perceived and a positive ATT towards the app is established, people are more likely to continue using the service. Yet, the easier the software is to operate, the more likely users are to discontinue using it. Possibly, due to the simplicity of the platform, it may be easy for people to become addicted to it, thereby wanting to get rid of it. As Vaterlaus and Winter [65], Chakraborty et al. [72] and Lu et al. [73] have pointed out, people avoid TikTok due to concerns about low-quality content and vulgarity, as well as potential time-wasting. While PEOU significantly influences PU in a positive way, both PEOU and PU have significant positive impacts on ATT. This means people are more likely to perceive TikTok’s usefulness if they perceive its ease of use. Additionally, when people perceive TikTok as easy to use and useful, they will develop a more favorable ATT towards it. PEOU of TikTok is significantly influenced by ENT and IS in a positive way, by FAS in a negative way, while ESC, SS and MM have only limited influences. In other words, people who use TikTok for ENT and IS purposes are more likely to find the app easy to use. Nevertheless, the more people use TikTok for FAS motivation, the more people will find the software hard to use. It could be that TikTok is only a popular social media that can’t meet people’s FAS needs. Moreover, ENT, SS and IS stand to have significant positive effects on PU of TikTok, in contrast to ESC, FAS and MM, which have negligible effects. This means that the more people use TikTok for ENT, SS, and IS motivations, the more useful it will be to them.
Social media such as TikTok have seen a surge in use following the unexpected spread of Coronavirus epidemic and its resulting social distancing measures. Paid streaming services also saw a spike in subscriptions [74]. A positive ATT and a perception of ease of use and usefulness of media platforms like TikTok would encourage consumers to continue entertaining themselves and searching for interesting information on the software.
6.2 Theoretical implications
Theoretical contributions of this research are as follows. To begin with, by integrating UGT and TAM in a single theoretical framework, the current study advances the existing literature. To understand how information and communications technologies are adopted, UGT and TAM are both well-known theories. UGT is concerned with intrinsic factors of information system adoption, whereas TAM focuses on extrinsic factors, so this study utilized UGT to shed light on individual users’ intrinsic motivations, a weakness of TAM. In this study, we successfully developed a model that would be able to explain and predict the CI for TikTok users. This study also explores the antecedents of PEOU and PU. The research model can assist in addressing not only the underlying research questions, but also to examine why people continue to engage in other popular social media similar to TikTok. To some extent, the current work is a novel attempt combining UGT and TAM to examine people’s motivations for using newer social media, such as TikTok, and their CI towards them.
Furthermore, as TikTok continues to grow, this research serves as a springboard for further academic exploration of topics that have yet to be explored. Based on our findings, TikTok users have different motives than those who use other social media platforms. As far as TikTok use motives are concerned, most users prioritize ENT and IS. Due to social media’s predominant role as a “social” tool, previous social media UGT studies have focused on the importance of social interaction [75]. On TikTok, users primarily seek ENT and information, while the majority consumes content, whereas the minority builds communities and interacts with others.
6.3 Practical implications
This study provides valuable insights for social media marketers seeking to connect and engage with Chinese consumers on TikTok. As a start, marketers who are interested in TikTok influencer marketing need to take into account the motivations of its users. TikTok users mainly consume time for ENT and IS, so practitioners must develop entertaining and informative contents that meet their primary needs. Aside from that, social media marketers should understand consumers’ motivations, as well as their CI on the platform in order to collaborate with appropriate influencers to accomplish a variety of influencer marketing goals.
TikTok platform designers can also benefit from our findings. TikTok users tend to use the platform more for ENT and IS motivations than for FAS or MM. To satisfy people’s need for ENT, platform designers should include features that help them express their enjoyment during consumption, such as avatars and emojis [76]. Also, more convenient search methods will help people find relevant information more easily, such as adding hashtag search function to satisfy their need for IS by making it easy to find videos they’ve watched recently. SEM results show that PU and ATT are significant positive antecedents of people’s intention to continue using TikTok, whereas PEOU is a significant negative predictor, which could be explained by its simplicity, allowing people to become addicted easily, and thus want to get rid of it. Consequently, TikTok designers should strive to make users feel that the platform is useful and maintain their positive ATT towards it. As well as that, the designers should develop a mechanism that will prevent addiction, so that users won’t stop using the software completely because they feel too addicted to it.
6.4 Research limitations and future directions
A few research limitations should be noted, along with directions for future research. As a result of the COVID-19 epidemic, a nonprobability sampling was utilized to draw the sample for this research, and therefore, the sample for this study was neither representative nor diversified. Therefore, when interpreting the findings, one should keep in mind that the research may not be generalizable. Moreover, our survey had a much higher percentage of female participants than male participants. An appropriate sample of Chinese TikTok users should be recruited with a balance of male and female respondents in future research. A further limitation of this study could be that the six motivations examined here are inadequate to account for the time users spend on TikTok. Future TikTok research can explore other motivations, as well as the relationship between motivations and users’ CI, which has not been explored thus far.
Measurement Items
Escape (ESC) adapted from Meng and Leung [41] and Lee et al. [47]
ESC1: I use TikTok as a way to escape temporarily from what I am doing, like studying or working.
ESC2: I use TikTok as a great way for me to escape temporarily away from other people, such as classmates, coworkers, family members and friends.
ESC3: It is my way of escaping from reality through TikTok.
Entertainment (ENT) adapted from Meng and Leung [41] and Tao and Zhu [48]
ENT1: Using TikTok helps me relax.
ENT2: I use TikTok as a way to rest.
ENT3: Using TikTok can relieve my stress.
Fashion (FAS) adapted from Meng and Leung [41]
FAS1: I use TikTok as a way of looking stylish.
FAS2: Fashion is what drives me to use TikTok.
FAS3: I use TikTok to avoid looking old-fashioned.
Sociability Seeking (SS) adapted from Meng and Leung [41] and Lee et al. [47]
SS1: TikTok is a great app for meeting new people.
SS2: TikTok allows me to interact with a wide range of people.
SS3: I use TikTok as a way of maintaining good relations with others.
Money Making (MM) adapted from Meng and Leung [41]
MM1: Using TikTok allows me to earn money by broadcasting live streams.
MM2: By promoting products on TikTok, I can earn money.
MM3: By using TikTok, I can earn money.
Information Seeking (IS) adapted from Meng and Leung [41]
IS1: I use TikTok to keep up with recent events.
IS2: TikTok is my go-to app for finding news and information.
IS3: Finding interesting information on TikTok is something I do with the app.
Perceived ease of use (PEOU) adapted from Joo and Sang [32]
PEOU1: The process of learning how to operate TikTok is easy for me.
PEOU2: Being able to use TikTok skillfully comes easily to me.
PEOU3: It is easy for me to interact with TikTok.
Perceived usefulness (PU) adapted from Camilleri and Falzon [34]
PU1: In comparison to traditional video services, TikTok provides me with faster access to the content I want.
PU2: TikTok gives me a better experience when it comes to watching informative or entertaining videos.
PU3: TikTok makes my study/work easier.
Attitude (ATT) adapted from Taylor and Todd [46]
ATT1: As a user of TikTok, I find it enjoyable.
ATT2: The TikTok service I’m using is satisfying to me.
ATT3: Using TikTok seems like a good idea to me.
Continuance Intention (CI) adapted from Bhattacherjee [26]
CI1: Using TikTok is something I intend to continue doing, so I’m not abandoning it.
CI2: Rather than using another replacement application, I intend to keep using TikTok.
CI3: I will use TikTok regularly.
[1] Weimann, G., Masri, N. (2020). Research note: spreading hate on TikTok. Studies in Conflict & Terrorism. https://doi.org/10.1080/1057610X.2020.1780027
[2] Dean, B. (2022). TikTok User Statistics. https://backlinko.com/tiktok-users#monthly-active-tiktok-users
[3] Southern, M.G. (2021). TikTok is surpassing Facebook in amount of hours spent per user per month. https://www.searchenginejournal.com/tiktok-beats-facebook-in-time-spent-per-user/392643/#close
[4] Davis, F. D. (1989). Perceived usefulness, perceived ease of use, and user acceptance of information technology. MIS Quarterly, 31(3): 319-340. https://doi.org/10.2307/249008
[5] Rubin, A.M. (1993). Audience activity and media use. Communications Monographs, 60(1): 98-105. https://doi.org/10.1080/03637759309376300
[6] Chuttur, M. (2009). Overview of the technology acceptance model: Origins, developments and future directions. https://aisel.aisnet.org/sprouts_all/290
[7] Scherer, R., Siddiq, F., Tondeur, J. (2019). The technology acceptance model (TAM): A meta-analytic structural equation modeling approach to explaining teachers’ adoption of digital technology in education. Computers & education, 128: 13-35. https://doi.org/10.1016/j.compedu.2018.09.009
[8] Marangunić, N., Granić, A. (2015). Technology acceptance model: A literature review from 1986 to 2013. Universal Access in the Information Society, 14(1): 81-95. https://doi.org/10.1007/s10209-014-0348-1
[9] Rauniar, R., Rawski, G., Yang, J., Johnson, B. (2014). Technology acceptance model (TAM) and social media usage: An empirical study on Facebook. Journal of Enterprise Information Management, 27(1): 6-30. https://doi.org/10.1108/JEIM-04-2012-0011
[10] Lee, H., Kim, D., Ryu, J., Lee, S. (2011). Acceptance and rejection of mobile TV among young adults: A case of college students in South Korea. Telematics and Informatics, 28(4): 239-250. https://doi.org/10.1016/j.tele.2010.04.002
[11] Dishaw, M.T., Strong, D.M. (1999). Extending the technology acceptance model with task–technology fit constructs. Information & Management, 36(1): 9-21. https://doi.org/10.1016/S0378-7206(98)00101-3
[12] Park, N. (2010). Adoption and use of computer-based voice over Internet protocol phone service: Toward an integrated model. Journal of Communication, 60(1): 40-72. https://doi.org/10.1111/j.1460-2466.2009.01440.x
[13] Shyu, S.H.P., Huang, J.-H. (2011). Elucidating usage of e-government learning: A perspective of the extended technology acceptance model. Government Information Quarterly, 28(4): 491-502. https://doi.org/10.1016/j.giq.2011.04.002
[14] Aburub, F., Alnawas, I. (2019). A new integrated model to explore factors that influence adoption of mobile learning in higher education: An empirical investigation. Education and Information Technologies, 24(3): 2145-2158. https://doi.org/10.1007/s10639-019-09862-x
[15] Katz, E., Blumler, J.G., Gurevitch, M. (1974). Utilization of mass communication by the individual. The Uses of Mass Communications: Current Perspectives on Gratifications Research, pp. 19-32.
[16] Chaouali, W. (2016). Once a user, always a user: Enablers and inhibitors of continuance intention of mobile social networking sites. Telematics and Informatics, 33(4): 1022-1033. https://doi.org/10.1016/j.tele.2016.03.006
[17] Basak, E., Calisir, F. (2015). An empirical study on factors affecting continuance intention of using Facebook. Computers in Human Behavior, 48: 181-189. https://doi.org/10.1016/j.chb.2015.01.055
[18] Guo, J., Liu, Z., Liu, Y. (2016). Key success factors for the launch of government social media platform: Identifying the formation mechanism of continuance intention. Computers in Human Behavior, 55: 750-763. https://doi.org/10.1016/j.chb.2015.10.004
[19] Chang, BH., Lee, S.E., Kim, B.S. (2006). Exploring factors affecting the adoption and continuance of online games among college students in South Korea: Integrating uses and gratification and diffusion of innovation approaches. New Media & Society, 8(2): 295-319. https://doi.org/10.1177/1461444806059888
[20] Gan, C., Li, H. (2018). Understanding the effects of gratifications on the continuance intention to use WeChat in China: A perspective on uses and gratifications. Computers in Human Behavior, 78: 306-315. https://doi.org/10.1016/j.chb.2017.10.003
[21] Hwang, H.S., Cho, J. (2018). Why instagram? Intention to continue using instagram among Korean college students. Social Behavior and Personality, 46(8): 1305-1315. https://doi.org/10.2224/SBP.6961
[22] Kim, H. (2020). The effects of gratifications on the continuance intention to use a mobile instant messenger service in group communication. Communication Research Reports.
[23] Rubin, A. (2002). The Uses-And-Gratifications Perspective of Media Effects. Media Effects Advances in Theory and Research, Lawrence Erlbaum Associates, London.
[24] Ruggiero, T.E. (2000). Uses and gratifications theory in the 21st century. Mass Communication & Society, 3(1): 3-37. https://doi.org/10.1207/S15327825MCS0301_02
[25] Bucknell Bossen, C., Kottasz, R. (2020). Uses and gratifications sought by pre-adolescent and adolescent TikTok consumers. Young Consumers, 21(4): 463-478. https://doi.org/10.1108/YC-07-2020-1186
[26] Bhattacherjee, A. (2001). An empirical analysis of the antecedents of electronic commerce service continuance. Decision Support Systems, 32(2): 201-214. https://doi.org/10.1016/S0167-9236(01)00111-7
[27] Ajzen, I. (2006). Constructing a Theory of planned Behavior Questionnaire. In: Amherst, MA.
[28] Ajzen, I. (1991). The theory of planned behavior. Organizational Behavior and Human Decision Processes, 50(2): 179-211. https://doi.org/10.1016/0749-5978(91)90020-T
[29] Sanne, P.N., Wiese, M. (2018). The theory of planned behaviour and user engagement applied to Facebook advertising. South African Journal of Information Management, 20(1): 1-10. https://hdl.handle.net/10520/EJC-f5b6e02a7
[30] Venkatesh, V. (2000). Determinants of perceived ease of use: Integrating control, intrinsic motivation, and emotion into the technology acceptance model. Information Systems Research, 11(4): 342-365. https://doi.org/10.1287/isre.11.4.342.11872
[31] Venkatesh, V., Morris, M.G., Davis, G.B., Davis, F.D. (2003). User acceptance of information technology: Toward a unified view. MIS Quarterly, 27(3): 425-478. https://doi.org/10.2307/30036540
[32] Joo, J., Sang, Y. (2013). Exploring Koreans' smartphone usage: An integrated model of the technology acceptance model and uses and gratifications theory. Computers in Human Behavior, 29(6): 2512-2518. https://doi.org/10.1016/j.chb.2013.06.002
[33] Jung, J., Chan-Olmsted, S., Park, B., Kim, Y. (2012). Factors affecting e-book reader awareness, interest, and intention to use. New Media & Society, 14(2): 204-224. https://doi.org/10.1177/1461444811410407
[34] Camilleri, M.A., Falzon, L. (2021). Understanding motivations to use online streaming services: Integrating the technology acceptance model (TAM) and the uses and gratifications theory (UGT). Spanish Journal of Marketing - ESIC, 25(2): 217-238. https://doi.org/10.1108/SJME-04-2020-0074
[35] Yang, H., Lee, H. (2018). Exploring user acceptance of streaming media devices: an extended perspective of flow theory. Information Systems and e-Business Management, 16(1): 1-27. https://doi.org/10.1007/s10257-017-0339-x
[36] Nagy, J.T. (2018). Evaluation of online video usage and learning satisfaction: An extension of the technology acceptance model. International Review of Research in Open and Distributed Learning, 19(1): 2886. https://doi.org/10.19173/irrodl.v19i1.2886
[37] Munoz-Leiva, F., Climent-Climent, S., Liébana-Cabanillas, F. (2017). Determinants of intention to use the mobile banking apps: An extension of the classic TAM model. Spanish Journal of Marketing-ESIC, 21(1): 25-38. https://doi.org/10.1016/j.sjme.2016.12.001
[38] Niehaves, B., Plattfaut, R. (2014). Internet adoption by the elderly: employing IS technology acceptance theories for understanding the age-related digital divide. European Journal of Information Systems, 23(6): 708-726. https://doi.org/10.1057/ejis.2013.19
[39] Wallace, L.G., Sheetz, S.D. (2014). The adoption of software measures: A technology acceptance model (TAM) perspective. Information & Management, 51(2): 249-259. https://doi.org/10.1016/j.im.2013.12.003
[40] Liu, I.F., Chen, M.C., Sun, Y.S., Wible, D., Kuo, C.H. (2010). Extending the TAM model to explore the factors that affect intention to use an online learning community. Computers & Education, 54(2): 600-610. https://doi.org/10.1016/j.compedu.2009.09.009
[41] Meng, K.S., Leung, L. (2021). Factors influencing TikTok engagement behaviors in China: An examination of gratifications sought, narcissism, and the Big Five personality traits. Telecommunications Policy, 45(7): 102172. https://doi.org/10.1016/j.telpol.2021.102172
[42] Churchill, G.A., Iacobucci, D. (2006). Marketing Research: Methodological Foundations. Dryden Press, New York.
[43] Tabachnick, B.G., Fidell, L.S. (2001). SAS for windows workbook for Tabachnick and Fidell using multivariate statistics. Allyn and Bacon.
[44] Comrey, A.L., Lee, H.B. (2013). A First Course in Factor Analysis. Psychology Press.
[45] Brislin, R.W. (1970). Back-translation for cross-cultural research. Journal of Cross-Cultural Psychology, 1(3): 185-216. https://doi.org/10.1177/135910457000100301
[46] Taylor, S., Todd, P. (1995). Decomposition and crossover effects in the theory of planned behavior: A study of consumer adoption intentions. International journal of research in marketing, 12(2): 137-155. https://doi.org/10.1016/0167-8116(94)00019-K
[47] Lee, E., Lee, J.A., Moon, J.H., Sung, Y. (2015). Pictures speak louder than words: Motivations for using Instagram. Cyberpsychology, Behavior, and Social Networking, 18(9): 552-556. https://doi.org/10.1089/cyber.2015.0157
[48] Tao, C., Zhu, L. (2020). Influencing factors of mobile short video app customers’ intention to continue using-based on the theory of use and satisfaction. Journal of Luoyang Normal University, 39(8): 34-39.
[49] Anderson, J.C., Gerbing, D.W. (1988). Structural equation modeling in practice: A review and recommended two-step approach. Psychological Bulletin, 103(3), 411-423.
[50] Hair, J. F. (2009). Multivariate data analysis. https://digitalcommons.kennesaw.edu/facpubs/2925/
[51] Schermelleh-Engel, K., Moosbrugger, H., Müller, H. (2003). Evaluating the fit of structural equation models: Tests of significance and descriptive goodness-of-fit measures. Methods of Psychological Research Online, 8(2): 23-74.
[52] Browne, M.W., Cudeck, R. (1992). Alternative ways of assessing model fit. Sociological methods & research, 21(2): 230-258. https://doi.org/10.1177/0049124192021002005
[53] Hulland, J. (1999). Use of partial least squares (PLS) in strategic management research: A review of four recent studies. Strategic management journal, 20(2): 195-204. https://doi.org/10.1002/(SICI)1097-0266(199902)20:2%3C195::AID-SMJ13%3E3.0.CO;2-7
[54] Nunnally, J.C., Bernstein, I.H. (1994). Psychological Theory. McGraw-Hill, New York.
[55] Fornell, C., Larcker, D.F. (1981). Evaluating structural equation models with unobservable variables and measurement error. Journal of marketing research, 18(1): 39-50. https://doi.org/10.1177/002224378101800104
[56] Avison, D., Pries-Heje, J. (2005). Research in information systems: A handbook for research supervisors and their students. Gulf Professional Publishing.
[57] Chin, W.W. (1998). Commentary: Issues and opinion on structural equation modeling. MIS Quarterly, 22(1): 7-16.
[58] Cohen, J. (1992). A power primer. Psychological Bulletin, 112(1): 155-159.
[59] Lu, X., Lu, Z. (2019). Fifteen seconds of fame: A qualitative study of Douyin, a short video sharing mobile application in China. In Social Computing and Social Media. Design, Human Behavior and Analytics: 11th International Conference, SCSM 2019, Held as Part of the 21st HCI International Conference, HCII 2019, Orlando, FL, USA, pp. 233-244. https://doi.org/10.1007/978-3-030-21902-4_17
[60] Dhir, A., Chen, G. M., Chen, S. (2017). Why do we tag photographs on Facebook? Proposing a new gratifications scale. New Media & Society, 19(4): 502-521. https://doi.org/10.1177/1461444815611062
[61] Bartsch, A. (2012). As time goes by: what changes and what remains the same in entertainment experience over the life span? Journal of Communication, 62(4): 588-608. http://dx.doi.org/10.1111/j.1460-2466.2012.01657.x
[62] Smock, A.D., Ellison, N.B., Lampe, C., Wohn, D.Y. (2011). Facebook as a toolkit: A uses and gratification approach to unbundling feature use. Computers in Human Behavior, 27(6): 2322-2329. https://doi.org/10.1016/j.chb.2011.07.011
[63] Bumgarner, B.A. (2007). You have been poked: Exploring the uses and gratifications of Facebook among emerging adults. First Monday, 12(11): 2026. https://doi.org/10.5210/fm.v12i11.2026
[64] Mull, I.R., Lee, S.E. (2014). “PIN” pointing the motivational dimensions behind Pinterest. Computers in Human Behavior, 33: 192-200. https://doi.org/10.1016/j.chb.2014.01.011
[65] Vaterlaus, J.M., Winter, M. (2021). TikTok: An exploratory study of young adults’ uses and gratifications. Social Science Journal. https://doi.org/10.1080/03623319.2021.1969882
[66] Curras-Perez, R., Ruiz-Mafe, C., Sanz-Blas, S. (2014). Determinants of user behaviour and recommendation in social networks: An integrative approach from the uses and gratifications perspective. Industrial Management and Data Systems, 114(9): 1477-1498. https://doi.org/10.1108/IMDS-07-2014-0219
[67] Wang, Y. (2020). Humor and camera view on mobile short-form video apps influence user experience and technology-adoption intent, an example of TikTok (DouYin). Computers in Human Behavior, 110: 106373. https://doi.org/10.1016/j.chb.2020.106373
[68] Scherr, S., Wang, K. (2021). Explaining the success of social media with gratification niches: Motivations behind daytime, nighttime, and active use of TikTok in China. Computers in Human Behavior, 124: 106893. https://doi.org/10.1016/j.chb.2021.106893
[69] Kim, K.J., Wang, S. (2021). Understanding the acceptance of the Internet of Things: an integrative theoretical approach. Aslib Journal of Information Management, 73(5): 754-771. https://doi.org/10.1108/AJIM-03-2021-0073
[70] Dhir, A., Kaur, P., Rajala, R. (2020). Continued use of mobile instant messaging apps: A new perspective on theories of consumption, flow, and planned behavior. Social Science Computer Review, 38(2): 147-169. https://doi.org/10.1177/0894439318806853
[71] Dalvi-Esfahani, M., Wai Leong, L., Ibrahim, O., Nilashi, M. (2020). Explaining Students’ Continuance Intention to Use Mobile Web 2.0 Learning and Their Perceived Learning: An Integrated Approach. Journal of Educational Computing Research, 57(8): 1956-2005. https://doi.org/10.1177/0735633118805211
[72] Chakraborty, I., Kapoor, U., Ilavarasan, P.V. (2020). There is nothing real! A study of nonuse of TikTok in India. In Re-imagining Diffusion and Adoption of Information Technology and Systems: A Continuing Conversation: IFIP WG 8.6 International Conference on Transfer and Diffusion of IT, TDIT 2020, Tiruchirappalli, India, pp. 287-302. https://doi.org/10.1007/978-3-030-64861-9_26
[73] Lu, X., Lu, Z., Liu, C. (2020). Exploring TikTok use and non-use practices and experiences in China. In Social Computing and Social Media. Participation, User Experience, Consumer Experience, and Applications of Social Computing: 12th International Conference, SCSM 2020, Held as Part of the 22nd HCI International Conference, HCII 2020, Copenhagen, Denmark, pp. 57-70. https://doi.org/10.1007/978-3-030-49576-3_5
[74] Owens, J.C. (2020). Netflix pulled off a showstopper early in the pandemic, but will the sequel deserve the price? Market Watch.
[75] Erz, A., Marder, B., Osadchaya, E. (2018). Hashtags: Motivational drivers, their use, and differences between influencers and followers. Computers in Human Behavior, 89: 48-60. https://doi.org/10.1016/j.chb.2018.07.030
[76] Yang, Y., Ha, L. (2021). Why people use TikTok (Douyin) and how their purchase intentions are affected by social media influencers in China: A uses and gratifications and parasocial relationship perspective. Journal of Interactive Advertising, 21(3): 297-305. https://doi.org/10.1080/15252019.2021.1995544