Diomande Siaho*![]() | Pandry Koffi Ghislain
| Pandry Koffi Ghislain![]() | Kadjo Tanon Lambert
| Kadjo Tanon Lambert![]() | Kakou Kouassi Ernest
| Kakou Kouassi Ernest![]() | Oumtanaga Souleymane
| Oumtanaga Souleymane![]() | Assidjo Nogbou Emmanuel
| Assidjo Nogbou Emmanuel![]()
© 2023 IIETA. This article is published by IIETA and is licensed under the CC BY 4.0 license (http://creativecommons.org/licenses/by/4.0/).
OPEN ACCESS
The cocoa bean is a grain which is the raw material for the economy of Côte d'Ivoire. Thus, throughout the bean value chain, particular attention is paid to quality. In this chain, storage remains an imported step. Indeed, insects are one of the pests causing enormous damage and losses in the conservation of stored grains. These insects are also present during the storage of cocoa beans. The proliferation of insects is due to several physico-chemical and environmental factors such as water content (Te), sugar content (TSu) and temperature (T°) which interact in the bean ecosystem. This proliferation remains difficult to control and estimate. In this work, we invented a method based on neural networks to determine the evolution of insect density. Indeed, an Insect Dynamics Model (MDI) has been established. To validate the effectiveness of the proposed method, we have chosen as performance criteria the coefficient of determination R²=0.9982. This shows a good correlation of the experimental values and those predicted. This result was obtained, with an optimal 4-5-1 architecture selected by Akaike's information criterion.
cocoa bean, grain, artificial neural network, insects, Akaike information criterion
The preservation of grain is an important element for storage organizations to ensure the permanent supply of markets. Thus, maintaining full quality during storage remains a major challenge because the grains to be marketed must comply with the requirements and standards that govern these markets. Compliance with these standards is of great interest to the scientific community [1]. This challenge is made more complex by climate, environment and/or biotic factors that can jeopardize conservation. There is a degradation of the initial quality due in part to attacks by insects. These seed-eating insects are the main causes of health and economic damage [2]. This damage can reach 30% of gross production if no action is taken [3, 4]. Therefore, it remains essential to improve conservation techniques, which makes it possible to reduce post-harvest losses [5]. According to Siaho et al. [6] the conservation of cocoa beans is no exception; it also faces these same difficulties. To overcome the phenomenon of infestation, several works have been proposed. Concerning cocoa, active studies on controlled and modified atmospheres as well as the effects of packaging on beans have been carried out to extend their shelf life. However, these methods are necessary and difficult to implement. Moreover, in the field of cocoa, no model of insect dynamics has yet been proposed to our knowledge. This contribution aims to propose a new approach for predicting the evolution of insects based on artificial neural networks.
1.1 Insect pests of stored
The presence of live insects in stocks represents an obstacle to the marketing of the grains because they damage and compromise the initial quality of the stored product. 50% of damage to cocoa beans occurs following attacks by insects such as the coleoptera Tribolium castaneum (tenebrionidae), causing economic losses estimated at 3.16 billion US dollars [7]. Thus, the provision of improved storage systems makes it possible in most cases to better protect the stored product and therefore limit losses [8]. To stay alive, insects need food, air, and water. Stored beans are favorable places for the residence and development of insects [8]. The bean includes a set of nutrients such as sugars, free amino acids, or water proteins [9, 10]. It should be noted that poorly preserved grain will spontaneously heat up, which initially favors the development of insects. This is the mechanism of infestation. During this mechanism, the insects consume the grain and cause an increase in temperature due to their metabolic activities which accelerate the heating of the beans. When this warming reaches a certain threshold, we see the appearance, in the presence of humidity, of the mechanism of mold growth which is also harmful to the quality of the cocoa beans [6, 11]. There are two types of storage insects according to their impacts on the grains (beans): primary insects and secondary insects. The primary insects are composed of very small beetles (weevils, beetles, bruchids); certain Lepidoptera and butterflies (Ephestia cautella, Araecerus faciculatus, Lasioderma serricorne), whose biological activity depreciates the food and whose larvae are harmful because they eat the inside of the grains [12]. Most species develop at temperatures of 18℃ <T° <40℃ [5]. This biological activity not only compromises the quality and commercial value of the stored beans, but also promotes the development of microorganisms. As for the secondary insects, they develop outside the grains, their larvae and pupae are therefore visible in an infested stock. Also referred to as free-form insects only. Thus, the morphology and development cycle of certain insects make their detection and control complex [13]. Therefore, a good understanding of the grain ecosystem as well as insect dynamics is of great importance to guarantee the volume and quality of storage. Several studies have been conducted to eradicate or to predict the abundance of insects during conservation.
1.2 Methods of insect control
Plant protection products are commonly used to control insects. However, in a few years, the number of these products has been considerably reduced [14], and increasingly oriented towards the exclusion of their use. The use of alternative methods then becomes an obligation because the exclusive use of insecticide can lead to the appearance of resistant insects [15]. Another method is the placement of insect traps above the stocks. Regular monitoring of these traps makes it possible to detect the presence of insects early and to implement curative methods if the infestation is minimal. However, these curative control methods still consist in most cases of treating the grains with a contact insecticide.
Fumigation is also an interesting technique for implementing an insecticide gas in a cell or hutch, but it has human and environmental disadvantages [16]. Environmental damage, human health problems and the emergence of resistance are pushing scientists to seek alternatives to synthetic insecticides. This is a first step towards developing a new model for alternative stored product pest management strategies [17]. Despite the large number of possible control techniques and the diversity of products used, the range of measures applicable by farmers and storage organizations is still limited. Also given the fact that no single technique gives on its own, complete satisfaction, we are moving more and more towards their judicious and reasoned combination in order to achieve an increasingly effective fight [18]. This search for alternative solutions to these treatments has been productive with several integrated protection approaches. The components of integrated protection start from an identification of insect species to storage forecasting methods and monitoring tools considering the concept of harmfulness threshold to develop technical storage itineraries and alternative methods.
Several integrated methods approaches have been proposed and validated by projects such as the QualiGrain, EcopréservGrain and EcoprotectGrain Qualigrain projects [13]. Among these current practices, Integrated Pest Protection (PAI). Although the PAI seems to be the most demanding among the others and applied to cereals according to the principles of organic farming and the wheat charter. However, the PAI is slow to be put into common practice for the protection of conventional culture stocks, those intended to supply the mass export markets [19]. Similarly, insect prediction models are empirical models based on the history (development time, number of eggs laid) of insect development as a function of several parameters, mainly temperature and grain moisture. These experimental models can be presented as mathematical equations resulting from nonlinear regressions, relating the parameters influencing the temporal dynamics of insect development [11]. However, these models are associated with very expensive infestation detection techniques [20, 21].
Recently, some authors such as Banga et al. [22] have proposed using techniques from artificial intelligence and acoustics, in this case artificial neural networks, for the prediction of the abundance of insects in chickpeas. According to them, the problem of predicting insects could be linked to a lack of appropriate method of detecting insects, preferably at an early stage of their growth cycle, to take preventive measures at the right time. These researchers have shown that the use of this technique could improve prediction results compared to regression methods by relying on the performance of detection methods. Some work like that done [22] has shown that modern engineering and acoustics have been incorporated into decision support systems for stored product insect management, but with somewhat limited due to device costs [23] and the skills needed to interpret the data collected. Thus, Mankin et al. [22] tested machine learning (ML) to describe the movement of adults and larvae of Sitophilus oryzae (Coleoptera: Curculionidae) and their feeding in grains,
Lutz and Coradi [24] proposed to improve this method by evaluating ongoing studies on the use of sensors in stored grains, the precepts of the Internet of Things (IoT) and technologies for machine learning (ML) in post-harvest to identify resources and new opportunities for technological development that can help in the quality control of stored grain. It shows that the results collected in real time allow better decision-making in situations where there is a risk of loss and deterioration of the stored grains due to variations in factors such as water content, temperature of the mass of the grains and the relative humidity of the intergranular air. Thus, the quality of stored grain can be predicted by monitoring moisture content. However, this work only considered the contribution of grain moisture content and temperature or moisture content and CO2. To extend the effectiveness of the prediction, it would be necessary to associate it with the sugar content which, according to the study [25], showed that the sugar content is one of the key factors to ensure the functions of maintenance and reproduction. Because sugars play an essential role as building blocks for insects, but also as a source of energy.
1.3 Neural network
Neural networks (ANN) are a model test to approximate the functioning of neurons in the human brain. An artificial neuron is a mathematical operator, whose value depends on parameters called coefficients or weights [26]. The variables of this function are usually called the "inputs" of the neuron and the value of the function is called its "output". The neuron generates the output by applying the previously chosen activation function to a linear combination of the inputs. More concretely, a neuron is composed of an input layer accepting input variables denoted x with a bias, weight w, an activation function denoted here σ and one or more values output y. We thus have the following formula [27]:
$y=\sigma\left(w_0+\sum_{j=1}^p w_j x_j\right)$ (1)
Neural networks are involved in several fields relating to optimization [28, 29], prediction [30, 31], image recognition [32], signal processing [33, 34], diagnosis [35]. The structure of neural networks, adapted to the non-linear problem, promotes the success of its use. Integrating new technologies such as ANN will allow an ever-increasing development of the agricultural sector, especially post-harvest handling [21, 22, 24, 36]. To this end, according to the study [37], given the complexity of the ecosystem of stored products, ANNs are of considerable contribution in the prediction of phenomena related to this environment. In post-harvest handling, different types of neural networks have been used to make predictions [38]. There are several types of neural networks such as multilayer, recurrent, and deep networks. Among these, feed-forward (FFN) and recurrent network (RNN) RNAs have been the most used to describe drying kinetics in cocoa. Thus in 2015, the authors Nogbou et al. showed that recurrent neural networks have an ability to predict water content during microwave drying. The performance was possible with an optimal 3-10-1 neural architecture (3 neurons on the input layer, 10 neurons on the hidden layer and one neuron on the output layer) [39].
The difference between FFNs and RNNs lies in the structure of the network. There is at least one cycle in the structure of RNNs unlike FFNs whose interconnection is from input to output. The network training techniques are the same as for conventional networks (gradient backpropagation). RNNs make it possible to predict the dynamics of a population. However, an inherent problem in the use of RNNs is the difficulty of retaining contextual information over large time intervals. This phenomenon is due according to Morillot et al. to the fading of the gradient [40]. A model of the evolution of the water content of cocoa beans was made using a multilayer perceptron in the context of drying [27]. To better understand solar drying, a modeling was carried out. Thus, the 2-2-1 architecture (two neurons on the input layer, two neurons on the hidden layer and one neuron on the output layer) was best suited to make this prediction.
Therefore, ANN could make a significantly effective prediction on insect density in cocoa beans to reduce post-harvest losses. The literature presents very few studies on the prediction of insects concerning stored cocoa beans. Also, the different methods for predicting bio aggressors have not taken advantage of the sugar content parameter as indicated [6]. Especially since the sugar content plays an essential role in the maintenance and reproduction functions of insects [25]. Thus, in this work, we propose a neural network-based approach that merges not only water content with integration of sugar content, but also temperature, to improve the prediction of insect density.
Regarding insects, temperature, water content and sugar content, data were collected from the monitoring program of physico-chemical, entomological and environmental parameters. Statistical methods, namely regression and ANN methods, were used and evaluated for their effectiveness in predicting pest incidence in cocoa beans [41].
2.1 Experimental work
Experimental data was obtained by measuring the water content, insects, and the amount of sugar in cocoa beans stored in jute bags for 52 weeks. The various bags were placed on pallets (1 m×70 cm), in a store at ambient temperature (20-36℃). Every two weeks, three bags are taken at random, considering the heterogeneity of the beans. The value of the parameter at a given time is then the mean value.
2.1.1 Determination of sugar content
The determination of the sugar content was carried out using the Dubois sulfuric phenol method [42, 43] The principle of which is stated as follows. In the presence of strong acid, the glycosidic bonds of sugars are hydrolyzed, giving furfural derivatives. Then the aldehyde function of these furfural derivatives condenses with the hydroxyl of a phenolic compound to give reddish-colored acetals whose intensity is proportional to the concentration of total sugars in the medium.
One hundred (100) microliters of water-soluble sugar extract are introduced into a test tube and, successively, 200 µL of 5% (w/v) phenol and 1 mL of concentrated sulfuric acid are added. After cooling away from light, a volume of 3.7 mL of distilled water is poured into the tube and the optical density is read at 490 nm, against a blank, using a SPECTRONIC® GENESYS™ 5 brand spectrophotometer.
A standard range is established from a stock solution of 1 mg/mL of sucrose by following the indications in Table 1. The quantity of total sugars of each sample is obtained by projecting the D.O of the said sample on the standard line.
Table 1. Fructose standard range for the determination of total sugars
|
Tube |
White |
1 |
2 |
3 |
4 |
5 |
|
Volume Sucrose 1mg/ml (ml) |
0 |
0.02 |
0.04 |
0.06 |
0.08 |
0.1 |
|
H2O (ml) |
0.1 |
0.08 |
0.06 |
0.04 |
0.02 |
0 |
|
Phénol (ml) |
0.2 |
0.2 |
0.2 |
0.2 |
0.2 |
0.2 |
|
Sulfuric acid (ml) |
1 |
1 |
1 |
1 |
1 |
1 |
|
H2O (Qsp=5ml) |
3.7 |
3.7 |
3.7 |
3.7 |
3.7 |
3.7 |
2.1.2 Insect count
All the bags sampled were sent to the Zoology and Entomology Laboratory of the Agriculture and Animal Resources Training and Research Department (DFR-ARA) of the INP-HB to determine the populations of insects present in the different batches. To do this, the samples were sieved using a 5 mm mesh sieve to collect adult insects and larvae. The insects collected were identified, under a binocular microscope (x 40), using different identification keys [44-47].
2.1.3 Determination of water content
The evolution of the water content of the bean’s during storage was determined by parboiling according to the ISO 2451(2017) standard. To determine it, a mass P1=5g of cocoa powder is weighed into an empty capsule of mass P0. The crucible and sample assembly are left to dry at 103℃ ± 2℃ for 16 hours ± 15 minutes in a Memmert brand oven, 854 shwabach. After steaming, the whole dried full capsule is weighed: either P2 this mass,
The water content (Te) is expressed as a percentage of dry mass and is calculated from the following formula:
$\% T_e=\frac{P_1-\left(P_2-P_0\right)}{P_1} \times 100$ (2)
2.2 Modeling by neural networks
2.2.1 Elaboration of the neuronal structure
Our database was implemented in the artificial neural network module of the Matlab R2022b software (Math Works Inc., Massachusetts USA). The database has been normalized according to the reduced centered law see Eq. (3) This database includes variables such as water content (Te), sugar content (TSu), insect density (I), duration conservation (t) and temperature (T°). The reduced variable symbolized by X (aj) is determined for all the variables aj of the statistical test according to Eq. (3). Then, it was split into three subsets, randomly, to determine the weights and biases of the network. 50% of the data, i.e., 133 observations, served as a learning basis, 25% (66 observations) was used for validation and the remaining 25% made it possible to test the validity of the model that was retained.
$X\left(a_j\right)=\frac{1}{\sqrt{2 \pi}} \mathrm{e}^{\left(-\frac{a_j^2}{2}\right)}$ (3)
The variable X (aj) is a reduced centered variable.
We used a multi-layer perceptron whose number of nodes in the hidden layer k was varied arbitrarily in an interval of 1 to 15 to determine the optimal topology. The hyperbolic tangent function was used as the activation function for all hidden layer neurons and the identity function as the output layer activation function [31]. For the training of our data sample, we used the Levenberg Marquardt algorithm given its speed of convergence and its stability [48]. It provides a numerical solution to the problem of minimizing a nonlinear function depending on several variables. And the validation phase took place simultaneously with the learning phase. Thus, each time the weights were determined in the learning phase, the prediction error defined in the Eq. (7) was measured throughout the validation. However, the validation of the neural model was achieved by the Correlation coefficient (R). The R quantifies the strength of the linear relationship between the predicted values and the experimental values, so the formula is at Eq. (5). By the Mean Squared Error (MSE), we had checked the reliability of the models relating to the different architectural behaviors according to Eq. (4). Finally, the coefficient of determination in Eq. (6), which made it possible to measure the adequacy between the retained neural model and the observed data.
2.2.2 Model selection criteria
To estimate the performance of our neural model, we used metrics such as:
The Mean Squared Error (MSE). It is defined as follows:
$M S E=\frac{1}{N} \sum_{k=1}^N\left[y-y_p\right]^2$ (4)
The performance index, EQM is provided by the learning (backpropagation) algorithm for the different iterations. This algorithm updates the weights and the bias in the direction of minimizing the EQM performance index as quickly as possible. Learning was considered complete after 163 epochs (optimal number obtained by simulation), for any entry in the learning base.
The correlation coefficient (R) and the determination coefficient (R2). In the context of the regression, the formulas are as follows:
$R=\frac{\sum_{j=1}^N(y-\bar{y})\left(y_p-\bar{y}_p\right)}{\sqrt{\sum_{j=1}^N(y-\bar{y})^2} \sqrt{\sum_{j=1}^N\left(y_p-\bar{y}_p\right)^2}}$ (5)
$R^2=\frac{\sum_{j=1}^N\left(y_p-\bar{y}\right)^2}{\sum_{j=1}^N(y-\bar{y})^2}$ (6)
with y: the experimental values.
yp: the values predicted by the network for j=1; …; N.
$\bar{y}_p$ and $\bar{y}$ the respective means of the values predicted by the network and the experimental values.
The prediction error (e): The parameter was calculated by using the following equation:
$e=y_p-y$ (7)
However, metrics such as the MSE, the correlation coefficient are certainly known to increase the performance of a model but have limits when it comes to comparing models of the same structure or of different structures. In this work, to better discriminate between models of the same structure, we used Akaike's information criterion (AIC) [49], whose formula is as follows:
$A I C=-2 \log (L)+2 k$ (8)
where, L is the maximized likelihood and the number of parameters in the model. With this criterion, model deviation (-2log(L)) is penalized by twice the number of parameters. And k represents the number of model parameters to be estimated. AIC therefore represents a compromise between bias (which decreases with the number of parameters) and parsimony (need to describe the data with the smallest possible number of parameters).
Most of the works carried out in different fields use a maximum likelihood estimation (MLE) approach based on the AKAIKE information criterion for a better model choice [50]. This is because AIC estimates the relative amount of information lost by a given model: the less information a model loses, the higher the quality of that model [51].
3.1 Selected topology
The configuration of our topology depends on both the number of hidden layers and the number of neurons on each layer.
Choice of the number of hidden layers: The ability of the network to translate coexisting relationships depends on its architecture [31]; moreover, when constructing the neural network, it is essential to determine an appropriate network topology. According to the study [31], the architecture of networks containing a structure with a hidden layer seems to perform better for nonlinear regression models of biological systems [52]. In this work, we then adopt a neural network with a single hidden layer for modeling the evolution of insect density in stored cocoa bean ecosystems.
Choice of the number of neurons on the hidden layer (NNCC): To obtain an optimal architecture, we varied the NNCC from 1 to 15. To obtain the value of which provides the good architecture, we will proceed in two stages. The first step was made based on the correlation coefficient obtained for each NNCC and the second step was made based on the AIC. Here, the order is important because the AIC does not have the ability to certify that a model is good or not. Therefore, it is necessary to first confirm the validity and reliability of the model starting with the correlation coefficient.
In Table 1, the correlation coefficient from rank k≥3 to order 2 provides significantly better results. It therefore seems appropriate to us to choose the k from rank 3. However, the choice of k one with large values necessarily implies an increase in the calculation time of the ANN model. About Table 1, from rank 5 to order 3 the values of the correlation coefficient are practically identical. Thus, one can choose k$\in$[3;5] without however losing the idea of the choice of the optimal architecture. However, a problem arises for the choice of the value of k.
Table 2. Values of the correlation coefficient during training
|
Numbers of neurons on the hidden layer |
Learning |
Validation |
|
R |
R |
|
|
1 |
0.68388195 |
0.67879486 |
|
2 |
0.91900502 |
0.91234032 |
|
3 |
0.9849594 |
0.98450903 |
|
4 |
0.9981532 |
0.99803073 |
|
5 |
0.99951832 |
0.99949668 |
|
6 |
0.99980784 |
0.99846207 |
|
7 |
0.99991079 |
0.99985674 |
|
8 |
0.99995484 |
0.9999497 |
|
9 |
0.99996994 |
0.99995668 |
|
10 |
0.99998437 |
0.99996879 |
|
11 |
0.99999435 |
0.99998511 |
|
12 |
0.99998871 |
0.99995796 |
|
13 |
0.99999764 |
0.99993329 |
|
14 |
0.99999442 |
0.99995877 |
|
15 |
0.99999819 |
0.99991272 |
The second step was done using AIC. Table 2 presents the calculated AIC values of each model relative to the number of neurons in the hidden layer. For each of the architectures, we evaluate the AIC using parameters such as the number of weights and number of observations (n=266) in our dataset. The architecture with the minimum AIC value is selected to model the evolution of insect density in cocoa beans. From Table 3, we can observe that, the architecture with neurons in the hidden layer has the very smallest value of AIC (-795.451903). This explains that with this architecture, the loss of information is much less compared to other architectures relating to each AIC values. According to the study [51] the less information a model loses, the higher the quality of this model.
Table 3. AIC values
|
Numbers of neurons on the hidden layer |
Number of parameters in the model (Number of weights) |
AIC |
|
3 |
19 |
-529.918059 |
|
4 |
25 |
-710.283563 |
|
5 |
31 |
-795.451903 |
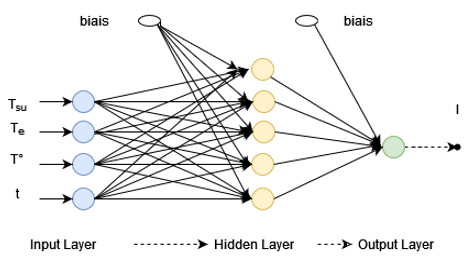
Thus, the 4-5-1 architecture could best fit our dataset. The 4-5-1 architecture, four (04) inputs, five (05) neurons in the hidden layer and one (01) output.
The neural network topology diagram used to model insect density (see in Figure 1).
The computational capabilities of a neural network reside in the connections that exist between neurons. Each connection is assigned a numerical value called weight (W). Thus, the weights of the connections between the neurons of the hidden layer and those of the input layer are represented in Table 4 and those between the neurons of the hidden layer and the output are in Table 5. The biases (b) also are represented relative to the neurons of the hidden layer and that of the output in Tables 4 and 5.
Figure 1. Architecture of the optimal neural network
The bias of a neuron represents the error committed by the neuron during the calculation of the output value. The different outputs of neurons in the hidden layer are expressed by Eqns. (9), (10), (11), (12) and (13) respectively.
$I_1^{\prime}=\operatorname{TanH}\left(w_{11} t^{\prime}+w_{21} T_{s u}^{\prime}+w_{31} T_e^{\prime}+w_{41} T^{\circ \prime}+b_1\right)$ (9)
$I_2^{\prime}=\operatorname{TanH}\left(w_{12} t^{\prime}+w_{22} T_{s u}^{\prime}+w_{32} T_e^{\prime}+w_{42} T^{\circ \prime}+b_2\right)$ (10)
$I_3^{\prime}=\operatorname{TanH}\left(w_{13} t^{\prime}+w_{23} T_{s u}^{\prime}+w_{33} T_e^{\prime}+w_{43} T^{\circ^{\prime}}+b_3\right)$ (11)
$I_4^{\prime}=\operatorname{Tan} H\left(w_{14} t^{\prime}+w_{24} T_{s u}^{\prime}+w_{34} T_e^{\prime}+w_{44} T^{\circ \prime}+b_4\right)$ (12)
$I_5^{\prime}=\operatorname{TanH}\left(w_{15} t^{\prime}+w_{25} T_{s u}^{\prime}+w_{35} T_e^{\prime}+w_{45} T^{0^{\prime}}+b_5\right)$ (13)
with:
I’1: Value at the output of the first neuron of the hidden layer;
I’2: Value at the output of the second neuron of the hidden layer;
I’3: Value at the output of the third neuron of the hidden layer;
I’4: Value at the output of the fourth neuron of the hidden layer;
I’5: Value at the output of the fifth neuron of the hidden layer;
t', TSu', T'e, T°' and are the respective normalized values of time, sugar content, water content and temperature.
Our regression model is obtained by the normalized value of the density of insects in the cocoa beans at the outlet of the network. This model is expressed by Eq. (14):
$I^{\prime}=w_1 I_1^{\prime}+w_2 I_2^{\prime}+w_3 I_3^{\prime}+w_4 I_4^{\prime}+w_5 I_5^{\prime}+b_6$ (14)
with I’ the value of the network output.
Table 4. Values of the weights and biases of the inputs
|
Weight |
W1• |
W2• |
W3• |
W4• |
b• |
|
W•1 |
2.11589 |
0.5634938 |
0.20776 |
-0.0012241 |
0.23375 |
|
W•2 |
7.29814 |
0.5806209 |
2.12002 |
0.0116812 |
2.14592 |
|
W•3 |
0.54869 |
2.8152292 |
4.87110 |
0.0359566 |
1.32918 |
|
W•4 |
8.08575 |
1.1286869 |
0.34999 |
0.0046426 |
1.91934 |
|
W•5 |
7.29701 |
0.1143821 |
0.94078 |
0.0078723 |
1.93280 |
Table 5. Values of the weights and biases of the output
|
Weight |
W1 |
W2 |
W3 |
W4 |
W5 |
b6 |
|
Values |
-2.109 |
-24.063 |
-0.2286 |
21.6799 |
47.505 |
-0.9011 |
3.2 Validation of optimal neural architecture
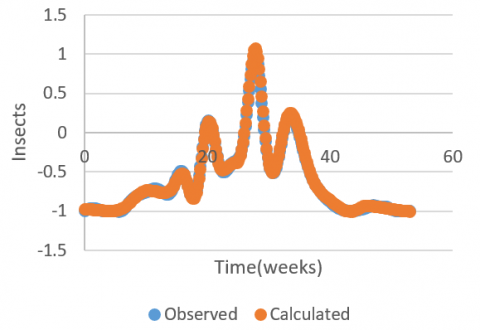
Validation of the 4-5-1 topology neural model was performed by the coefficient of determination between the values predicted by the network and the experimental ones of the remaining measurements from the database (Figure 2). This result with a coefficient of determination equal to 0.9982, showing that our model is close to reality by 99.82%.
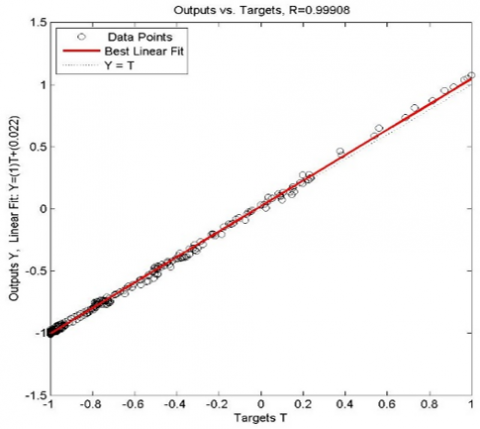
Also Figure 3 confirms the performance of our neural network with an R-value very close to 1.
Figure 2. Experimental and simulated curve of the evolution of insect density
Figure 3. Evaluation of model for prediction of insect density
The main technique used in this study is the AIC for the choice of the optimal values of hyperparameters of the neuronal architecture. Thus, the experimental results with an equal to 0.9982 confirmed the relevance of our choice of the 4-5-1 architecture, after tests on the data set. This high value of R², indicates that a good model has been built for the prediction of insect density. In the same way, a high R² was obtained in the prediction of the infestation caused by C.chinensis and C.maculatus in the chickpeas stored without and in the isolated conditions with an ANN architecture comprised a hidden layer with a input layer (variable X) and an output layer (variable Y) [21]. Similar studies not with ANNs but with multiple linear regression (MLR) models predicted uric acid and protein content as indices of Sitophilus granarius infestation in wheat with as high (0.958; 0.978) respectively. In the same order, with ANN, the backpropagation MLP approach was used to classify Rhyzopertha dominica infestation in stored and wheat found 98.9% accuracy [53]. In most predictions of insects in grains in general, we observe R² greater than 0.90, also showing the robustness of ANNs.
The results reinforced the hypothesis that ANNs could successfully predict the evolution of insect density in cocoa beans. This prediction is of importance in terms of reducing post-harvest fumigation treatments and related losses. The ANN technique can be adopted to assess insect population growth in cocoa bean storage as a decision support tool in any cocoa bean storage facility.
In this study, we proposed a perceptron-based model for the prediction of insect evolution in cocoa beans. The results show that the neural network can predict the evolution of insect density while highlighting the relationship with water content, sugar content because of the stored bean ecosystem whose abiotic parameters and biotics interact. This model will allow storage organism systems and makers to reduce insect populations well below pest levels in non-aerated beans and can potentially eliminate the need for fumigations.
It is important to note that for the time being, to our knowledge, the data on the conservation of cocoa beans are not of large volume of data. However, certain authors such as Banga et al have used data of a small size in their deep learning models [21]. Nevertheless, we plan to work later much larger data.
|
AIC |
Akaike's information criterion |
|
ANN |
neural networks |
|
b |
biases |
|
CO2 |
carbon dioxide |
|
FFN |
feed-forward |
|
I |
insect density |
|
L |
maximized likelihood |
|
MLE |
maximum likelihood estimation |
|
MLR |
multiple linear regression |
|
MLP |
multi-layer perceptron |
|
MSE |
mean squared error |
|
NNCC |
the number of neurons on the hidden layer |
|
RNN |
recurrent network |
|
PAI |
integrated pest protection |
|
P |
mass |
|
Te |
water content |
|
TSu |
sugar content |
|
W |
weight |
[1] Bizier, V., Laffiteau, E., Torelli, C. (2020). Capacité des États africains à produire des données pour le suivi de l’ODD 2.
[2] Ngom, D., Fauconnier, M.L., Malumba, P., Thiaw, C., Brévault, T., Sembène, M. (2021). Morphophysical and biochemical traits involved in maize grain varietal susceptibility to the maize weevil, Sitophilus zeamais (Coleoptera, Curculionidae). Biotechnologie, Agronomie, Société et Environnement, 25(1): 45-56. https://doi.org/10.25518/1780-4507.18876
[3] Cissokho, P.S., Gueye, M.T., Sow, E.H., Diarra, K. (2015). Substances inertes et plantes à effet insecticide utilisées dans la lutte contre les insectes ravageurs des céréales et légumineuses au Sénégal et en Afrique de l’Ouest. International Journal of Biological and Chemical Sciences, 9(3): 1644-1653. https://doi.org/10.4314/ijbcs.v9i3.43
[4] Cruz, J.F., Hounhouigan, J.D., Fleurat-Lessard, F. (2016). La conservation des Grains Après Récolte. Editions Quae.
[5] Cruz, J.F., Hounhouigan Djidjoho, J., Havard, M., Ferré, T. (2020). La transformation des grains (p. 198). éditions Quae. https://doi.org/10.35690/978-2-7592-2784-6
[6] Siaho, D., Ghislain, P., Lambert, K.T., Ernest, K.K., Souleymane, O., Emmanuel, A.N. (2021). Hybrid modeling prey predator-genetic algorithm of mold growth during cacao beans storage. International Journal of Advanced Research (IJAR), 9: 256-264. https://doi.org/10.21474/IJAR01/12442
[7] Jung, J.M., Byeon, D.H., Kim, S.H., Lee, W.H. (2020). Estimating economic damage to cocoa bean production with changes in the spatial distribution of Tribolium castaneum (Herbst)(Coleoptera: Tenebrionidae) in response to climate change. Journal of Stored Products Research, 89: 101681. https://doi.org/10.1016/j.jspr.2020.101681
[8] Edde, P.A. (2012). A review of the biology and control of Rhyzopertha dominica (F.) the lesser grain borer. Journal of Stored Products Research, 48: 1-18. https://doi.org/10.1016/j.jspr.2011.08.007
[9] Gbogbri, G.F. (2019). Impact de la fermentation sur les propriétés antioxydantes, anti-inflammatoires et immunomodulatrices du cacao. Doctoral dissertation, Université Montpellier.
[10] Chen-Yen-Su, A. (2020). Analyse du potentiel qualitatif des cacaos de Madagascar (Doctoral dissertation, Université de la Réunion).
[11] Bettahar, F. (2016). Conception et prototypage d'un système complet pour la surveillance du grain dans les silos de stockage (Doctoral dissertation, Université Toulouse le Mirail-Toulouse II).
[12] Kouiakou, B.J., Irie, B.Z., N’goran, K.E., Kouame, B., Dick, A.E., Kone, D. (2018). Caractérisation des insectes et des champignons infestant les fèves de cacao dans les principales zones de production en Côte d’Ivoire. European Scientific Journal, 14(33): 298-312. http://dx.doi.org/10.19044/esj.2018.v14n33p298
[13] Fleurat-Lessard, F. (2018). Gestion intégrée de la protection des stocks de céréales contre les insectes sans traitement insecticide rémanent. Phytoma, 716: 32-40.
[14] Aubert, M., Huat, J., Parrot, L. (2020). L’organisation collective au cœur du processus de réduction des produits phytosanitaires: le cas des maraichers mahorais. Revue de l’organisation responsable, 15(3): 28-41. https://doi.org/10.3917/ror.153.0028
[15] Taquet, A. (2020). Évolution de la résistance aux insecticides au sein d’un complexe d’espèces de ravageurs dans un contexte d’invasion biologique: Coût de la résistance et rôle de l’hybridation. Doctoral dissertation, Université de la Réunion.
[16] Emadi, A., Jayedi, A., Mirmohammadkhani, M., Abdolshahi, A. (2022). Aflatoxin reduction in nuts by roasting, irradiation and fumigation: A systematic review and meta-analysis. Critical Reviews in Food Science and Nutrition, 62(18): 5056-5066. https://doi.org/10.1080/10408398.2021.1881436
[17] Majumder, A., Adak, D., Bairagi, N. (2021). Persistence and extinction of species in a disease-induced ecological system under environmental stochasticity. Physical Review E, 103(3): 032412. https://doi.org/10.1103/PhysRevE.103.032412
[18] Nanfack, F.M., Dongmo,Y.Z., Fogang, M.A.R. (2023). Les insectes impliqués dans les pertes post-récolte des céréales au Cameroun : Méthodes actuelles de lutte et perspectives offertes par la transgénèse. International Journal of Biological and Chemical Sciences, 9(3): 2015. https://doi.org/10.4314/ijbcs.v9i3.42
[19] Fleurat-Lessard, F. (2013). Les freins à la diversification des productions d’oléo-protéagineux et de céréales au niveau des entreprises de collecte, stockage et mise en marché. OCL, 20(4): D406. https://doi.org/10.1051/ocl/2013010
[20] Mishra, G., Srivastava, S., Panda, B.K., Mishra, H.N. (2018). Rapid assessment of quality change and insect infestation in stored wheat grain using FT-NIR spectroscopy and chemometrics. Food Analytical Methods, 11: 1189-1198. https://doi.org/10.1007/s12161-017-1094-9
[21] Banga, K.S., Mohapatra, D., Babu, V.B., Giri, S.K., Bargale, P.C. (2020). Assessment of bruchids density through bioacoustic detection and artificial neural network (ANN) in bulk stored chickpea and green gram. Journal of Stored Products Research, 88: 101667. https://doi.org/10.1016/j.jspr.2020.101667
[22] Mankin, R., Hagstrum, D., Guo, M., Eliopoulos, P., Njoroge, A. (2021). Automated applications of acoustics for stored product insect detection, monitoring, and management. Insects, 12(3): 259. https://doi.org/10.3390/insects12030259
[23] Shah, F.M., Razaq, M. (2020). From agriculture to sustainable agriculture: Prospects for improving pest management in industrial revolution 4.0. In: Hussain, C.M., Di Sia, P. (eds) Handbook of Smart Materials, Technologies, and Devices. Springer, Cham. https://doi.org/10.1007/978-3-030-58675-1_76-1
[24] Lutz, E., Coradi, P.C. (2022). Applications of new technologies for monitoring and predicting grains quality stored: Sensors, internet of things, and artificial intelligence. Measurement, 188: 110609. https://doi.org/10.1016/j.measurement.2021.110609
[25] Raynard, Y. (2018). Impact d’une alimentation enrichie en lipides sur les paramètres biologiques de l’adulte du genre Trichogramma. Doctoral dissertation, Universidade de São Paulo, Escola Superior de Agricultura «Luiz de Queiroz», Laboratório de Biologia de Insetos Departamento de Entomologia e Acarologia Avenida Pádua Jours, 11 CEP 13418-900 Piracicaba, Brasil.
[26] Karoui, A. (2021). Méthodes numériques pour la résolution de problèmes inverses en électrocardiographie. Doctoral dissertation, Bordeaux.
[27] Karidioula, D., Akmel, D.C., Assidjo, N.E., Trokourey, A. (2018). Modélisation du séchage solaire de fèves de cacao par le Réseau de Neurones Artificiel. International Journal of Biological and Chemical Sciences, 12(1): 195-202. https://doi.org/10.4314/ijbcs.v12i1.15
[28] Lacharme, G., Cardot, H., Lenté, C., Monmarché, N. (2022). Optimisation d'hyperparamètres appliquée aux réseaux de neurones convolutifs (CNN). In 23ème congrès annuel de la Société Française de Recherche Opérationnelle et d'Aide à la Décision.
[29] Khalifa, R.B., Chroud, N., Yahia, N.B. (2021). Optimisation de la conception des assemblages soudés par les réseaux de neurones. In 4ème Colloque Assemblages Mécaniques, p. 56.
[30] Benatiallah, D., Benatiallah, A., Bouchouicha, K., Nasri, B. (2020). Prediction du rayonnement solaire horaire En utilisant les reseaux de neurone artificiel. Algerian Journal of Environmental Science and Technology, 6(1).
[31] Wawrzyniak, J. (2021). Prediction of fungal infestation in stored barley ecosystems using artificial neural networks. LWT, 137: 110367. https://doi.org/10.1016/j.lwt.2020.110367
[32] Zemouri, R., Devalland, C., Valmary-Degano, S., Zerhouni, N. (2019). Intelligence artificielle: quel avenir en anatomie pathologique? Annales de Pathologie, 9(2): 119-129. https://doi.org/10.1016/j.annpat.2019.01.004
[33] Mariotte, T., Larcher, A., Thomas, J.H., Montrésor, S. (2022). Traitement multi-microphone pour la segmentation automatique de la parole en réunion. In 16ème Congrès Français d'Acoustique, CFA2022.
[34] Beghil, A. (2022). Classification des sigaux ECG par des réseaux de neurones. Doctoral dissertation.
[35] Ndong, B., Djigo, M.S., Mboup, M.L., Diop, O., Bathily, E., Tall, K., Mnaye, G., Mbodj, M., Farssi, S.M. (2021). Méthode d’apprentissage des réseaux de neurones artificiels pour une aide au diagnostic des métastases osseuses en scintigraphie. Médecine Nucléaire, 45(4): 192. https://doi.org/10.1016/j.mednuc.2021.06.040
[36] Kongwong, P., Boonyakiat, D., Pongsirikul, I., Poonlarp, P. (2021). Application of artificial neural networks for predicting parameters of commercial vacuum cooling process of baby cos lettuce. Journal of Food Process Engineering, 44(5): e13674. https://doi.org/10.1111/jfpe.13674
[37] Ramachandran, R.P. (2022). Integrated approach on stored grain quality management with CO2 monitoring-A review. Journal of Stored Products Research, 96: 101950. https://doi.org/10.1016/j.jspr.2022.101950
[38] Côté, M.A. (2017). Réseaux de neurones génératifs avec structure. Doctoral dissertation, Ph. D. thesis. Université de Sherbrooke.
[39] Igor, N.A.L., Clement, A.D., Kouakou, B., Emmanuel, A.N. (2015). Modelisation de la cinetique de sechage des feves de cacao par des modeles semi-empiriques et par un reseau de neurones artificiels recurrent: Cas du sechage microonde par intermittence. European Scientific Journal, 11(9).
[40] Morillot, O. (2014). Reconnaissance de textes manuscrits par modèles de Markov cachés et réseaux de neurones récurrents: Application à l'écriture latine et arabe. Doctoral dissertation, Paris, ENST.
[41] Chaqroun, A., Achemal, B., Darmoul, S. Prédiction et contrôle du trafic urbain à l’aide des réseaux de neurones artificiels.
[42] DuBois, M., Gilles, K.A., Hamilton, J.K., Rebers, P.T., Smith, F. (1956). Colorimetric method for determination of sugars and related substances. Analytical Chemistry, 28(3): 350-356. https://doi.org/10.1021/ac60111a017
[43] Diakité, M., Daou, C., Konaré, M.A., Togola, I., Keita, S., Diarra, N. (2022). Composition et caractéristique physico-chimiques du fruit de Carapa procera DC récolté au Mali. IJAR, 8(4): 252-258. https://doi.org/10.22271/allresearch.2022.v8.i4d.9670
[44] Halstead, D.G.H. (1986). Keys for the identification of beetles associated with stored products. I—Introduction and key to families. Journal of Stored Products Research, 22(4): 163-203. https://doi.org/10.1016/0022-474X(86)90011-1
[45] Delobel, A., Tran, M. (1993). Les Coléoptères des denrées alimentaires entreposées dans les régions chaudes (Vol. 32). IRD Editions.
[46] Waongo, A., Yamkoulga, M., Dabire-Binso, C.L., Ba, M.N., Sanon, A. (2013). Conservation post-récolte des céréales en zone sud-soudanienne du Burkina Faso: Perception paysanne et évaluation des stocks. International Journal of Biological and Chemical Sciences, 7(3): 1157-1167. https://doi.org/10.4314/ijbcs.v7i3.22
[47] Ngamo, L.S.T., Hance, T.H. (2007). Diversité des ravageurs des denrées et méthodes alternatives de lutte en milieu tropical. Tropicultura, 25(4): 215-220.
[48] Yu, H., Wilamowski, B.M. (2018). Levenberg–Marquardt Training. In Intelligent Systems. CRC Press.
[49] Akaike, H. (1974). A new look at the statistical model identification. IEEE Transactions on Automatic Control, 19(6): 716-723. https://doi.org/10.1109/TAC.1974.1100705
[50] Malki, F., Ikraoun, H., Nassiri, L., Ibijbijen, J. (2022). Détermination des paramètres d’évaluation du stock de carbone dans les écosystèmes forestiers (Cedrus atlantica Manetti, cèdre de l’Atlas au Maroc): méthodes spécifiques et génériques. BOIS & FORETS DES TROPIQUES, 351: 67-77. https://doi.org/10.19182/bft2022.351.a36330
[51] Benali, F., Bodénès, D., Labroche, N., de Runz, C. (2022). MTCopula: Génération de données synthétiques et complexes basées sur les Copules. Extraction et Gestion des Connaissances: EGC'2022, 38.
[52] Alghooneh, A., Behbahani, B.A., Noorbakhsh, H., Yazdi, F.T. (2015). Application of intelligent modeling to predict the population dynamics of Pseudomonas aeruginosa in Frankfurter sausage containing Satureja bachtiarica extracts. Microbial pathogenesis, 85: 58-65. https://doi.org/10.1016/j.micpath.2015.06.003
[53] Srivastava, S., Mishra, G., Mishra, H.N. (2019). Probabilistic artificial neural network and E-nose based classification of Rhyzopertha dominica infestation in stored rice grains. Chemometrics and Intelligent Laboratory Systems, 186: 12-22. https://doi.org/10.1016/j.chemolab.2019.01.007