Youssef Boutazart![]() | Ouissam Zealouk*
| Ouissam Zealouk*![]() | Hassan Satori
| Hassan Satori![]() | Anselme Russel Affane Moundounga
| Anselme Russel Affane Moundounga![]() | Khalid Satori
| Khalid Satori![]()
© 2023 IIETA. This article is published by IIETA and is licensed under the CC BY 4.0 license (http://creativecommons.org/licenses/by/4.0/).
OPEN ACCESS
This paper describes the clustering technique for provinces-territories in Morocco and countries of the world at risk of the COVID-19 epidemic. Based on this proposed method, we have used COVID-19 Moroccan dataset, on August 18, 2021, with the higher new death number. The COVID-19 dataset for countries is based from the Worldometer on November 25, 2021. In this study, we employed K-Means algorithm, Elbow - Silhouette Methods and statistics analysis using new ‘Confirmed – Death’ two-dimensional data for Moroccan prefectures - provinces and new ‘Confirmed-Death-Recovered’ three-dimensional data for world countries. Our results show that, the clustering method generated 3 prefecture - provincial groups for Morocco, with similar types of ‘Confirmed – Death’ cases, and is able to group world countries into 4 clusters, with similar types of ‘Confirmed – Death – Recovered’ cases. Our study can be considered as a model for all countries, for analysis of COVID-19, and help political leaders and health authorities make the right decisions.
clustering technique, COVID-19, K-means algorithm, elbow and silhouette methods, dataset analysis
At the end of 2019, a novel coronavirus was identified as the cause of a cluster of patients with pneumonia cases in Wuhan, a city in the Hubei Province of China, caused by a β-coronavirus. Chinese scientists very quickly isolated SARSCoV-2 from a patient on January 7, 2020, which led to the sequencing of the SARS-CoV-2 genome [1]. Lakshmanarao et al. [2] have presented a study based An Efficient COVID-19 Epidemic Analysis and Prediction Model Using Machine Learning Algorithms. The coronavirus COVID-19 were subsequently reported worldwide, affecting almost all countries and territories around the world. Most recently, the COVID-19 pandemic affected more than two hundred and sixty million people and killed more than five million people worldwide. From November 22 to 28, 2021, the world has had 260.493.573 total cumulative cases with 3.799.878 total new cases and 5.195.354 cumulative deaths with 47.524 new deaths. This information is based on World Health Organization [3].
Zealouk et al. [4] and Hamidi et al. [5] have presented studies analyzing of COVID-19 Resulting Cough Using Formants and Automatic Speech Recognition System. In another study, Boutazart et al. [6] explored a COVID-19 dataset is analyzed using a combination of K-Means and Expectation-Maximization (EM) algorithms to cluster the data. The results indicate that the EM-based GMM method is the preferred clustering method as it yields smaller classification error rates. The K- Means generated clusters provide limited information, and the best clustering was found with four and three clusters.
On the other hand, Hamad et al. [7], Wu et al. [8] have developed the clustering statistical data analysis in many fields, as Dynamic Ad Hoc Network Nodes Movement Based on FCM Algorithm and Routing Protocol in Wireless Sensor Network of Frozen Food. Abdullah et al. [9] have studied the risk of COVID-19 pandemic based on coronavirus disease 2019 data using the K-Means Clustering method. Clustering generated 3 provincial groups. Their objective is an attempt to determine the closeness or similarity of a province based on confirmed, recovered, and death cases. Aydin and Yurdakul [10] have employed the data analysis by the weighted stochastic and machine learning algorithms, particularly, K-Means and hierarchic clustering techniques to determine the performances of 142 countries against the COVID-19 pandemic. Their obtained results show that the optimum number of clusters is three. Zarikas et al. [11] aim for a new analysis that produces the clustering countries with respect to three categories (active cases, active cases per population, and active cases per population and per area), their work is based on a clustering algorithm adapted to the request for comparison of the several COVID-19 time-series of different countries. Another work by Gohari et al. [12] deals with clustering techniques for many countries according to the COVID-19 incidence and mortality rates. They studied a three-step approach for identifying longitudinal patterns of change in quantitative COVID-19 incidence and mortality rates. The results obtained are three different patterns for the trajectories of COVID-19 incidence and three different ones for mortality rates. In another study, Rizvi et al. [13], Carrillo-Larco and Castillo-Cara [14] have developed the K-Means Algorithm to define data clusters of countries based on several factors such as economic, social, health, and environmental related metrics affecting the COVID-19 pandemic spread. Kurniawan et al. [15] have investigated the spread outbreak prediction for many countries, applying K-Means clustering and correlation methods on a COVID-19 dataset. Syakur et al. [16] proposed a combination of the K-Means method with Elbow to improve efficiency and effective K-Means performance in processing large amounts of data identification of the best customer profile cluster. Zubair et al. [17] explored an efficient K-Means clustering method that determines the initial centroids of the clusters efficiently. Based on this proposed method, they have determined health care quality clusters of countries utilizing the COVID-19 datasets.
The objective of this work is to exploit, the K-Means algorithm, Elbow- Silhouette methods, and statistics analysis to classify prefectures and provinces in Morocco firstly, and clustering of World Countries for COVID-19 cases secondly. We have proposed the following COVID-19 dataset “Confirmed - Death” and “Confirmed - Death - Recovered” to try to estimate the best possible clustering.
The rest of the paper is designed as follows: In Section 2, we introduced the K-Means algorithm. In Section 3, describes the COVID-19 Dataset. The proposed method is introduced in section 4. The results of analyses and discussions are presented in Section 5 and in the last Section 6 conclusions and future research directions are provided.
In this section, we present theoretical formalism for K-Means algorithm as in Bishop and Nasrabadi [18]. Given then a set of observations $\boldsymbol{Y}=\left(Y_l, \ldots, Y_N\right)$, independent and identically distributed where each observation $Y_t=\left(y_{t 1}, \ldots, y_{t j}, \ldots, y_{t d}\right)^{\prime} \in \mathbb{R}^d$ is a d-dimensional real vector. The K-Means algorithm aims to partition the $N$ observations into $\mathrm{G}$ sets. Each data point gets assigned to one (and only one) of the $\mathrm{k}$ components. Let $\mu=\left(\mu_1, \ldots, \mu_G\right)$ be the set represents the mean of each cluster $C_k$, where $C_k \in C=\left\{C_l, \ldots, C_G\right\}$ the set of $\mathrm{G}$ clusters, and let $Z=\left(z 1, \ldots, z_N\right)$ the set of binary indicator variables, in this part our objective is to find values for $z_{t k}$ and $\mu_k$ the mean so as to minimize $D$.
$D=\sum_{t=1}^N \sum_{k=1}^G z_{t k}\left\|Y_t-\mu_k\right\|^2$ (1)
where, $z_{t k}=1$ when $Y_t$ is a member of $C_k$, otherwise $z_{t k}=0$. Or more exactly $\operatorname{argmin}_k D$ when $D$ achieved minimal value, sum of $\left\|Y_t-\mu_k\right\|^2$ is minimal. $\left\|Y_t-\mu_k\right\|$ is the norm of distance.
$\left\|\mathrm{Y}_{\mathrm{t}}-\mu_{\mathrm{k}}\right\|=d\left(\mathrm{Y}_{\mathrm{t}}, \mu_{\mathrm{k}}\right)=\sqrt{\sum_{j=1}^d\left(\mathrm{y}_{\mathrm{tj}}-\mu_{\mathrm{kj}}\right)^2}$ by Euclidean distance. The centroid $\mu_k$ in Eq. (1) can be to estimate as follows:
$\frac{\partial D}{\partial \mu_k}=\frac{\partial}{\partial \mu_k} \sum_{t=1}^N \sum_{k=1}^G z_{t k}\left\|Y_t-\mu_k\right\|^2=0$ (2)
Then we obtain μk the geometric centroid of the cluster Ck in Eq. (3) as follows:
$\mu_k=\frac{\sum_{t=1}^N z_{t k} \cdot Y_t}{\sum_{t=1}^N z_{t k}}$ (3)
We can do this through an iterative procedure in which each iteration involves two successive steps corresponding to successive optimizations with respect to $z_{t k}$ and $\mu_k$. We initialize the class centers $\left\{\mu_1^{(0)}, \ldots, \mu_G^{(0)}\right\}$ for $C$, by some initial values called seed-points, using methodically sampling.
Step 1:
We minimize $D$ and we update $z_{t k}$, keeping the $\mu_k$ fixed.
Step 2:
We minimize $D$ and we update $\mu_k$, keeping the $z_{t k}$ fixed.
$\mu_k^{(m+1)}=\frac{\sum_{t=1}^N \mathrm{z}_{t k}^{(m)} \cdot \mathrm{Y}_{\mathrm{t}}}{\sum_{t=1}^N \mathrm{z}_{t k}^{(m)}}$ (4)
where, $m$ being the current iteration. The $\mu_k$ at iteration $(m+1)$ is given in Eq. (4), this two-stage optimization is then repeated until convergence. The K-Means Algorithm is perfectly suited to the clustering method for Moroccan Prefecture-Province and World Countries.
In the present study, the COVID-19 Moroccan data was obtained on August 18, 2021. The data was retrieved from the official website (www.covidmaroc.ma/Pages/Accueilfr.aspx, last accessed: November 24 2021, 11:06 GMT). On March 2, 2020, Morocco detected the first case of this epidemic. On August 18, 2021, Moroccan health authorities announced the country’s highest number of deaths. Morocco has had 9462 new confirmed cases the number of new deaths has increased to 127 cases and 9570 new cured cases. On the other hand, COVID-19 many countries dataset is received through the COVID-19 live - coronavirus official website (http://worldometers.info/coronavirus, last accessed: November 25, 2021, 13:39 GMT).
In this section, we present an application of K-Means algorithm and Elbow-Silhouette analysis to determine the optimal clusters for two categories which are according to the new ‘confirmed – death cases for the Moroccan region and province and the new’ confirmed - death - recovered’ cases for World Countries.
4.1 Clustering method
In this part, the two and three-dimensional COVID-19 datasets will be trained with code “kmeans.h” structure in the Numerical Recipes header [19]. We have explored and adapted this code using C++. For the following, the pseudocode describing the function K-Means is formalized:
1. K-Means method is designed to partition COVID-19 dataset into Ck clusters, the groups partition into clusters so that the Sum of Squares Errors (SEE) is minimized. The convergence is guaranteed.
Input: Given a COVID-19 dataset points and G.
Output: COVID-19 dataset with cluster memberships.
2. Initialization
Choose the number Ck clusters and obtain the data point, and we place methodically the centroids {μ1, …, μG}.
3. Perform Step 1:
Assign each data point from COVID-19 dataset to clusters Ck whose mean μk it is closest to by Euclidean distance.
4. Perform Step 2:
For all k, re-estimate μk as the average of data point assigned to clusters Ck.
5. Repeat steps 1 and 2 until they are no more changes in the membership of COVID-19 dataset.
6. The convergence is obtained when there are no data point from COVID-19 dataset migrations from one cluster to another.
4.2 Elbow and silhouette analysis
The Elbow method is used in combination with Silhouette analysis, generated by python 3.8.1 code, for a more evaluated decision, for finding the optimal number of clusters. We will use the two COVID-19 databases. The Elbow technique is utilised for determining the consistency of the optimal number of clusters [20]. When Yt is a member of Ck the Eq. (1) can be rewritten as Eq. (5).
$S S E=\sum_{t=1}^N \sum_{Y_t \in C_k}\left\|Y_t-\mu_k\right\|^2$ (5)
SSE inside clusters is plotted against the number of clusters, using the COVID-19 dataset for Moroccan prefecture-province and world countries. The Elbow algorithm pseudo-code is explained below:
1. Compute clustering algorithm, by varying k from 1 to G.
Input: Given COVID-19 datasets and G.
Output: SSE and New G.
2. For each k, calculate SSE, SSE=[ ].
3. For k=1, G, k is in rang (1, Vi) for V1=12 concerning Moroccan region and province and V2=8 concerning world countries do.
4. Estimated SEE value.
5. Return to SSE, G.
Plot the curve of SSE according to the number of clusters k. The location of the Elbow in the plot is indicates the optimal cluster number. Sometimes an Elbow is not visible on the curve, this represents a complicated choice on the number of clusters. On the other hand, the Silhouette algorithm is also a method to find the optimal number of clusters. Rousseeuw [21] and Batool and Hennig [22] have developed a cluster analysis and proposed computing the silhouette coefficient for different values of k. The Silhouette method gives a degree of separation between clusters. The silhouette parameters for every k (See from (Eq. 6) to (Eq. (9)), can be expressed in this way:
For $t$ each data point, we first define: $l(t) \in\{l, \ldots, G\}$ for $t=1, \ldots, N$ where $l(t)=r$, for $r=$ $\{1, \ldots, G\} \Leftrightarrow Y_t \in C_r$.
$\mathrm{S}_t=\frac{b_t-a_t}{\max \left(b_t, a_t\right)}$, with $-1 \leq \mathrm{S}_t \leq 1$ (6)
$\mathrm{a}_t=\frac{1}{\mathrm{~N}_{l(t)}-1} \sum_{l(t)=l(m) ; t \neq m} d\left(\mathrm{Y}_{\mathrm{t}}, \mathrm{Y}_{\mathrm{m}}\right)$ (7)
$\begin{gathered}\mathrm{b}_t=\min _{r \neq l(t)} \frac{1}{N_r} \sum_{l(m)=r} d\left(\mathrm{Y}_{\mathrm{t}}, \mathrm{Y}_{\mathrm{m}}\right) \text { where } \\ N_r=\sum_{t=1}^N \mathbb{1}(l(t)=r)\end{gathered}$ (8)
The Average Silhouette for every k is:
$S=\frac{1}{N} \sum_{t=1}^N S_t$ (9)
The procedure of this method to select the optimal cluster number is described as follows:
1. Compute clustering algorithm for different values of k.
Input: Given COVID-19 dataset and G.
Output: St, S and New G.
2. Compute at: The average distance of that point with all other points in the same clusters.
3. Compute bt: The average distance of that point with all the points in the closest cluster to its cluster.
4. Compute St.
5. Compute S: Average Silhouette S.
The values of St and S give the clustering quality, they are always between -1 and 1.
The training dataset used in this here reflects the reel COVID-19 cases. The clustering is done with a two-dimensional dataset ‘new confirmed – new recovered’ features of 72 samples for Moroccan prefectures and provinces, and a three-dimensional dataset ‘new confirmed – new death –new recovered’ features of 150 samples for world countries.
5.1 Analysis two-dimensional ‘Confirmed – Death’ data
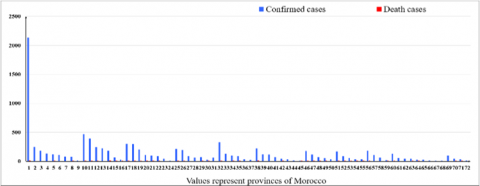
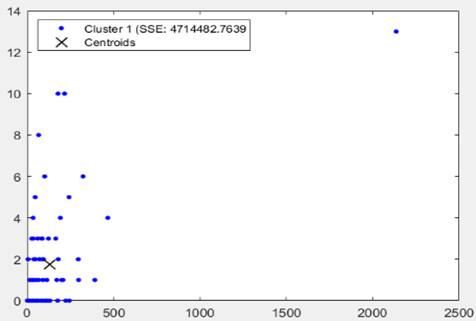
On August 18, 2021, Morocco has the highest number of deaths since the COVID-19 outbreak. In Figure 1 Moroccan economic capital Casablanca has recorded 2135 new confirmed cases and 13 new deaths cases. In Figure 2 (a), the visualization of the scatter plot, based on Matlab, for the 72 Moroccan prefectures and provinces, shows that Casablanca city can be a formed one cluster. In the following Moroccan COVID-19 is used without Casablanca prefecture.
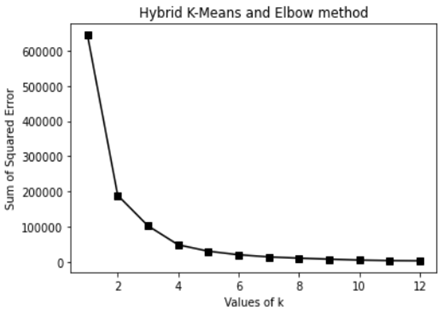
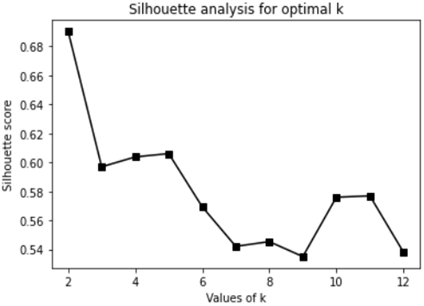
In the Elbow method, we pick a range of k=[1, 12], after applying K-Means clustering using each of the values of k, to find the average distance of each point in a cluster to its centroid. In the above plot, there is a sharp fall in the average distance at k=2 and 3 (See Figure 3). In this case, comes confusion to pick the best value of k. The Elbow method is used in combination with the Silhouette method for a more evaluated decision. Figure 4 illustrates silhouette score is maximized at k=2. We will take 2 clusters. The output result, for K-Means clustering, has turned with Numerical recipes code for k=2 is given in Table 1. The 17 prefecture - province belongs to C1 and C2contains 54 prefecture and province. The convergence is reached after 30 iterations; the process existed after 2.018 seconds. The results provided in this section are very satisfying. Our results are in accordance with those of Hutagalung et al. [23] and Abdullah et al. [24]. The Table 2 shows the belonging Moroccan prefecture and province to C1, C2 and C3.
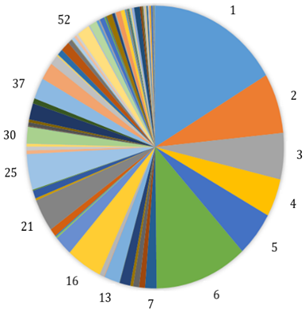
Figure 1. COVID-19 ‘New confirmed – New death’ cases distribution by Moroccan prefectures and provinces
(a)
(b)
Figure 2. (a) Scatter plot between ‘new confirmed cases and new death cases’ of the 72 Moroccan prefectures and provinces; without clustering; (b) Scatter plot for clusters k=2, without Casablanca prefecture; the centroids are marked with a cross.
Figure 3. Result of Elbow method to find optimal number of clusters for Moroccan COVID-19 data
Figure 4. Result of Silhouette method to find optimal number of clusters for Moroccan COVID-19 data
Table 1. Choice initial values and affectation 72 Moroccan prefectures and provinces
|
Clusters Ck |
Initial province |
The initial values |
Number of provinces at convergence |
Centroids at convergence |
|
C1 |
1 |
μ1=[2135.00 13.00]’ |
1 |
μ1=[2135.00 13.00]’ |
|
C2 |
35 |
μ2=[143.51 1.91]’ |
17 |
μ2=[246.00 3.00]’ |
|
C3 |
36 |
μ3=[64.28 1.30]’ |
54 |
μ3=[58.10 1.17]’ |
Table 2. List of 72 Moroccan prefectures and provinces according to the cluster
|
Clusters |
Moroccan prefectures and provinces |
|
C1 |
1. Casablanca |
|
C2 |
2. Mohammadia, 3. Nouaceur, 10. Kénitra,11. Skhirate-Témara, 12. Rabat, 13. Sidi- Kacem, 14. Salé, 17. Tétouan, 18. M'Diq-Fnideq, 19. Tanger-Assilah, 25. Oujda-Angad, 26. Nador, 32. Agadir-Ida -Ou-Tanane, 38. Marrakech, 46. Ouarzazate, 51. Béni Mellal, 56. Laâyoune |
|
C3 |
4. El Jadida, 5. Berrechid, 6. Benslimane, 7. Médiouna, 8. Settat, 9. Sidi Bennour, 15. Sidi Slimane, 16. Khémisset, 20. Al Hoceima, 21. Ouezzane, 22. Chefchaouen, 23. Larache, 24. Fahs anjra, 27. Guercif, 28. Driouch, 29. Berkane. 30. Taourirt, 31. Figuig, 33. Inezgane- Ait Melloul, 34. Taroudannt, 35. Tiznit, 36. Chtouka- Ait Baha, 37. Tata, 39. El Kelâa des Sraghna, 40. Safi, 41. Youssoufia, 42. Rehamna, 43. Essaouira, 44. Chichaoua, 45. Al Haouz, 47. Errachidia, 48. Tinghir, 49. Zagora, 50. Midelt, 52. Khénifra, 53. Fquih Ben Salah, 54. Azilal, 55. Khouribga, 57. Boujdour, 58. Es-Semara, 59. Tarfaya, 60. Fès, 61. Taza, 62. Meknès, 63. Sefrou, 64. El Hajeb, 65. Taounate, 66. Ifrane, 67. Moulay Yaacoub, 68. Boulemane, 69. Oued Ed-Dahab, 70. Guelmim, 71. Sidi Ifni, 72. Assa-Zag |
5.2 Analysis three - dimensional ‘Confirmed – Death – Recovered’ data
This section is designed to demonstrate the obtained results by using the proposed approach. Based statistical analysis (see Table 3), the mean and standard deviation of 6 countries and 150 countries are large. We can conclude these six countries form one cluster. Afterward, we employ clustering analysis for three-dimensional ‘Confirmed – Death – Recovered’ data for 144 countries of the world (Figure 5). The technical study is the same as that in two dimensions. The dataset will be partitioned into clusters for a range of values of [1,8]. We selected metho-dically k points as the initial cluster centers where the points are counted in order. The initial point’s number of Ck is 144/k. Then we determine the initial centroids µk. After the first implementation, we obtain the new values of the centroids, and convergence values using the K-Means algorithm run with code Numerical recipes. Table 4 presents the distribution of World Countries. The Silhouette and Elbow methods are used together for a more confident result.
Table 3. Statistics description for 150 world countries based COVID-19 dataset
|
Features |
Countries |
Maximum |
Mean |
Standard deviation |
|
New confirmed cases |
150 |
104819 |
4230.09 |
12234.50 |
|
New death cases |
1594 |
47.56 |
152.16 |
|
|
New recovered cases |
76003 |
2868.16 |
8693.60 |
|
|
New confirmed cases |
USA - UK - Russia Turkey - France - Germany |
104819 |
52700.33 |
27842.60 |
|
New death cases |
1594 |
407.33 |
535.89 |
|
|
New recovered cases |
76003 |
32262.66 |
24506.55 |
(a) New confirmed cases
(b) New death cases
(c) New recovered cases
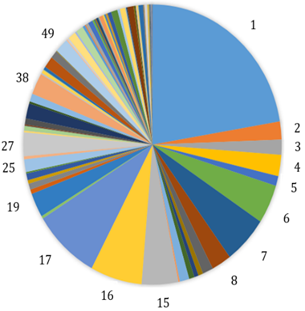
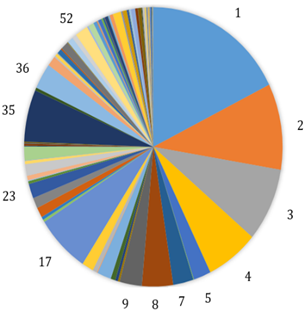
Figure 5. Countries new cases distribution on November 25, 2021
Table 4. Choice initial values and affectation 150 world countries at convergence for best clustering
|
Clusters Ck |
Initial counties |
The initial values |
Nr. of world countries at convergence |
Centroids at convergence |
|
C1 |
144 |
μ1=[2210.50 32.57 1643.37]’ |
144 |
μ1=[2210.50 32.57 1643.37]’ |
|
C1 |
72 |
μ1=[4135.26 60.77 3106.28]’ |
13 |
μ1=[14278.10 187.38 11220]’ |
|
C2 |
72 |
μ2=[285.73 4.36 180.46 ]’ |
131 |
μ2=[1012.95 17.21 693.02]’ |
|
C1 |
48 |
μ1=[5633.79 84.17 2442.19]’ |
3 |
μ1=[25993.70 205 3982.33]’ |
|
C2 |
48 |
μ2=[881.98 12.02 623.08]’ |
11 |
μ2=[10317 .40 170.54 12839.20]’ |
|
C3 |
48 |
μ3=[115.73 1.52 64.83 ]’ |
130 |
μ3=[975.69 16.91 642.05]’ |
|
C1 |
36 |
μ1=[6437.53 98.58 4987.25]’ |
3 |
μ1=[25993.70 205 3982.33]’ |
|
C2 |
36 |
μ2=[1833 22.97 1225.31]’ |
6 |
μ2=[10019.80 242.17 17903.20]’ |
|
C3 |
36 |
μ3=[513.66 7.94 300.11]’ |
20 |
μ3=[6317.60 70.45 3460.00]’ |
|
C4 |
36 |
μ4=[57.81 0.78 60.81]’ |
115 |
μ4=[468.35 10.55 418.08]’ |
|
C1 |
28 |
μ1=[6416.25 111.46 4701.43]’ |
3 |
μ1=[25993.7 205 3982.33]’ |
|
C2 |
29 |
μ2=[3433.03 36.03 2708.07 ]’ |
8 |
μ2=[10333.6 122.5 8688.12]’ |
|
C3 |
29 |
μ3=[1027.24 13.07 715.83]’ |
3 |
μ3=[10274 298.67 23908.7]’ |
|
C4 |
29 |
μ4=[258.76 4.38 125.34]’ |
24 |
μ4=[3870.88 54.16 2174.75]’ |
|
C5 |
29 |
μ5=[62.24 0.62 71.62]’ |
106 |
μ5=[320.18 8.48 295.03]’ |
|
C1 |
24 |
μ1=[18833.10 209.24 12243]’ |
3 |
μ1=[25993.70 255 3982.33]’ |
|
C2 |
24 |
μ2=[3873.32 43.36 3112.64]’ |
2 |
μ2=[13068 360 27497.50]’ |
|
C3 |
24 |
μ3=[1762.04 16.08 1202.36]’ |
6 |
μ3=[11999.80 138.33 8375.17]’ |
|
C4 |
24 |
μ4=[687.68 13.68 525.24]’ |
3 |
μ4=[5118.67 108.66 11995.70]’ |
|
C5 |
24 |
μ5=[162.00 2.36 60.60]’ |
24 |
μ5=[3870.88 54.16 2174.75]’ |
|
C6 |
24 |
μ6=[62.40 0.72 65.04]’ |
106 |
μ6=[320.17 8.48 295.02]’ |
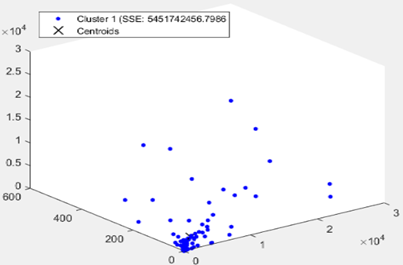
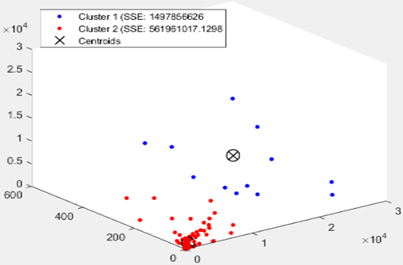
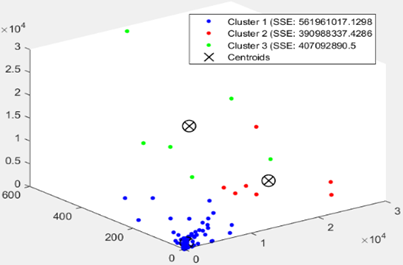
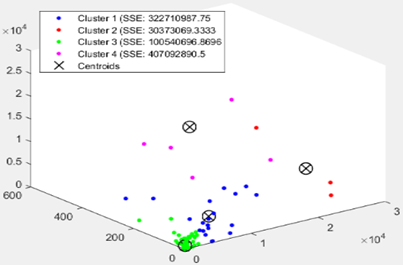
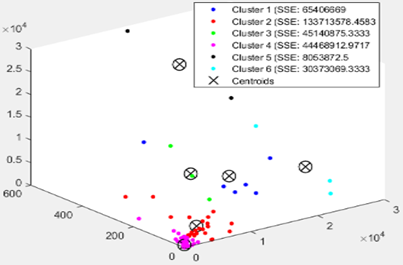
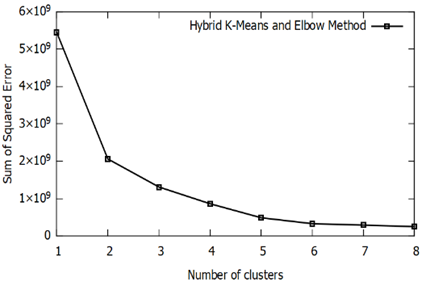
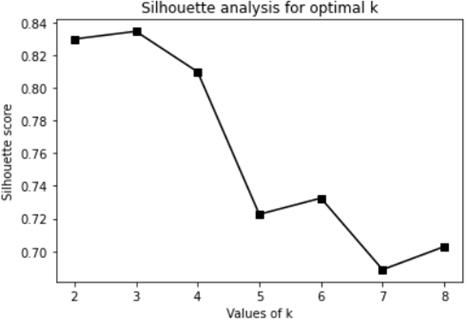
The Figure 6 shows a scatter plot of clusters COVID-19 Word Countries tri-dimensional dataset, formed from k=1 to k=6 which are clearly visualizing the representation centroids of each cluster. In Figure 7 as is clear the optimal number of clusters is between 2, 3, and 4. We note that in Figure 8 the Silhouette score is maximized at k=3. We will take 3 clusters.
In this part, we apply hybrid K-Means clustering, the Elbow-Silhouette method, and statistical analysis based on COVID-19 three-dimensional data to determine the best clusters according to the “new confirmed - new deaths - new recovered” cases for 144 countries.
This technique provided for the clusters between k=1 to k=8 gives good results. Our aim is to select the best clustering and the related number of k-values. For this reason, we have followed the same procedure as Rizvi et al. [13] and Garg and Joshi [25] to determine the optimal value of k. Table 5 shows the results obtained by clustering 150 world countries into four clusters. After applying the K-Means algorithm, the convergence is reached after 141 iterations; the process existed after 8.71 seconds.
Finally, this method has disadvantages. The limitation of K-Means clustering for COVID-19 data, each data point is assigned uniquely to one and only one cluster and a point may be equidistant from two cluster centers. This technique also has its limitations, which are the high number of dimensions.
(a)
(b)
(c)
(d)
(e)
(f)
Figure 6. (a) Scatter plot between ‘new confirmed cases, new death cases and new confirmed cases’ of the 144 world
Countries; without clustering. (b), (c), (d), (e) and (f) K-Means partitions respectively with k=2; k=3; k=4; k=5 and k=6. The centroids are marked with a cross.
Figure 7. Elbow method for K-Means analysis on 144 world countries ‘Confirmed – Death – Recovered’ data
Figure 8. Result of Silhouette analysis on 144 world countries‘Confirmed – Death – Recovered’ data
Table 5. List of 150 countries according to the clusters
|
Clusters |
World countries |
|
C1 |
1.USA, 2.UK, 3.Russia, 4.Turkey, 5.France, 6.Germany |
|
C2 |
16. Poland, 21.Netherlands, 25.Czechia |
|
C3 |
7.India, 8.Brazil, 9.Iran, 13.Italy, 17.Ukraine, 23.Thailand, 30.Belgium, 35.Vietnam, 37.Austria, 38. Hungary, 52. Slovakia |
|
C4 |
10.Argentina, 11.Spain, 12.Colombia, 14.Indonesia, 15.Mexico, 18.South Africa, 19.Philippines , 20.Malaysia, 22.Peru, 24.Iraq, 26.Canada, 27.Romania, 28.Chile, 29.Japan, 31.Bangladesh, 32.Pakistan, 33.Serbia, 34.Sweden, 36.Portugal, 39.Switzerland, 40.Kazakhstan, 41.Cuba, 42.Morocco, 43.Jordan, 44.Greece, 45.Georgia, 46.Nepal, 47.UAE, 48.Tunisia, 49.Bulgaria, 50.Lebanon, 51.Belarus, 53.Guatemala, 54.Croatia, 55.Azerbaijan, 56.Costa Rica, 57.Sri Lanka, 58.Saudi Arabia, 59.Ireland, 60.Bolivia, 61.Myanmar, 62.Panama, 63.Paraguay, 64.Denmark, 65.Lithuania, 66.Palestine, 67.Venezuela, 68.S. Korea, 69.Kuwait, 70.Slovenia, 71.Dominican Republic, 72.Uruguay, 73.Mongolia, 74.Honduras, 75.Ethiopia, 76.Libya, 77.Moldova, 78.Egypt, 79.Armenia, 80.Oman, 81.Bahrain, 82.Bosnia and Herzegovina, 83.Singapore, 84.Kenya, 85.Norway, 86.Latvia, 87.Qatar, 88.Estonia, 89.Nigeria, 90.North Macedonia, 91.Zambia, 92.Algeria, 93.Australia, 94.Albania, 95.Uzbekistan, 96.Kyrgyzstan, 97.Finland, 98.Afghanistan, 99.Montenegro, 100.Mozambique, 101.Zimbabwe, 102.Namibia, 103.Uganda, 104.Cambodia, 105.Cameroon, 106.Rwanda, 107.China, 108.Maldives, 109.Jamaica, 110.Luxembourg, 111.Senegal,112.Trinidad and Tobago, 113.Laos, 114.Angola, 115.Malawi, 116.DRCongo, 117.Fiji, 118.Suriname, 119.Syria, 120.Eswatini, 121.Sudan, 122.Malta, 123.Mauritania, 124.Cabo Verde, 125.Gabon, 126.Guinea, 127.Belize, 128.Togo, 129.Haiti, 130.Benin, 131.Barbados, 132.Seychelles, 133.Bahamas, 134.Andorra, 135.Brunei, 136.Saint Lucia, 137.South Sudan, 138.Hong Kong, 139.New Zealand, 140.Yemen, 141.Eritrea, 142.Gibraltar, 143.Niger, 144.Guinea-Bissau, 145.Cayman Islands, 146.St. Vincent Grenadines, 147.Sint Maarten, 148.Comoros, 149.Liechtenstein, 150.Monaco |
In this paper, we have successfully presented a suitable clustering method. The best result for Moroccan Prefecture and Provinces based on COVID-19 is three clusters (high, medium, and low) using two- dimensional confirmed cases and death cases. Based on the results of this study, there are four clusters (very high, high, medium, and low) of World Countries using three-dimensional ‘Confirmed – Death -Recovered’ data. The medical, socio-economic status, and health system coverage are impacted of COVID-19. These results can assist the Prefecture-Province and World Countries clusters to better health care quality a country to tackle the pandemic, which can reduce confirmed cases, death cases and can increase recovered cases, as well the government, policy and health authorities makers can make better decisions locally or globally related to restrictions on all community activities or other policies in overcoming the spread of COVID-19. In our future work, we suggest Expectation Maximisation clustering for multidimensional COVID-19 data from various sources based, on environmental-related metrics, socio-economic and health system indicators.
[1] Lu, R., Zhao, X., Li, J., Niu, P., Yang, B., Wu, H., Tan, W. (2020). Genomic characterisation and epidemiology of 2019 novel coronavirus: Implications for virus origins and receptor binding. The Lancet, 395(10224): 565-574. https://doi.org/10.1016/S0140-6736(20)30251-8
[2] Lakshmanarao, A., Babu, M.R., Kiran, T. (2021). An efficient COVID-19 epidemic analysis and prediction model using machine learning algorithms. International Journal of Online & Biomedical Engineering, 17(11): 25209. https://doi.org/10.3991/ijoe.v17i11.25209
[3] World Health Organization. (2021). COVID-19 Weekly Epidemiological Update Edition 68, Published on 30 November, 2021.
[4] Zealouk, O., Satori, H., Hamidi, M., Laaidi, N., Salek, A., Satori, K. (2021). Analysis of COVID-19 resulting cough using formants and automatic speech recognition system. Journal of Voice. https://doi.org/10.1016/j.jvoice.2021.05.015
[5] Hamidi, M., Zealouk, O., Satori, H., Laaidi, N., Salek, A. (2023). COVID-19 assessment using HMM cough recognition system. International Journal of Information Technology, 15(1): 193-201. https://doi.org/10.1007/s41870-022-01120-7
[6] Boutazart, Y., Satori, H., Satori, H., Affane M., A.R., Hamidi, M., Satori, K. (2023). COVID-19 dataset clustering based on K-means and EM algorithms. International Journal of Advanced Computer Science and Applications, 14(3).
[7] Hamad, S., Ali Alheeti, K.M., Ali, Y.H., Shaker, S.H. (2020). Clustering and analysis of dynamic Ad Hoc network nodes movement based on FCM algorithm. International Journal of Online & Biomedical Engineering, 16(12): 16067. https://doi.org/10.3991/ijoe.v16i12.16067
[8] Wu, J., Feng, X., Zhang, H.D., Lv, W. (2017). Design and analysis of clustering routing protocol in wireless sensor network of frozen food. International Journal of Online Engineering, 13(12): 7893. https://doi.org/10.3991/ijoe.v13i12.7893
[9] Abdullah, D., Susilo, S., Ahmar, A.S., Rusli, R., Hidayat, R. (2022). The application of K-means clustering for province clustering in Indonesia of the risk of the COVID-19 pandemic based on COVID-19 data. Quality & Quantity, 56(3): 1283-1291. https://doi.org/10.1007/s11135-021-01176-w
[10] Aydin, N., Yurdakul, G. (2020). Assessing countries’ performances against COVID-19 via WSIDEA and machine learning algorithms. Applied Soft Computing, 97: 106792. https://doi.org/10.1016/j.asoc.2020.106792
[11] Zarikas, V., Poulopoulos, S.G., Gareiou, Z., Zervas, E. (2020). Clustering analysis of countries using the COVID-19 cases dataset. Data in Brief, 31: 105787. https://doi.org/10.1016/j.dib.2020.105787
[12] Gohari, K., Kazemnejad, A., Sheidaei, A., Hajari, S. (2022). Clustering of countries according to the COVID-19 incidence and mortality rates. BMC Public Health, 22(1): 1-12. https://doi.org/10.1186/s12889-022-13086-z
[13] Rizvi, S.A., Umair, M., Cheema, M.A. (2021). Clustering of countries for COVID-19 cases based on disease prevalence, health systems and environmental indicators. Chaos, Solitons & Fractals, 151: 111240. https://doi.org/10.1101/2021.02.15.21251762
[14] Carrillo-Larco, R.M., Castillo-Cara, M. (2020). Using country-level variables to classify countries according to the number of confirmed COVID-19 cases: An unsupervised machine learning approach. Wellcome Open Research, 5. https://doi.org/10.12688/wellcomeopenres.15819.1
[15] Kurniawan, R., Abdullah, S.N.H.S., Lestari, F., Nazri, M.Z.A., Mujahidin, A., Adnan, N. (2020). Clustering and correlation methods for predicting coronavirus COVID-19 risk analysis in pandemic countries. In 2020 8th International Conference on Cyber and IT Service Management (CITSM), pp. 1-5. https://doi.org/10.1109/CITSM50537.2020.9268920
[16] Syakur, M.A., Khotimah, B.K., Rochman, E.M.S., Satoto, B.D. (2018). Integration k-means clustering method and elbow method for identification of the best customer profile cluster. In IOP Conference Series: Materials Science and Engineering, 336(1): 012017. https://doi.org/10.1088/1757-899X/336/1/012017
[17] Zubair, M., Iqbal, A., Shil, A., Haque, E., Moshiul Hoque, M., Sarker, I.H. (2021). An efficient k-means clustering algorithm for analysing COVID-19. In International Conference on Hybrid Intelligent Systems, pp. 422-432. https://doi.org/10.1007/978-3-030-73050-5_43
[18] Bishop, C.M., Nasrabadi, N.M. (2006). Pattern recognition and machine learning, 4(4): 738. New York: Springer.
[19] Press, W.H., Teukolsky, S.A., Vetterling, W.T., Flannery, B.P. (2007). Numerical recipes 3rd edition: The art of scientific computing. Cambridge University Press.
[20] Hassan, B.A., Rashid, T.A., Hamarashid, H.K. (2021). A novel cluster detection of COVID-19 patients and medical disease conditions using improved evolutionary clustering algorithm star. Computers in Biology and Medicine, 138: 104866. https://doi.org/10.48550/arXiv.2109.09492
[21] Rousseeuw, P.J. (1987). Silhouettes: A graphical aid to the interpretation and validation of cluster analysis. Journal of Computational and Applied Mathematics, 20: 53-65. https://doi.org/10.1016/0377-0427(87)90125-7
[22] Batool, F., Hennig, C. (2021). Clustering with the average silhouette width. Computational Statistics & Data Analysis, 158: 107190. https://doi.org/10.1016/j.csda.2021.107190
[23] Hutagalung, J., Ginantra, N.L.W.S.R., Bhawika, G.W., Parwita, W.G.S., Wanto, A., Panjaitan, P.D. (2021). COVID-19 cases and deaths in southeast Asia clustering using k-means algorithm. In Journal of Physics: Conference Series, 1783(1): 012027. https://doi.org/10.1088/1742-6596/1783/1/012027
[24] Abdullah, D., Susilo, S., Ahmar, A.S., Rusli, R., Hidayat, R. (2022). The application of K-means clustering for province clustering in Indonesia of the risk of the COVID-19 pandemic based on COVID-19 data. Quality & Quantity, 56(3): 1283-1291. https://doi.org/10.1007/s11135-021-01176-w
[25] Garg, P., Joshi, D. (2021). A region-specific clustering approach to investigate risk-factors in mortality rate during COVID-19: Comprehensive statistical analysis from 208 countries. Journal of Medical Engineering & Technology, 45(4): 284-289. https://doi.org/10.1080/03091902.2021.1893398