Noor Fadel* | Emad I. Abdul Kareem
© 2022 IIETA. This article is published by IIETA and is licensed under the CC BY 4.0 license (http://creativecommons.org/licenses/by/4.0/).
OPEN ACCESS
The hand gesture recognition concept has recently been recognized as an essential part of the human-computer interaction (HCI) concept. Detecting and interpreting hand gestures is a very important topic. This is due to the intense desire to make communication between humans and the calculator or other device natural, away from wires, mouse, keyboards, and others. This recognition makes it possible for computers to capture and understand hand motions. Hand gestures are an important kind of nonverbal communication for a variety of reasons, including their usage in a variety of medical applications, communication between people who are hearing impaired, and robot control. Given the importance of applications for hand gesture recognition and technological progress in today's world, the purpose of the research is to shed light on the most important stage in hand gesture recognition, which is the process of detection and identifying hand gestures in the general sense; segmenting the image to obtain hand gestures before entering them into the feature extraction stages and classification. Six commonly used image segmentation methods were tested on a set of American Sign Language images in a variety of lighting conditions. When compared to the clustering and Otsu methods, the best segmenting results in terms of accuracy were obtained using the Canny and HSV color spaces.
image segmentation, HSV color space, human-computer interaction, American sign language, hand gesture detection, clustering, KNN, K mean clustering, canny filter, Otsu’S segmentation, thresholds segmentation, FCM
Humans and machines can interact in a natural way, according to the concept of human-computer interaction (HCI). Devices like mice, keyboards, and monitors are commonly used in traditional human-machine interaction (HMI). It's a given that these devices require a computer to function. The process of linking various devices is insufficient in some circumstances, such as VR, RC, and AR (augmented reality). Consequently, it is imperative to conduct research on how to design an HCI environment that is in sync with human communication patterns [1].
In the field of assistive technology, gesture detection is critical. There are many advantages to using hand gestures instead of technologies such as the mouse and keyboard. Caregivers and elderly people who can't walk or talk can use hand signals to talk and communicate with others [2].
A user's cultural background, application domain, and surroundings all play a role in how hand gestures are used [3]. In the same way, expressive gestures are similarly important [4]. Natural user interfaces (NUIs) are one of the latest trends in computing (NUI). By eliminating the need for additional hardware, the computer system can be operated by the user in the same way as real things [3, 4].
Detecting and understanding hand gestures has become increasingly important in recent years due to the rise of a minority of deaf and hard-of-hearing people around the world, as well as the proliferation of vision and touchless control apps on devices like video games, smart TVs, and virtual reality [4]. With hand gestures, HCI apps are able to handle complex and virtual settings in a much easier manner than the traditional approaches in a substantial number of HCI applications [5]. When it comes to hand gesture applications, the ability to appropriately apply and understand a variety of gestures [6] is critical.
Image segmentation can be used to pinpoint a specific area of interest within an image (ROI). Using this method, an image can be divided into its constituent elements. An image object is a segment of the image that may be broken down into individual pieces. The similarity, discontinuity, and other aspects of an image are taken into account. The goal of image segmentation is to make it easier to analyze the image. Every pixel in an image has its own unique ID. Image segmentation is used in a variety of fields, including machine learning, computer vision, artificial intelligence, medical imaging and recognition, and object detection. It has ramifications in numerous fields [7]. Techniques for segmenting images, including Otsu-based segmentation, color space-based segmentation, and clustering-based segmentation, are covered in this article.
1.1 Hand gesture methods
The basic objective of gesture detection and recognition is to be able to identify specific human gestures and put such gestures to work either for the purpose of data transfer or for command and control [8].
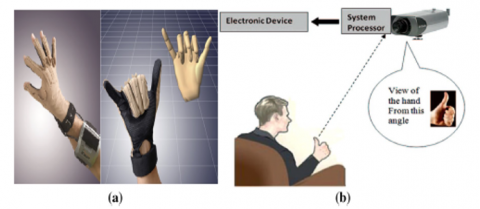
The acquisition of hand gestures has always been divided into two distinct ideas, sensor vision–based and computer vision–based (see Figure 1). In the second method [9], there is no need for expensive gadgets or wires, but strong procedures or techniques are required to detect and interpret hand gestures with great precision in the second method [9]. For this reason, the study of hand gesture detection is a very essential area of research to focus on because it is the initial component of the larger process of recognition or classification. The successful completion of the segmentation procedure is what ensures that the classification algorithms receive the proper data they require.
Figure 1. Hand gestures: (a) Glove-based sensor; (b) Computer vision–based camera [9]
The aim of this paper is to detect hand gestures as well as apply many different segmentation algorithms. The main research question is: "What is the best technique for detecting hand gestures?" To answer this question, we have applied several machine learning algorithms and discussed each technique's appropriate and unsuitable conditions or environments for the efficient result of these algorithms.
2.1 Related works
Hernández [10] examined three methods for segmenting dynamic hand gestures. The research suggested both segmentation methods related to skin and movement in addition to contour features. The color space has been changed to HSV. Morphology operations were also applied after the contour process to obtain the hand area only and to increase the accuracy of segmentation.
A new technique that describes the number of hand gestures ranging from 0 to 5 that people indicate that a computer understands has been proposed by Aljawaryy and Malallah [11]. This technique is implemented by reading a frame as an image and then extracting it only manually using the YCbCr color space filter. Then it is converted to a black and white image. The experiment was conducted using 180 random hand gesture frames taken from random people.
This research provides a robust hand motion segmentation method using adaptive background removal and a HSV-color threshold. The recommended approach tries to automatically extract hand motions from video under different lighting conditions and difficult backgrounds. Experiments show that the proposed strategy is more accurate than previous methods. Programming uses Python and OpenCV [12].
The method suggested in [13] uses a portable webcam to extract a histogram of gradient characteristics. The K-Nearest Neighbor algorithm compares and recognizes the images. The slide display is then controlled by the recognition of the image.
Tan et al. [14] studies sign language image segmentation under noise, hand size, and hand-background intensity difference. Sign language image segmentation uses Otsu image thresholding. Hand size, backdrop intensity differential, and noise measurement affect sign language segmentation. The results of the search showed the possibility of the perfect segmentation of some letters with the difficulty of dividing another group of letters such as C, D, F, G, H, K, L, P, and R.
2.2 Data set of American sign language alphabet
The dataset of pictures of alphabets from American sign language is separated into 29 volumes, representing the different categories. 87,000 images with a size of 200x200 pixels. training data set. 26 volumes are for letters A-Z, and 3 chapters are for SPACE, DELETE, and NOTHING. These last three categories are very useful in applications and real-time classification. Only 29 images are available. The test data is on 29 pictures only. Show Figure 2. This dataset can be obtained by visiting this link: https://www.kaggle.com/datasets/grassknoted/asl-alphabet.
The topic of detection and recognition of hand gestures is broad and important, and a lot of research has been done in recent years on the importance of using hand gestures in many vital applications. This study deals with some of the most famous image segmentation algorithms in image processing and the application of these algorithms to the American sign language dataset. In the next section, we review the algorithms applied to the same set of images, show the results for each algorithm, and compare the results. The research methodology is illustrated in Figure 2.
Figure 2. Research methodology
3.1 Hand segmentation
Hand segmentation and detection is the foundation of a gesture recognition system, which has a large influence on the performance of the overall gesture recognition algorithm [12]. The main purpose of hand detection is to localize the human hand in a given image, and hand segmentation aims to separate the human hand from the background. Segmentation is a common image processing technique. The best method for segmenting hands depends on image quality, dataset, and static or dynamic hand movements. Image segmentation identifies a region of interest (ROI). It divides an image into sections. Image objects are image fragments. Similarity, discontinuity, etc. are considered. Segmenting images simplifies the image for better analysis.
3.1.1 K-mean clustering for hand detecting
It is common to use K-means clustering to sort a dataset if the labels are obscure. In this case, the purpose is to identify specific groups based on the number of groups represented by K [15], note that this value varies depending on the image and the application of the image. The pixel values of an image can be utilized to segment distinct parts of the image. Images can be segmented by K-mean as follows:
1. In K-means clustering, the first step is to determine the number of points that make up the cluster. In this research, we used k=2.
2. Each pixel should have a feature vector (color values such as RGB value, texture, etc.). This research depends on the color pixel value to compare between pixels and the distribution of pixels close to each other within one cluster.
3. Used a similarity measure called Euclidean distance to compare feature vectors and determine how similar the points we identified in the first step are to the pixels of the whole image.
4. Apply the K-means algorithm to the centers of the cluster. Allocate each point to the nearest cluster center and verify that each cluster center has one point. The mean of the points allocated to the cluster center.
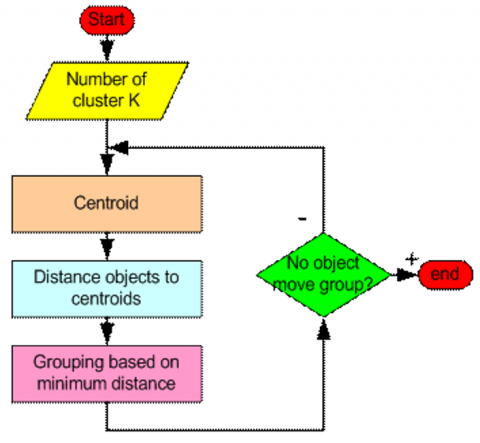
5. linked component, it means after collecting the similar points closest to the value of the centroid, we will see the clusters. The block diagram of the K-Means algorithm is shown in Figure 3.
Figure 3. Block diagram of K-means algorithm [16]
3.1.2 FCM clustering for hand detection
FCM clustering is an unsupervised method dependent on fuzzy logic that is used in many applications. Fuzzy logic has proven its efficiency in several areas, including parking systems [17] and nondestructive testing image processing [18]. The FCM formula clusters related image points. Randomly and iteratively assigning cluster coefficients to each pixel achieves this. The general steps of the FCM cluster algorithm are:
(1) When there are many clusters, random selection is used to determine their points. Here we used 2 clusters for hand gesture image segmentation.
(2) Clusters for hand gesture image segmentation.
$v_k=\frac{\sum_{i=1}^n U_{i k}^m p i}{\sum_{i=1}^n U_{i k}^m}$ (1)
(3) Calculations are done on the pixels that are close to the clusters using the Euclidean equation.
$p_i-v_{\mathrm{k}} \mathrm{I}=\sqrt{\sum_{i=1}^n\left(p_i-v_k\right)^2}$ (2)
(4) Until convergence, the extent that which each pixel belongs to the kth cluster is calculated:
$\mu_{i k}=\frac{1}{\sum_i^c\left(\frac{\left|p_i-v_k\right|}{\left|p_i-v_l\right|}\right)^{\frac{2}{m-1}}}$ (3)
(5) After computing each pixel's class membership, it is inserted into the closest cluster based on the membership Eq. (3). The FCM clustering is obtained by minimizing an objective function shown in Eq. (4):
$\mathrm{X}=\sum_{i=1}^n \sum_{k=1}^c \mu_{i k}^m\left|p_i-v_k\right|^2$ (4)
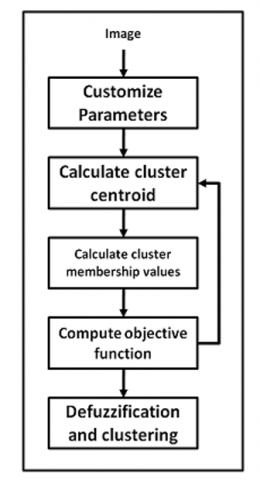
where, X=objective function; n=number of pixels; c=number of clusters; µ=fuzzy membership value; m = fuzziness factor (value>1); pi=the ith pixel in E; and Vk=centroid of the kth cluster. Figure 4 clarifies FCM algorithm steps.
Figure 4. Steps of FCM Algorithm [18]
This algorithm differs from the previous one by allowing one pixel to belong to more than one cluster, so we use the membership function (The Eq. (3)) to determine the extent of belonging to all existing clusters, unlike the K-means, which allows the pixel to belong to only one cluster, FCM clustering is more natural than K means clustering. Objects on the boundaries between several classes are not compelled to fully belong to one of the classes, but degrees (between 0 and 1) are assigned indicating their partial membership.
Much research used the hybrid method between fuzzy logic and k-means clustering [19].
3.1.3 K-nearest neighbors algorithm for hand detecting
KNN is a simple, easy-to-understand, adaptable machine learning method. KNN is utilized in image processing, medical, handwriting, image, and video recognition applications. KNN classifies and predicts. The feature-similarity-based KNN algorithm [20].
Take note of the fact that most of the time, similar data points are clustered together (neighbors). The KNN method relies on this assumption to be accurate enough to be useful. The concept of similarity is captured by KNN (sometimes called distance, proximity, cosine similarity, or closeness). The Euclidean distance is a popular and familiar choice [21].
There are K nearest neighbors in KNN. In the end, the number of neighbors is the most important element to take into account. If the number of classes is two, the number K is almost always an odd number [22].
No optimal neighbor number fits all data sets. Each dataset's needs vary. Small numbers of neighbors make noise more influential, and big numbers make it computationally expensive. A small number of neighbors is the most flexible fit, with low bias but high variation, and a large number of neighbors has a smoother decision. boundary, with a lower variance but higher bias. Data scientists choose an odd number generally. Figure 5 illustrates the general KNN algorithm steps in greater detail.
1. The image is loaded.
2. K is initialized to the number of neighbours you choose, we used k=3.
3. For each pixel in the image.
3.1 Determine the distance between the query pixel and the image's current pixel.
3.2 Add the distance and the index of the example to an ordered collection.
4. Ascending the distances and index in the collection should be used to sort the data.
5. Out of all of the sorted data, choose the first K-high similar.
6. Get the labels for the K entries you've chosen.
In this research, after testing the procedure with 3, 5, 7, and 9 neighbours, it was noted that the best results were number was 3. So choose the K that reduces the number of errors we encounter while maintaining the algorithm’s ability to accurately make predictions when it’s given data it hasn’t seen before.
Figure 5. Flowchart of the KNN Algorithm [22]
3.1.4 Otsu’s image segmentation for hand detecting
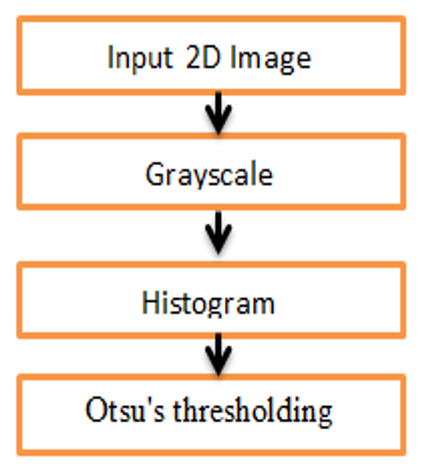
Threshold-based segmentation applies. In Otsu's segmentation, the input image is first processed and converted to a gray image because threshold Otsu works only on 2D images, then the histogram is obtained to display the pixel distribution. The peak value is emphasized. Next, compare the threshold value to the image pixels. If the pixel is above the threshold, set it to white. The thresholds in Otsu's are set automatically. This approach can't handle noisy images [23].
Within-class variance is calculated as a weighted sum of the variances for both classes and is searched for iteratively by the algorithm (background and foreground). Grayscale images often have color values ranging from 0 to 255. A threshold value of T means that all pixels with values less than or equal to T are in the background, while pixels with values greater than or equal to T are in the foreground [14].
Iteratively separating the pixels in the background and foreground between the image's minimum and maximum color values will be our objective. We'll keep track of how much variety there is inside a class with each iteration [24].
Figure 6 illustrates the general Otsu’ s algorithm steps.
Figure 6. Flowchart of Otsu’ s thresholding image [24]
Our threshold is the point at which there is the least amount of variation among classes. To put it simply, the technique aims to decrease the variation inside each class while simultaneously increasing the variation between classes. Total variance is equal to the sum of the variance within each class and the variance across classes. Ideally, finding the ideal global threshold value should be straightforward using Otsu's method. It is based on the maximization of interclass variance [23]. One of the most important considerations for using the Otsu method is, typically, a threshold value is used for binary segmentation. Each pixel that is brighter than the threshold is separated from the rest of the image and given the value 255 if the image is grayscale, whereas each pixel that is darker than the threshold is separated from the rest of the image and given the value 0. Then, all the pixels that are either 255 or 0 will be the focus of attention.
3.1.5 HSV color spaces for hand detection
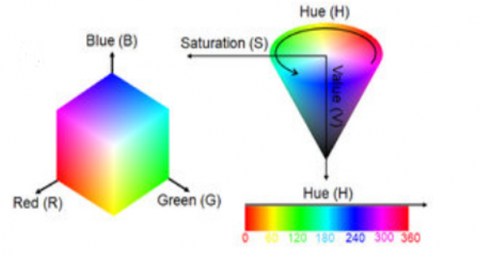
HUE consists of the primary colors of red, blue, and yellow and their complementary secondary colors of orange (green) and violet (violet) on a color wheel or circle (see Figure 7). What you're referring to when you use the term "HUE" is the pure color or the rainbow's visible range of primary colors [10].
Color saturation refers to the degree to which a color's purity and intensity may be readily observed in an image. The more saturated a color is, the more brilliant and powerful it appears. The Chroma, or intensity, of the color is inversely related to its saturation. Look up a color's value to see how light or dark it is. We see a color's value when light bounces off a surface and is absorbed by our eyes. Human eyes perceive light intensity as a function of brightness [25].
Images that are oversaturated have an exaggerated quality. Even if they look false, high-saturation photographs can be startling when used correctly. Desaturating a photo in a specific way might draw attention to certain details. Choosing to oversaturate a few areas of your image while keeping the rest under saturated can help draw the viewer's attention [26].
Color combination, importance, and image pixel intensity were some of the aspects of HSV colors that we examined. The hand's hue, depth, and purity are all determined by HSV, as is the light in the image. Hue is an angle that expresses color over a range of red axis and assesses color saturation radially. Gray values can reflect low saturation, while hue is a good approximation for high saturation [25]. A technique known as threshold masking allows us to isolate the most conspicuous characteristics in a scene. High and low threshold masks can be defined when all three of the color, saturation, and value parameters are equal to 1.
Using the HSV Color Scale, which stands for Hue Saturation Value, you may get a numerical representation of the image's colors. From zero to 360 degrees, the hue can be expressed as a number. Cyan has a range of 181-240 degrees, while magenta is in the range of 301-360 degrees. Color value and saturation are rated on a scale of 0 to 100 percent. As opposed to the RGB color space, the HSV color space disentangles the luma (image intensity) and Chroma (color information) channels. Many situations might benefit greatly from this. Table 1 shows that when compared to other approaches employed in this study, the one based on the hand's chromatic intensity independent of lighting conditions produced the best results.
Figure 7. RGB vs. HSV color space [26]
Table 1. Image segmentation techniques using hand gestures
|
Image |
Entropy for the original image |
Entropy for K-Mean Segmented Image |
Entropy for FCM Segmented Image |
Entropy for KNN Segmented Image |
Entropy for Outs Segmented Image |
Entropy for the HSV Color Segmented Image |
Entropy for a Canny Segmented Image |
|
A |
7.055 |
1.509 |
2.023 |
1.404 |
1.313 |
0.922 |
0.699 |
|
B |
7.002 |
1. 143 |
1.940 |
1.414 |
1.365 |
0.980 |
0.753 |
|
C |
7.111 |
1. 323 |
2.147 |
1.433 |
1.507 |
0.951 |
0.874 |
|
D |
7.120 |
1.218 |
2. 426 |
1.368 |
1.445 |
0.935 |
0.811 |
|
E |
7.006 |
1.783 |
2.066 |
1.284 |
1.352 |
0.975 |
0.763 |
|
F |
7.024 |
1.710 |
2.119 |
1.441 |
1.428 |
1.029 |
1.007 |
|
G |
7.149 |
1.192 |
1.059 |
1.222 |
1.224 |
0.865 |
0.722 |
|
H |
7.300 |
1.479 |
1.431 |
1.173 |
1.295 |
0.869 |
0.821 |
|
I |
7.468 |
1.715 |
2.431 |
1.271 |
1.497 |
0.906 |
0.693 |
|
J |
7.432 |
1.344 |
2.172 |
1.234 |
1.169 |
0.833 |
0.830 |
As a result of the widespread availability and simplicity of the necessary code, HSV is frequently employed.
The threshold values for the training image are determined over numerous trials. In terms of saturation:
S-low=60, S-high=255, V-low=0, V-high=255, H-low=0, H-high=350 in the absence of a threshold. General step of HSV color spaces for hand detection clarify in Figure 8.
3.1.6 Canny filter for hand detection
Many algorithms find image edges, like the Canny algorithm. The Canny algorithm was described in 1986 by U.C. Berkeley's John F. Canny. Canny describes three criteria to evaluate an edge detection algorithm [27]:
1. Good detection: Should have a low likelihood of missing true edge points and mistakenly labelling non-edge locations.
2. Good localization: The operator's edge points should be as close to the edge's center as possible.
3. Only one response per edge: Since two responses to the same edge must be false. This technique uses numerous steps, as seen in Figure 9.
General stage of the Canny hand detection algorithm:
·Gaussian blur is used in the first step. After converting the image to grayscale, A Gaussian blur is applied. A 5*5 mask is used. Each pixel is recalculated as the sum of the values of the 5*5 pixels around it, multiplied by the Gaussian weight, and then divided by the total weight of the mask.
·Determine the strength and direction of the edge gradient. Next, utilize Sobel masks to determine each pixel’s gradient strength and direction. First, Sobel masks are applied to the current pixel’s 3*3 x- and y-direction. The Gx and Gy values are the totals of each mask value and pixel. Edge strength equals Gx2 + Gy under the square root. The Inverse Gx/Gy tangent gives edge direction. Edge direction is preserved in edgeDir [r][c], and gradient strength is preserved in gradient [r] [c].
·Trace the edges. Trace edges based on the strength of the gradient and the directions of the edges. This pixel is set to white when the pixel gradient strength exceeds the upper bound, records the next possible pixel row and column, and checks the edge direction and gradient strength. If it has the same edge orientation and gradient strength as the lower-threshold, the pixel should also be set to white, otherwise the other pixels are black. The results shown in Figure 10 are set such that the lower-threshold is 150 and the upper-threshold is 250.
·Non-maximum edges should be suppressed. Last, delete parallel weak edges. Examining the pixels perpendicular to an edge pixel and removing non-maximum edges achieves this. Similar to edge-tracing code, this stage determines which edges are real. Both lower-threshold and upper-threshold are needed. Any edges with intensity gradients above the upper-threshold are edges, whereas those below the lower-threshold are non-edges. Connectivity classifies those between these two thresholds as edges or non-edges. They’re edges if they’re connected to “sure-edge” pixels. Otherwise, they’re tossed [28].
Figure 8. OpenCV To calculate HSV color space [29]
Figure 9. Flowchart for the canny edge detection [27]
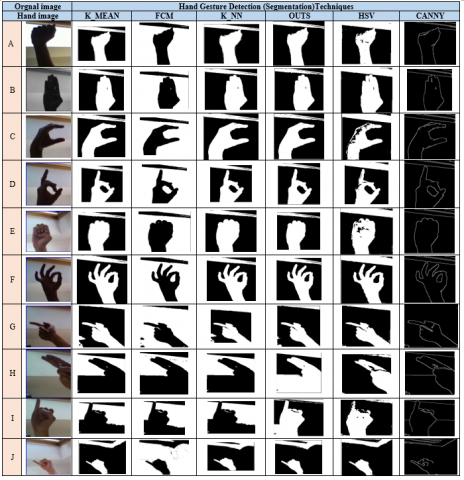
The results, which were applied to images of American Sign Language, are shown in Figure 10. We used a variety of machine learning segmentation approaches and image processing methods to detect hands in a series of images with varying illumination conditions in order to find the best results.
Figure 10 shows that clustering works well when the hand's color gradient is far from the gradient of the background, as shown by the clustering results for the letters A, B, C, D, E, F, G, and J. However, when the hand's color gradient is closer to the gradient of the background, the separation process becomes more difficult. It is difficult to distinguish between the hand and the background, as in the letters H and I.
This was also the case with Otsu's approach, which gave somewhat better results but which produced erroneous results for the letters H and I due to its reliance on threshold limit based on the normal distribution of picture pixel values and the high degree of convergence between background values with the hand.
While both Canny and HSV color space gave very good results and good separation between the hand and the background, due to the first dependence on the two thresholds, and the HSV color space method, we relied on the amount of saturation of the hand from the light, so the separation process is facilitated as shown in Figure 10 and at different lighting levels.
The Canny method treats edges whose values are between the high and low threshold limits by looking at the continuity of the edge; if it is continuous, it is considered an edge, and if it is dotted, it will be neglected because of its dependence on two threshold limits that make the high threshold limit separate the high levels and the second threshold separate the low levels.
The HSV color space gave very good results and a good separation between the hand and the background. The threshold values for the training image are determined over numerous trials. The threshold values for the training image are determined over numerous trials. In terms of saturation:
S-low=60, S-high=255, V-low=0, V-high=255. H-low=0, H-high=350. For improved accuracy when use HSV color space, it needs simple treatment to give better accuracy. Morphological operations can be used to get rid of small volumes as well as to fill the hole.
The results presented in Figure 10 are clear to the eye (Subjective validation) several images used in different illuminations are shown to see the effect of separating the hand from the background in an uncontrolled environment. Taking into account that the algorithms used in this research treat each pixel with its chromatic value, so we see that different lighting has a negative impact on cluster formation. Color values close to some of the pixels of the hand with the pixels of the background have been included within one cluster and this is what we see in both the letters H and I.
Entropy is one of the most commonly utilized measurements, which evaluates the amount of purity between the object's body and the background [18]. The storage of image information can be expected to be the amount of information involved, whereas Shannon’s entropy metric quantifies the absolute minimum amount of storage needed for image segmentation as opposed to raw image [30]. Table 1 shows the Canny and HSV color segmented images have the best results compared to other techniques used in this research.
Figure 10. The result of hand detection techniques
Hand gesture applications have become increasingly popular in recent years and have found their way into a variety of critical and significant applications. However, the trend is shifting away from relying on sensors and wires to send and understand hand gestures and toward developing computer vision techniques that are easier and do not necessitate sensors or any wires, making it easier for people to communicate with computers. Detection and separation of hand gestures from the background is a critical step in the recognition and interpretation of gestures. To this end, a variety of image segmentation methods were tested on a set of ASL images in a variety of lighting conditions. When compared to the clustering method and Otsu, the best results in terms of accuracy were obtained using the Canny and HSV color spaces.
[1] Pisharady, P.K., Saerbeck, M. (2015). Recent methods and databases in vision-based hand gesture recognition: A review. Computer Vision and Image Understanding, 141: 152-165. https://doi.org/10.1016/j.cviu.2015.08.004
[2] Yasen, M., Jusoh, S. (2019). A systematic review on hand gesture recognition techniques, challenges and applications. PeerJ Computer Science, 5: e218. https://doi.org/10.7717/peerj-cs.218
[3] Camgoz, N.C., Koller, O., Hadfield, S., Bowden, R. (2020). Sign language transformers: Joint end-to-end sign language recognition and translation. In Proceedings of the IEEE/CVF conference on computer vision and pattern recognition, pp. 10023-10033. http://dx.doi.org/10.1109/CVPR42600.2020.01004
[4] Tian, L., Wang, H., Zhou, Y., Peng, C. (2018). Video big data in smart city: Background construction and optimization for surveillance video processing. Future Generation Computer Systems, 86: 1371-1382. https://doi.org/10.1016/j.future.2017.12.065
[5] Mei, T., Zhang, C. (2017). Deep learning for intelligent video analysis. In Proceedings of the 25th ACM international conference on Multimedia, pp. 1955-1956. http://dx.doi.org/10.1145/3123266.3130141
[6] Sarma, D., Bhuyan, M.K. (2021). Methods, databases and recent advancement of vision-based hand gesture recognition for hci systems: A review. SN Computer Science, 2(6): 1-40. http://dx.doi.org/10.1007/s42979-021-00827-x
[7] Chalasani, T., Smolic, A. (2019). Simultaneous segmentation and recognition: Towards more accurate ego gesture recognition. In Proceedings of the IEEE/CVF International Conference on Computer Vision Workshops. http://dx.doi.org/10.1109/ICCVW.2019.00537
[8] Noroozi, F., Corneanu, C.A., Kamińska, D., Sapiński, T., Escalera, S., Anbarjafari, G. (2018). Survey on emotional body gesture recognition. IEEE Transactions on Affective Computing, 12(2): 505-523. https://doi.org/10.1109/TAFFC.2018.2874986
[9] Premaratne, P., Nguyen, Q., Premaratne, M. (2010). Human computer interaction using hand gestures. In International conference on intelligent computing, pp. 381-386. http://dx.doi.org/10.1007/978-981-4585-69-9
[10] Hernández, I. (2018). Automatic Irish sign language recognition. University of Dublin, Trinity College.
[11] Aljawaryy, A., Malallah, L. (2017). Real-time numerical 0-5 counting based on hand-finger gestures recognition. Journal of Theoretical and Applied Information Technology, 95(13).
[12] Aithal, C.N., Ishwarya, P., Sneha, S., Yashvardhan, C.N., Kumar, D., Suresh, K.V. (2021). Dynamic hand segmentation. In: 2021 IEEE 8th Uttar Pradesh Section International Conference on Electrical, Electronics and Computer Engineering (UPCON), pp. 1-6. http://dx.doi.org/10.1109/UPCON52273.2021.9667634
[13] Salunke, T.P., Bharkad, S.D. (2017). Power point control using hand gesture recognition based on hog feature extraction and K-NN classification. In 2017 International Conference on Computing Methodologies and Communication (ICCMC), pp. 1151-1155. http://dx.doi.org/10.1109/ICCMC.2017.8282654
[14] Tan, Z.Y., Basah, S.N., Yazid, H., Safar, M.J.A. (2021). Performance analysis of Otsu thresholding for sign language segmentation. Multimedia Tools and Applications, 80(14): 21499-21520. http://dx.doi.org/10.1007/s11042-021-10688-4
[15] Hossain, M.Z., Akhtar, M.N., Ahmad, R.B., Rahman, M. (2019). A dynamic K-means clustering for data mining. Indonesian Journal of Electrical Engineering and Computer Science, 13(2): 521-526. http://dx.doi.org/10.11591/ijeecs.v13.i2.pp521-526
[16] Bustamam, A., Tasman, H., Yuniarti, N., Frisca, Mursidah, I. (2017). Application of K-means clustering algorithm in grouping the DNA sequences of hepatitis B virus (HBV). In AIP Conference Proceedings, 1862(1): 030134. https://doi.org/10.1063/1.4991238
[17] Tuncer, T., Yar, O. (2019). Fuzzy logic-based smart parking system. Ingénierie des Systèmes d’Information, 24(5): 455-461. https://doi.org/10.18280/isi.240501
[18] Al-Hameed, W., Fadel, N. (2019). Fuzzy logic for defect detection of radiography images. Journal of Computational and Theoretical Nanoscience, 16(3): 1023-1028. http://dx.doi.org/10.1063/1.4991238
[19] Deb, K., Banerjee, S., Chatterjee, R.P., Das, A., Bag, R. (2019). Educational website ranking using fuzzy logic and k-means clustering based hybrid method. Ingénierie des Systèmes d’Information, 24(5): 497-506. https://doi.org/10.18280/isi.240506
[20] Htay, T.T., Maung, S.S. (2018). Early stage breast cancer detection system using glcm feature extraction and k-nearest neighbor (k-NN) on mammography image. In 2018 18th International Symposium on Communications and Information Technologies (ISCIT), pp. 171-175. http://dx.doi.org/10.1109/ISCIT.2018.8587920
[21] Liu, Y., Wang, X., Yan, K. (2018). Hand gesture recognition based on concentric circular scan lines and weighted K-nearest neighbor algorithm. Multimedia Tools and Applications, 77(1): 209-223. https://doi.org/10.1007/s11042-016-4265-6
[22] Justin, D., Concepcion, R.S., Bandala, A.A., Dadios, E.P. (2019). Performance comparison of classification algorithms for diagnosing chronic kidney disease. In 2019 IEEE 11th International Conference on Humanoid, Nanotechnology, Information Technology, Communication and Control, Environment, and Management (HNICEM), pp. 1-7. http://dx.doi.org/10.1109/HNICEM48295.2019.9073568
[23] Yang, P., Song, W., Zhao, X., Zheng, R., Qingge, L. (2020). An improved Otsu threshold segmentation algorithm. International Journal of Computational Science and Engineering, 22(1): 146-153. http://dx.doi.org/10.1504/IJCSE.2020.107266
[24] Bangare, S.L., Dubal, A., Bangare, P.S., & Patil, S.T. (2015). Reviewing Otsu’s method for image thresholding. International Journal of Applied Engineering Research, 10(9): 21777-21783. http://dx.doi.org/10.37622/IJAER/10.9.2015.21777-21783
[25] Prabhu Chakkaravarthy, A., Chandrasekar, A. (2019). An automatic threshold segmentation and mining optimum credential features by using HSV model. 3D Research, 10(2): 1-17. http://dx.doi.org/10.1007/s13319-019-0229-8
[26] Min, K.P., Kim, J., Song, K.D., Kim, G.W. (2019). A G-fresnel optical device and image processing based miniature spectrometer for mechanoluminescence sensor applications. Sensors, 19(16): 3528. https://doi.org/10.3390/s19163528
[27] Sekehravani, E.A., Babulak, E., Masoodi, M. (2020). Implementing canny edge detection algorithm for noisy image. Bulletin of Electrical Engineering and Informatics, 9(4): 1404-1410. http://dx.doi.org/10.11591/eei.v9i4.1837
[28] Mao, J., Hu, Y. (2019). Obstacle contour extraction method based on improved Grabcut algorithm. In Journal of Physics: Conference Series, 1303(1): 012051. http://dx.doi:10.1088/1742-6596/1303/1/012051
[29] Syah, R.A.S., Hakiki, R. (2021). The utilization OpenCV to measure the water pollutants concentration. Journal of Environmental Engineering and Waste Management, 6(2): 90-110. http://dx.doi.org/10.33021/jenv.v6i2.1475
[30] Mousavirad, S.J., Zabihzadeh, D., Oliva, D., Perez-Cisneros, M., Schaefer, G. (2021). A grouping differential evolution algorithm boosted by attraction and repulsion strategies for masi entropy-based multi-level image segmentation. Entropy, 24(1): 8. http://dx.doi.org/10.3390/e24010008