Boualem Si Ahmed* | Samir Benbouzid | Fatima Nibouche
© 2022 IIETA. This article is published by IIETA and is licensed under the CC BY 4.0 license (http://creativecommons.org/licenses/by/4.0/).
OPEN ACCESS
This work aims to describe the design and implementation of smart glasses to be used by industrial operators allowing the display environment related information such as temperature, humidity as well as machine maintenance operations, the associated risks, and Information Security Management System (ISMS) controls. In order to achieve this design, several analyses were conducted in order to determine the optimal design possible namely an external and an internal functional and a risk analysis, in addition to an ergonomic study. Based on the aforementioned study and analyses, a model was created and simulated using the commercial software SoildWorks and ISISPORTEUS. The smart glasses functionalities have been evaluated in a real industrial environment.
smart glasses, information security system (ISMS), maintenance, risk analysis, functional analysis, design
The continued and rapid technological advances in the last decades gave birth to the Industry 4.0 concept that focuses on interconnectivity, smart automation, intelligent networking, and real-time data. As maintenance is essential for the appropriate functioning of any enterprise, industrial maintenance and standards have been also evolved under this revolution. It is based on the monitoring of machinery and equipment by using advanced software and tools, such as wired or wireless sensors and thermal cameras, that allows the collection and the automatic analysis of large amount of temperature, acoustic, or vibration data...etc. [1, 2].
Industrial maintenance evolves with the technological advances and the emergence of industry 4.0 in addition augmented reality that requires advanced and expensive equipment. The difficulty to have access to these resources lead to the development of a solution which consists of a low cost “smart glass”.
The use of smart glasses for industrial maintenance is encouraged by the possibility to combine between available technologies, i.e., mobile, portable, hands-free device.
In this context several studies were conducted in this perspective, namely Agarwal et al. [1] realized low cost ultrasonic smart glasses, the device includes a pair of glasses and an obstacle detection module fitted in it in the center, a processing unit, an output device i.e. a beeping component, and a power supply. Sandnes [2] worked on the recognizing faces and text as the most important functions while the idea of smart glasses where questioned. Quint and Loch [3] in their article, Using Smart Glasses to Document Maintenance Processes, worked to makes them suitable devices for documenting maintenance procedures in industrial environments. Pierdicca et al. [4] worked on augmented reality smart glasses in the workplace: safety and security in the fourth industrial revolution era, it is particularly interested in the develop an AR application that allows to assist the operator during the working process. In particular, it acts as a guide system for the operator who wears glasses, provides remote support (remote operator) and, from a security point of view, sends real-time alerts in dangerous situations.
Nevertheless, and despite the important number of studies, none is directly interested in information security or integrating tools in Bluetooth by minimizing the risk of use, to the authors best knowledge.
In this context, the present work is carried out to develop smart glasses. It describes the design and implementation of smart glasses to be used by industrial operators allowing the display environment related information such as temperature, humidity as well as machine maintenance operations, the associated risks, and Information Security Management System (ISMS) controls. This device should display to the maintenance operator the tasks to be performed, with specification of the machine to operate on as well as the related risks during the maintenance operation (to the person and/or to the machine) [5]. Another functionality can be added to these smart glasses, where they allow the operator to save on the device’s memory the degree of conformity of the Information Security Management System (ISMS) to the ISO 27001 standard [6, 7]. In order to ensure a better experience, the device will be connected to a measuring device (Multimeter) whose information will be displayed while minimizing the risks associated with the operation. Those are intended for operations with capital costs which justify their use, with operational efficiency as the top priority, even a technician with no prior experience can perform the required maintenance task.
Functional analysis according to the AFNOR NF X 50-101 standard Audry [8] is the process of researching, ordering, characterizing, prioritizing and enhancing the functions offered by a product to satisfy the needs of its user. It allows the description of the user's need (function to ensure), the description of the technological choices imposed on the system (constraints), the description of the system in terms of service functions (need to satisfy) and the optimization of needs economically and technically. In other terms, functional analysis is the preliminary analysis which precedes the realization of a project, so its use offers a prediction on the purpose of a product to be studied as well as the constraints to be brought to face. The performance of a functional analysis takes place in two stages which determine the life cycle of a product: internal functional analysis and external functional analysis [9, 10].
2.1 External functional analysis
In this analysis, the product is considered as a black box which performs functions and satisfies constraints against external environment. In this study, the beast horn diagram is used for expressing the needs as detailed in Table 1 and Figure 1.
Table 1. Beast horn diagram
|
To whom? |
On what? |
For what purpose? |
|
Industrial maintenance operator |
The environment and installation |
Display ISMS control, machine maintenance operations as well as environmental information |
Figure 1. Beast horn diagram
Next, some system constraints are defined, i.e., delimit fields of action of the study system, which is smart glasses, to know for what purpose it is used and its contribution as a system. Based on Figure 1, the answers to the three questions lead to a statement of need. In addition, the Octopus diagram in Figure 2 allows the identification of smart glasses working environment, as well as the contribution of their use in various possible situations.
Octopus diagram:
This diagram (Illustrated in Figure 2) is used for the expression of functions; therefore, it allows the graphic representation of a part of the scope statement. It also helps to clearly identify the environment in which the system evolves and identifies the relationships between this system and the elements of the surrounding environment as well as the relationships between pairs of external elements.
Figure 2. Octopus diagram
In Table 2, a description for each function of the system is assign according to Figure 2 as follows:
Table 2. Octopus diagram functions designation
|
Function |
Designation |
|
FP1 |
Display ISMS Controls, machine maintenance operations, as well as environmental information |
|
FC1 |
Use the system |
|
FC2 |
Support the system |
|
FC3 |
Transmit the program |
|
FC4 |
Act on the functioning of the system and provide the information |
|
FC5 |
Power the system |
The conducted external functional analysis using the two tools (beast horn and Octopus diagrams) illustrates the relationships between the system and its external environment. However, it remains insufficient as to reach a perfect understanding of the system. Thus, an internal analysis is carried out.
Functional scope statement:
The Table 3 represent the functional specifications for each function, assessment standard as well as levels are defined.
2.2 Internal functional analysis
The system consists of several internal elements which ensure the harmonic operation. It performs technical functions to satisfy the expected service functions; identifies each main and complementary technical function; characterizes the internal functioning of the object or technical system; models the interactions produced by the model with its environment; and focuses on the organization of technical solutions and their degree of performance in the satisfaction of the need.
FAST analysis (Function Analysis System Technic):
It helps to think objectively about the problem and to determine the project scoop by illustrating logical relationships between functions. The functions logical arrangement in a FAST diagram Sinha and Steel [11] allows to define all the required functions. This diagram can be used to check and illustrate how a proposed solution reaches the needs of the project, to determine the useless, duplicated, or omitted functions.
Table 3. Octopus diagram functions
|
Functions |
Function statement |
Assessment Standard |
Levels |
|
FP |
Display machine maintenance operations as well as environmental information |
Color: Dimensions: Resolution: Communication: Operating voltage: Visible angle: |
White 27mm * 27mm * 4.1mm 128×64 pixels I2C 3.3Volts to 5V > 160° |
|
FC1 |
Use the system |
Difficulty of use |
Simple |
|
FC2 |
Support the system |
Material: Manufacturing Method: Mass: Volume: |
ABS plastic 3D printing 49.93 grams 36,207 cubic centimetres |
|
FC3 |
Transmit the program |
speed |
Fast |
|
FC4 |
Act on the functioning of the system and provide the information |
Place of operation |
Factory |
|
FC5 |
Power the system |
Energy |
3.7V |
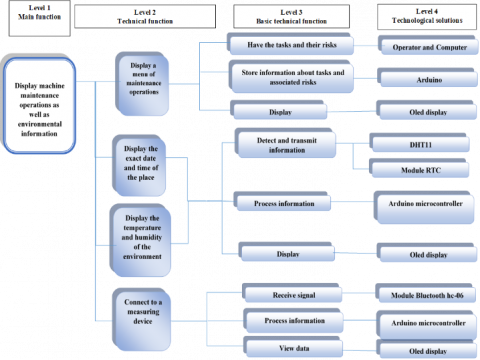
Figure 3. FAST diagram
A FAST diagram presents a hierarchical breakdown of the system’s functions going from service functions in connection with external environment, through technical functions up to statement technological solutions used or planned to perform those functions.
Figure 3 is developed in stages, we start with the functions found using external functional analysis, then we extend the functions in the “why” and “how” directions. The answer to the first question provides the main functions and access to a higher-order technical function by reading the diagram from right to left. The second question answer allows us to decompose the function to elementary functions in order to obtain the technological solutions by reading the diagram from left to right.
The creation of the FAST diagram is a creative reflection process which makes possible to develop a project common understanding; determine the omitted functions; define, simplify and clarify the problem; organize and understand the relationships between functions; determine the basic function of the project, process or product; improve communication and consensus and increase creativity.
SADT analysis (Structured Analysis and Design Technic):
After establishing the first step (Fast analysis), we move to the SADT method [8, 12, 13] which allows description of project tasks and their interactions. It also describes the system that the project aims to study, to create or to modify by highlighting parts constituting system, its purposes, its functioning, and interfaces between them, which make a system a structured organization.
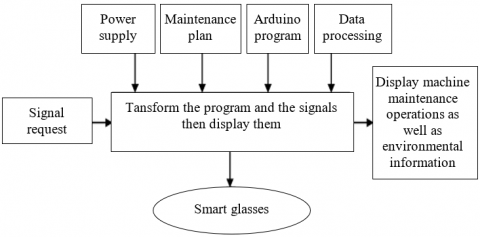
In our case, A-0 diagram allows to define the main function which is displaying maintenance tasks, risks, and environment’s information.
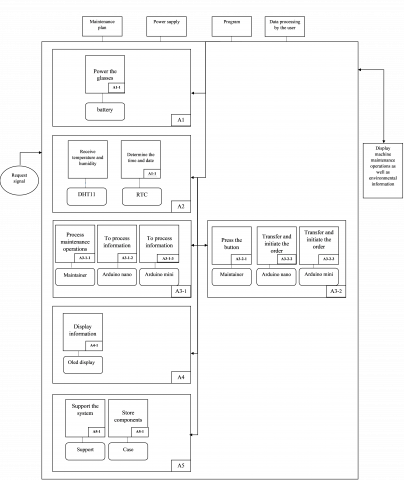
After elaborating the A-0 diagram (Figure 4), the A0 level (Illustrated in Figure 5) is developed based on the previous model according to a descending hierarchy by dividing the system into subsets. It is worth mentioning that the boxes model the actions of the system, connection between them, interfaces, and constraints.
Figure 4. SADT diagram (A-0 level)
Figure 5. SADT diagram (A0 level)
This section will focus on the system’s architecture definition, since the design of smart glasses for industrial use is a complex process which includes: creation, simulation and feasibility study on SolidWorks to find out the future sizing of the product, as well as the as the maximum loads they can bear.
3.1 Scope statement
It is essential to know all the product manufacturing process and its composition to define needs and technical constraints for the implementation of smart glasses. To achieve this, a “scope statement or product requirements” document is made, which presents context, objectives, and scope of the project.
The product to be developed ‘smart glasses’ consists of:
A 3V battery to power the system;
A DHT11 and RTC which are environmental data sensors;
An Arduino for processing and data transferring;
Oled display to display the stored data;
A case to store all the components.
3.1.1 System functions
Smart glasses provide three main functions; the first of which consists of data collection from a pre-existing database then display it through a device allowing the reflection of the image. The data to be displayed consist of: Maintenance operations to be performed by the operator; the machine concerned by the operation; and the risk related to the maintenance operation (mechanical, electrical ...). The second function concerns retrieving the data via a Bluetooth device from other tools (Multimeter) used by the maintenance operator. The last function consists of displaying data related to the operator's environment on the glasses screen, two sensors "DHT11 and RTC" will be used for data collection. A menu will allow switching from one function to another, navigation will be managed using buttons or a joystick.
3.2 Synoptic diagram
The synoptic diagram is the presentation, generally graphic, which allows to grab a set of information related to a complex system. The device synoptic diagram of the smart glasses is illustrated in Figure 6.
More details of the different blocks are given in the Figure 7.
Figure 6. Device synoptic diagram
Figure 7. System operation representation
Power supply
All the device’s Oled display, resistors, DHT11 and RTC sensors, Arduino, charging circuit, Bluetooth module, joystick require stabilized power supply of (5V, 3.3V). Hence, a simple power supply has been realized from a 3.7V lipo battery or an external 12V power supply, with Arduino regulation and filtering which will supply the other components by a 3.3V current.
Control block
The concerned block is the Multimeter, Smartphone, personal computers which will transmit the data from Bluetooth to be displayed in the device screen.
Command block
This block is comprised of an Arduino. The Bluetooth accessory model 4.0. is categorized as a sequence of command blocks, since it takes over from validation of signals emitted by the Multimeter or the database towards the Arduino; therefore, it needs to be configured when programming. Before proceeding to the configuration, the following steps should be performed:
Remove all communications.
Set switch DAT operating position.
Connect the USB port to the computer.
Download the program or open a serial terminal.
Use this mode to check or change the Bluetooth configuration: PIN password, baud rate, master / slave mode.
The Bluetooth module 4.0 configuration can be carried out via serial terminal at the controls (by using IDE Arduino serial monitor, under the “Tool / Serial Monitor” menu, or just clicking on CTRL + M on the PC keyboard).
The most important commands that were used to configure the Bluetooth module are listed as follows:
AT + ROLE 1
AT + RESET reset
AT + SHOW 1 → Bluetooth name in response
AT+IMME0 automatically connect the Bluetooth to the devices
3.3 Risks analysis
First, a consultation was carried out in a company speacilized in food processing industry about all possible risks that may cause an accident.
To estimate a risk, two principal elements are taken into consideration: the severity of possible damages and their occurrence probability.
In this perspective, production managers have been consulted in order to get the necessary documentation about machine risks and prevention mechanisms used by the manufacturer to be implemented in the database regarding the information security standards, ISO 27001, ISO 27002 and ISO 27005.
According to the safety hierarchy, there are many prevention mechanisms which depend on risk situation and consequence:
Danger elimination.
Substitution of a danger by another which have other characteristics to reduce the risk.
Using collective protective equipment to reduce risk.
Limit damage using individual protective elements.
Implementation of organizational measures.
Residual risk reporting.
Rigorous checks must be carried out each time the materials and procedures change to ensure that everything remain safe.
In order to evaluate the risk level, a filler machine has been chosen. A processing strategy for this machine was defined by using many tools as a risk assessment which is illustrated in Figure 8.
3.4 ISMS control and audit
The purpose of this control is to provide the operator with a management tool of the information security including the risk management of this activity. Resorting to international standards seems to be a response to the expectations of companies in terms of security such as ISO 27001/27002 or 2700 [2, 8, 14-17]. In a previous work, a database was developed resulting from a transformation of this ontology [16].
In this context, a solution is proposed to audit the compliance of the information security management system (ISMS) against the ISO 27001 standard, using glasses, the operator will have access to the questions previously defined by the chief auditor according to the scope defined within the organization, a menu with the existing controls and the choice of corresponding answers is proposed.
Example
Chapter 2 of ISO 27001: Organization of information security.
Objective: A management framework should be established to initiate and then monitor the implementation of information security within the organization.
Topics: Management commitment to information security Question: Does the leadership actively support the security policy within the organization?
Proposed answers: "Yes" or "No".
On the glasses’ screen, the following initials will be displayed C2T1Q1, which mean chapter 2, Theme 1 and Question 1. This measure is taken in order to save display space on the glasses’ screen.
For the answers, the operator has two choices: Yes or No.
For slightly more complex questions, a procedure for instance, the Arunraj and Maiti [5] will be used to answer the question according to the 5 existing levels namely: 0 - No document / process set up, 1- Initial, the process is characterized by the predominance of one-off, or even chaotic, interventions, it is poorly defined and success depends on individual effort. 2-Reproducible, basic security management is defined to monitor costs, deadlines and functionality; the expertise required for the process is in place to reproduce the same action. 3-Defined, the security process is documented, standardized and integrated into the organization's standard process. 4- Controlled, Detailed measurements are taken regarding the flow of the process and the quality generated. 5- Optimization, an improvement of the process is implemented by quantitative feedback emanating from the process itself.
The answer will be stored on the device, and can be transferred to a computer for analysis at the appropriate time.
Figure 8. Risk assessment
Table 4. Design results
|
Reference document name |
Treated as |
Volumetric proprieties |
|
Enlèv. mat.-Extru.3 |
Volumic object |
Mass:0.00275586 kg Volume:2.70183e-006 m3 Volumic mass :1020 kg/m3 weight:0.0270075 N |
|
Enlèv. mat.-Extru.6 |
Volumic object |
Mass:0.00945027 kg Volume:9.26497e-006 m3 Volumic mass :1020 kg/m3 weight:0.0926126 N |
|
Enlèv. mat.-Extru.10 |
Volumic object |
Mass:0.00683784 kg Volume:6.70377e-006 m3 Volumic mass:1020 kg/m3 weight:0.0670108 N |
|
Enlèv. mat.-Extru.12 |
Volumic object |
Mass:0.0116377 kg Volume:1.14096e-005 m3 Volumic mass :1020 kg/m3 weight:0.11405 N |
|
Boss.-Extru.1 |
Volumic object |
Mass:0.004284 kg Volume:3.6e-006 m3 Volumic mass :1190 kg/m3 weight:0.0419832 N |
|
Enlèv. mat.-Extru.27 |
Volumic object |
Mass:0.00625037 kg Volume:6.12782e-006 m3 Volumic masse vo:1020 kg/m3 weight:0.0612537 N |
|
Boss.-Extru.1 |
Volumic object |
Mass:0.001904 kg Volume:1.6e-006 m3 Volumic mass:1190 kg/m3 weight:0.0186592 N |
3.5 Simulation
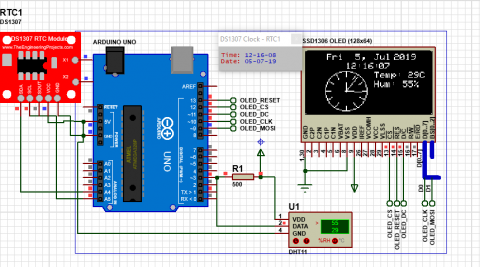
Before building the prototype, ISISPORTEUS was used, designed by Labcenter Electronics. It consists of many tools grouped into modules within a single interface. It allows to virtually create the electrical card and simulate the functions of the glasses as shown in Figure 9.
Figure 9. Simulation schematic diagram
Example: Display function of temperature and humidity as well as the date and time.
3.6 Ergonomic study
The ergonomic study aims to highlight the product’s qualities and define the strengths in terms of use.
The importance of an ergonomic action results in the realistic discovery, effective solutions as well as the functions to fill in order to satisfy the user and reduce the manufacturing costs of the product [18-20].
Ergonomics on the system
Design improvements will soon be made on the smart glasses, in particular:
• Minimize the maximum size of components and replace them with printed circuits to make the glasses light and reduce the cost of manufacturing.
• Replace joystick by a touchpad to be put it in a vertical position which will facilitate the use of the product by the maintenance operator.
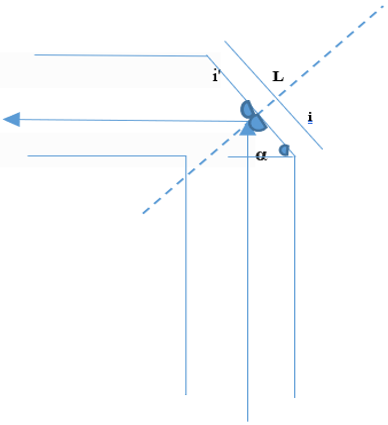
• Calculation of the reflection angle:
According to Snell Descartes law:
$i=i^{\prime}$ and $i+i^{\prime}=90^{\circ}$ (1)
$\Rightarrow i=i^{\prime}=45^{\circ}$ (2)
$\Rightarrow \alpha=45^{\circ}$ (3)
where: i: …………….
i': …………….
α: …………… (refer to Figure 10).
If we take a screen of length 2.3 cm,
$\Rightarrow \mathrm{L}=\frac{2.3}{\sin \alpha}$ (4)
$\Rightarrow L=2.7$ (5)
Figure 10. Reflection angle
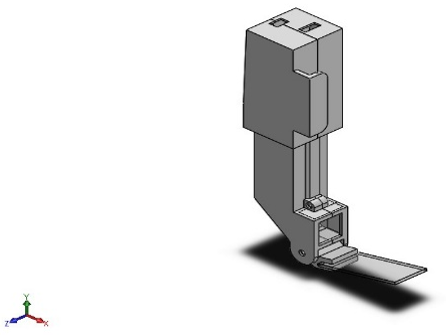
3.7 Design on SolidWorks
SolidWorks is a computer-aided design software allowing to have a simulated representation of the system’s components (Table 4). The software is used to model each part of the prototype on its own, and then assemble it to obtain the full virtual prototype of the smart glasses.
The assemblies are obtained by the juxtaposition of parts which are modelled separately. The positioning of the parts is defined by a set of assembly constraints associating two respective entities by a geometric relationship (tangency, coaxially, etc.) and mechanical connections between the parts.
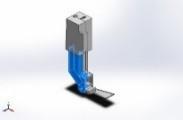
The full prototype is illustrated in Figure 11.
Figure 11. Reflection angle
This work has been conducted in order to develop and evaluate smart glasses intended for industrial maintenance application. The proposed device offers many interesting features for the maintenance operator in terms of efficiency enhancement of and risk minimization, particularly for a non-experienced operator. They make possible to the user to cheek the schedule (what tasks he must perform, on which machines), and to measure the related potential risk. In other words, the maintenance operator’s daily needs can be available on the smart glasses, as well as information about machines’ environment (temperature, humidity…etc.).
In addition, a function for navigation and connection to a measuring device is developed. For example, the connection with a multimeter will minimize the electrical risk such as short-circuit and/or electrocution, since it is possible to read the results of the measured parameter directly on the smart glasses screen.
The risk analysis was carried out on a production chain of a food-industry. The results were very satisfactory because the maintenance operator was able to know all the risks related to his tasks, and also the corresponding Personal Protective Equipment (PPE) for his safety. Furthermore, an important functionality was developed to analyze the results of ISO 27001 audit.
The simulation and the 3D modeling on “SolidWorks” allowed preparing for the physical realization of the smart glasses.
Despite the conducted studies and analyses to improve the product, it remains flawed to some extent which leaves room for improvement. In this context, the following improvements can be made: The first step is to print a part of the components using 3D printing technology; then, through software development, a database is being prepared, that will be linked to the glasses to project the risks directly on its screen in order to eliminate or reduce risks.
Nevertheless, the proposed system remains a prototype. As a result, several improvements are foreseen to further improve this work, ergonomics with new features and design, improvement of components, minimization using printed circuits are planned.
We would like to thank all the people who contributed to the success of this project, notably Salim who was brilliant.
Samir, Ikhlas and Bouteyna, thank you for all.
To my father, dead this year. (RIP).
[1] Agarwal, R., Ladha, N., Agarwal, M., Majee, K., Das, A., Kumar, S., Rai, S., Singh, A., Nayak, S., Dey, S., Dey, R., Saha, H.N. (2017). Low cost ultrasonic smart glasses for blind. In 2017 8th IEEE Annual Information Technology, Electronics and Mobile Communication Conference (IEMCON), pp. 210-213. https://doi.org/10.1109/IEMCON.2017.8117194
[2] Sandnes, F.E. (2016). What do low-vision users really want from smart glasses? Faces, text and perhaps no glasses at all. In International Conference on Computers Helping People with Special Needs, pp. 187-194. https://doi.org/10.1007/978-3-319-41264-1_25
[3] Quint, F., Loch, F. (2015). Using smart glasses to document maintenance processes. Mensch und Computer 2015–Workshopband, pp. 203‑208. https://doi.org/10.1515/9783110443905-030
[4] Pierdicca, R., Prist, M., Monteriù, A., Frontoni, E., Ciarapica, F., Bevilacqua, M., Mazzuto, G. (2020). Augmented reality smart glasses in the workplace: Safety and security in the fourth industrial revolution era. In International Conference on Augmented Reality, Virtual Reality and Computer Graphics, pp. 231-247. https://doi.org/10.1007/978-3-030-58468-9_18
[5] Arunraj, N.S., Maiti, J. (2007). Risk-based maintenance—Techniques and applications. Journal of Hazardous Materials, 142(3): 653-661. https://doi.org/10.1016/j.jhazmat.2006.06.069
[6] Disterer, G. (2013). ISO/IEC 27000, 27001 and 27002 for information security management. Journal of Information Security, 4(2). http://dx.doi.org/10.4236/jis.2013.42011
[7] Torregosa, J.T., Orong, M.Y., Ricalde, G.T., Amin, W.D., Lonzon, H.A., Alcontin, R.B. (2021). Assessing the conformity level of information security management system of the higher education institutions: Basis for the development of policies and guidelines. Mediterranean Journal of Basic and Applied Sciences (MJBAS).
[8] Audry, M.F. (2010). La démarche d’analyse fonctionnelle. Académie de Versailles.
[9] Nielsen, J. (1992). The usability engineering life cycle. Computer, 25(3): 12-22. https://doi.org/10.1109/2.121503
[10] Pinto, M.B., Pinto, J.K. (1990). Project team communication and cross‐functional cooperation in new program development. Journal of Product Innovation Management: An International Publication of the Product Development & Management Association, 7(3): 200-212. https://doi.org/10.1111/1540-5885.730200
[11] Culot, G., Nassimbeni, G., Podrecca, M., Sartor, M. (2021). The ISO/IEC 27001 information security management standard: Literature review and theory-based research agenda. The TQM Journal, 33(7).
[12] Sinha, Y., Steel, J.A. (2015). A progressive study into offshore wind farm maintenance optimisation using risk based failure analysis. Renewable and Sustainable Energy Reviews, 42: 735-742. https://doi.org/10.1016/j.rser.2014.10.087
[13] Mortureux, Y. (2001). La sûreté de fonctionnement: méthodes pour maîtriser les risques. https://doi.org/10.51257/a-v1-ag4670
[14] Faris, S., Medromi, H., El Hasnaoui, S., Iguer, H., Sayouti, A. (2014). Toward an effective information security risk management of universities’ information systems using multi agent systems, ITIL, ISO 27002, ISO 27005. Editorial Preface. https://doi.org/10.14569/IJACSA.2014.050617
[15] Boualem, S.A., Meryem, B., Fatima, N. (2017). Maintenance & information security ontology. In 2017 4th International Conference on Control, Decision and Information Technologies (CoDIT), pp. 0312-0317. https://doi.org/10.1109/CoDIT.2017.8102610
[16] Joshi, A., Kale, S., Chandel, S., Pal, D.K. (2015). Likert scale: Explored and explained. British Journal of Applied Science & Technology, 7(4): 396. https://doi.org/10.9734/BJAST/2015/14975
[17] Chang, W.R., Leclercq, S., Lockhart, T.E., Haslam, R. (2016). State of science: occupational slips, trips and falls on the same level. Ergonomics, 59(7): 861-883. https://doi.org/10.1080/00140139.2016.1157214
[18] Charrier, M. (2016). Ergonomie et design dans une démarche de conception de produits centrée sur les besoins des personnes (Doctoral dissertation, Université de Technologie de Belfort-Montbeliard).
[19] Hatta, K., Liyama, Y. (1991). Ergonomic study of automatic teller machine operability. International Journal of Human‐Computer Interaction, 3(3): 295-309. https://doi.org/10.1080/10447319109526014
[20] Wisner, A. (1995). Understanding problem building: ergonomic work analysis. Ergonomics, 38(3): 595-605. https://doi.org/10.1080/00140139508925133