Jing Gao | Normala Ismail* | Yanjun Gao
© 2022 IIETA. This article is published by IIETA and is licensed under the CC BY 4.0 license (http://creativecommons.org/licenses/by/4.0/).
OPEN ACCESS
Theoretical research results such as computer big data analysis and machine learning are essential support for the design of convenient and effective deep learning models, however, existing studies seldom viewed this problem from the perspectives of computer big data sampling, parallel processing optimization, data preprocessing, and predictive maintenance. To fill in this gap, this paper researched the computer big data analysis and predictive maintenance based on deep learning. At first, the paper elaborated on the self-adaptively adjusted sampling and parallel processing optimization of computer big data, and gave the flow of computer big data preprocessing based on a deep learning model; then, it introduced the computer big data analysis and predictive maintenance method based on deep learning; at last, experiments were conducted to compare the performance of different Convolutional Neural Network (CNN) models and the results proved the effectiveness of the proposed model.
deep learning, computer big data, predictive maintenance, self-adaptively adjusted sampling, parallel processing, Convolutional Neural Network (CNN)
In modern society, hi-tech is booming, data volume grows explosively, and the world has entered the era of big data [1-8]. World field scholars have done a lot of work to analyze the massive and complex unstructured and semi-structured computer big data, mine the general directions and correlations of the data, so as to make good use of great potential value of big data [9-14]. Theoretical research results such as machine learning are essential support for the effective analysis of computer big data [15-21]. Designing convenient and effective deep learning models for computer big data analysis is of great practical significance for lowering the threshold of computer big data utilization and increasing the work efficiency of analysts.
Alsheikh et al. [22] briefly introduced deep learning in mobile big data analytics and discussed a scalable learning framework over Apache Spark. This Spark-based framework can increase the learning speed of deep models consisting of many hidden layers and millions of parameters. The authors used a context-aware activity recognition application with a real-world dataset containing millions of samples to validate the proposed framework and assess its speedup effectiveness. Since the beginning of the 2000s, in order to deal with the increase in data proliferation, digital computing space has grown dramatically, and these data come from various fields, Ahmed et al. [23] proposed that social network is one of the field that can generate various data, the interactive data and metadata can provide information of user profiles, and all these data require large storage capacity; if the storage of such large quantities of information needs to be improved, then significant and feasible advances in processing and interpretation are also required. Scholar Luo [24] developed a few in-depth learning frameworks, including CAE, for some of the world’s top research institutions, these deep learning frameworks not only provide efficient and fast development models for research institutions and developers, but also offer several CNN models for developers so that they can study and improve them further. For big data storage platforms, to ensure user data safety, they need to perform cyclic verification on the stored data and repair the damaged data in a timely manner. In view of problems such as the low verification efficiency, low check frequency and low calibration accuracy of HDFS data integrity check, Li et al. [25] proposed a new HDFS storage platform security check and repair scheme. Data cleaning is an important process in the history of data acquisition, data storage, data management and data analytics, and is still going through rapid development, Rama Satish and Kavya [26] employed different cleaning methods, namely error detection methods and data repairing algorithms, to prove the accuracy of a data extraction system. Then in order to attain accurately extracted data and improve data quality, they proposed a hybrid algorithm which integrated Cuckoo Search Optimization with Gravitational Search algorithm, in their paper, the hybrid algorithm was used to detect errors in data received by source files and repair these errors before sending them out.
The existing computer big data analysis and predictive maintenance models established based on deep learning cannot well adapt to the linear and non-linear changes of big data, and existing studies seldom viewed this problem from the perspectives of big data sampling, parallel processing optimization, data preprocessing, and predictive maintenance. Therefore, to fill in this gap, this paper researched computer big data analysis and predictive maintenance based on deep learning. The specific content of this paper includes these aspects: the second chapter elaborated on the self-adaptively adjusted sampling and parallel processing optimization of computer big data; the third chapter introduced the flow of computer big data preprocessing based on a deep learning model; the fourth chapter proposed the computer big data analysis and predictive maintenance method based on deep learning; the fifth chapter gave the comparative experimental results of different CNN models, and verified the effectiveness of the proposed model.
Computer big data are continuous data flows with uncertain and unpredictable features. The release frequency of computer big data can directly affect their utilization value. If the release frequency cannot meet users’ daily needs for query and application, it might cause time shift in the overall trend of big data.
The conventional release period of computer big data is fixed, assuming Q represents the sampling period, then Formula 1 gives the expression of the released computer big data:
$\left\{ B\left( o \right)|b\left( o \right)=A\left( o+iQ \right) \right\}i=0,1,2,...$ (1)
Although the above expression form ensures that the trend of original computer big data won’t shift in time, the data release effect is not ideal. Thus, in order to accurately reflect the details in the dynamic changes of computer big data, this paper adopted a more flexible and self-adaptively adjusted sampling method. If the data update and change fast, then the data release period should be shortened as much as possible. If the data update and change slowly, then the data release frequency should be lowered as much as possible.
Assuming: B(oi) and B(oj) represent the statistical values of two adjacent computer big data, then the change rate could be expressed as Formula 2:
$D{{H}_{j}}=\frac{B\left( {{o}_{j}} \right)-B\left( {{o}_{i}} \right)}{{{o}_{j}}-{{o}_{i}}}$ (2)
Then, the growth rate of computer big data is the ratio of change rate (Formula 2) to the statistical value of computer big data:
$E{{H}_{j}}=\frac{D{{H}_{j}}}{B\left( {{o}_{i}} \right)}$ (3)
The length of the next sampling period can be self-adaptively adjusted based on the changes of the sampling growth rate of the previous sampling period, that is, the previous sampling period and the adjacent period together determine the length of the next sampling period. Assuming: γ and ψ represent adjustment coefficients, O represents the adjustment range; ω represents the threshold of growth rate, then the adjustment strategy of sampling period adopted in this paper is given by Formula 4:
$PW{{F}_{j+1}}=\left\{ \begin{align} & PW{{F}_{j}}-\gamma \cdot O,if\text{ }E{{H}_{j}}=0 \\ & PW{{F}_{j}},if\text{ }0<\left| E{{H}_{j}} \right|\le \omega \\ & PW{{F}_{j}}-\psi \cdot O,if\text{ }\omega \le \left| E{{H}_{j}} \right| \\\end{align} \right.$ (4)
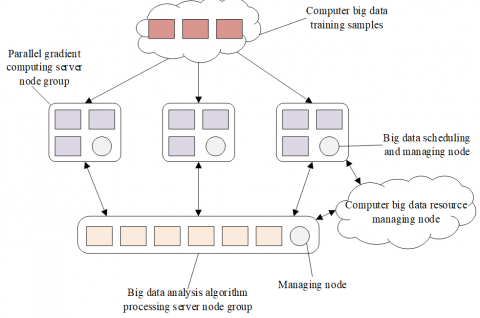
Figure 1. Architecture of big data analysis algorithm processing servers
The structure of existing CNN-based big data analysis and prediction algorithm models is quite large already, and the complexity of the parallel gradient calculation process of server nodes has increased greatly, so it’s very necessary to perform parallel optimization on the CNNs. The architecture of big data analysis algorithm processing servers shown in Figure 1 is a kind of distributed and scalable machine learning architecture, which mainly contains an algorithm processing server node group and several parallel gradient computing server node groups. The nodes between each node group can communicate with each other, so as to guarantee the reliability of the implemented big data analysis and parallel optimization strategy.
The specific parallel gradient computing process of the model has two stages: forward propagation and back propagation. Assuming: JHk and ωk respectively represent the activation function and the offset of the k-th layer in the CNN; Tik represents the weight of the i-th neuron between the k-th layer and the k-1-th layer; then the calculation formula of forward propagation is given by Formula 5:
$J{{H}_{k}}=\sum\limits_{i=0}{T_{k}^{i}J{{H}_{k-1}}+{{\omega }_{k}}}$ (5)
In the back propagation stage, the network error is calculated based on the activation function of the previous layer and its value is passed back. Assuming: σk represents the error value calculated in the k-th layer, Tik represents the weight of the i-th neuron in the l-th layer, then the calculation formula of back propagation is given by Formula 6:
${{\sigma }_{k}}=\sum\limits_{i=0}{T_{k+1}^{i}{{\sigma }_{k+1}}}$ (6)
In order to effectively reduce the convergence fluctuation of global parameters of the servers during the neural network training process, it is necessary to appropriately increase the learning rate during parameter update to improve the performance of the algorithm. Assuming δ represents the introduced global learning rate, its value range is (0, 1), then there is:
${{t}_{k}}={{t}_{k}}-\sum{\delta \Delta {{t}_{k}}}$ (7)
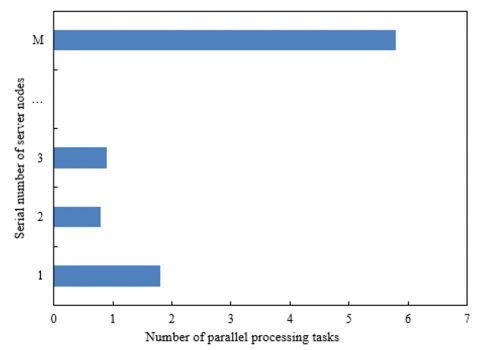
As the volume of computer big data grows and the degree of parallelism of CNN model training increases, the data skew problem becomes increasingly prominent, as shown in Figure 2. Since the big data analysis algorithm processing server nodes will undertake most of the parallel processing tasks, and the model training time will be greatly prolonged, to cope with this problem, it’s necessary to call the big data scheduling and managing node algorithm to help idle nodes actively acquire data processing tasks.
Figure 2. The diagram of data skew in the big data analysis algorithm processing server node group
Due to the impact of various interference factors, the obtained computer big data might be incomplete or not comprehensive enough, that is, there will large amounts of missing data, abnormal data, repeated data, or errors data in the original computer big data, which can affect the recognition, mining, and further application of the computer big data. This paper fully considered the correlations between computer big data, pre-processed the data, and restored them based on deep learning.
In this paper, the weighted average method was adopted to pre-process the computer big data, that is, the data were weighted and summed and then divided by the total data volume. Assuming: Rτα represents the weighted average at time moment τ, αi represents the weight value, then there is:
${{R}_{\tau \alpha }}=\frac{{{\alpha }_{1}}{{r}_{\tau }}+{{\alpha }_{2}}{{r}_{2}}+...+{{\alpha }_{M}}{{r}_{\tau -M+1}}}{{{\alpha }_{1}}+{{\alpha }_{2}}+...+{{\alpha }_{M}}},\tau \ge M$ (8)
In this paper, the missing computer big data of time moment τ+1 were filled with the weighted average of the computer big data of time moment τ, its calculation formula is given by Formula 9:
${{\tilde{R}}_{\tau +1}}={{R}_{\tau \alpha }}$ (9)
As for computer big data with history trend, in this paper, the data collected by computers at the current time moment and at the same time in the previous day were weighted to realize the restoration of the missing data items. Assuming: r1τ, r2τ, and r3τ respectively represent the primary, secondary, and tertiary exponential estimates of computer big data at time moment τ; aτ represents the real value at time moment τ; β represents the weighting coefficient and its value range is [0, 1], then Formula 10 gives the exponential smoothing formulas of the three:
$\left\{ \begin{align} & R_{\tau }^{1}=\beta {{a}_{\tau }}+\left( 1-\beta \right)R_{\tau -1}^{1} \\ & R_{\tau }^{2}=\beta R_{\tau }^{1}+\left( 1-\beta \right)R_{\tau -1}^{2} \\ & R_{\tau }^{3}=\beta R_{\tau }^{2}+\left( 1-\beta \right)R_{\tau -1}^{3} \\\end{align} \right.$ (10)
When the exponential smoothing method is used to process computer big data with linear trend, it’s prone to causing problems such as lag and deviation, so for data with this feature, it’s better to adopt the differential exponential smoothing method for data processing. Assuming: $\nabla$ 2 represents the second-order difference, then Formulas 11-14 give the formulas of second-order difference exponential smoothing:
$\nabla {{r}_{\tau }}={{r}_{\tau }}-{{r}_{\tau -1}}$ (11)
${{\nabla }^{2}}{{r}_{\tau }}=\nabla {{r}_{\tau }}-\nabla {{r}_{\tau -1}}$ (12)
${{\nabla }^{2}}{{\hat{r}}_{\tau +1}}=\beta {{\nabla }^{2}}{{r}_{\tau }}+\left( 1-\beta \right){{\nabla }^{2}}{{\hat{r}}_{\tau }}$ (13)
${{\hat{r}}_{\tau +1}}={{\nabla }^{2}}{{\hat{r}}_{\tau +1}}+\nabla {{r}_{\tau }}+{{r}_{\tau }}$ (14)
Assuming: ȓt,u(o) represents the real data of the u-th day in the t-th sampling period; rt-m,u(o) represents the data volume of the u-th day in the t-m-th sampling period; β represents the weighting coefficient; then the restoration of missing data could be achieved by the following formula:
${{\hat{r}}_{t,u\left( o \right)}}=\beta {{r}_{t-1,u\left( o \right)}}+\left( 1-\beta \right)\beta {{r}_{t-2,u\left( o \right)}}+...+\left( 1-\beta \right)\beta m-1{{r}_{t-m,u\left( o \right)}}$ (15)
For the processing of repeated data, the first thing is to unify the dimensions of computer big data, that is, to normalize the data and map all the data to the [0,1] interval. Assuming: b represents the original computer big data; b' represents the normalized data; max(b) represents the maximum value of the data; min(b) represents the minimum value of the data, then, the discrete normalization processing, namely the calculation formula of min-max normalization is given by Formula 16:
$b'=\frac{b-min\left( b \right)}{max\left( b \right)-min\left( b \right)}$ (16)
As for abnormal data whose attribute exceeds the value range, the z-score normalization could be adopted to process them. Assuming: b represents the original data; b* represents the mean of the original data; εb represents the standard deviation of the original data, then the calculation formula of z-score normalization is:
$b'=\frac{b-{{b}^{*}}}{{{\varepsilon }_{b}}}$ (17)
As for data with decimals, normalization processing could be performed by moving the position of the decimal point. The number of moves of the decimal point is determined by the maximum value of the absolute value of the data, and the mapping interval of the data is [-1,1], the corresponding calculation formula is given by Formula 18:
$b'=\frac{b}{{{10}^{j}}}$ (18)
For a forward sequence of computer big data b1,b2,......bm whose values are all positive, its normalization processing is given by Formula 19:
${{a}_{i}}=\frac{{{b}_{i}}}{\sum\limits_{i=1}^{m}{{{b}_{i}}}}$ (19)
The value range of the new data sequence a1,a2,......am obtained from the above formula is [0, 1], and ∑me=1ai=1.
Through the data pre-processing described in the previous chapter, most of the missing data, abnormal data, and error data had been deleted or restored. However, during the normal computer big data collection process, there’re certain period and peak characteristics, and the common data filling and restoration methods are not applicable any more in cases of different sampling intervals or different missing conditions. Under such circumstances, the predictive maintenance of computer big data based on deep learning has a better effect. Based on the existing Long Short Term Memory (LSTM) network structure and its ability to track information, this paper designed a data restoration technology based on improved LSTM network, and Formula 20 gives the expression of the missing matrix QSτi:
$Q{{S}_{{{\tau }_{i}}}}=\left\{ \begin{align} & \text{0},No\text{ }missing \\ & 1,Missing \\\end{align} \right.$ (20)
If there are collected values of computer big data at time moment τi, then USτi=0, indicating that there is no missing value at time moment τi. If there’s no collected value of computer big data at time moment τi, then QSτi=1, indicating that there’re missing values at time moment τi. Assuming: USτi is a periodic matrix, then its calculation formula is given by Formula 21:
$U{{S}_{{{\tau }_{i}}}}=\left\{ \begin{align} & 0,{{\tau }_{i}}==0 \\ & {{\tau }_{i}}-{{\tau }_{i-1}},U{{S}_{{{\tau }_{i-1}}}}==0\And {{\tau }_{i}}>0 \\ & {{\tau }_{i}}-{{\tau }_{i-1}}+U{{S}_{{{\tau }_{i-1}}}},U{{S}_{{{\tau }_{i-1}}}}==1\And {{\tau }_{i}}>0 \\\end{align} \right.$ (21)
According to above formula, the period between the value of computer big data collected at time moment τi and the value collected last time is USτi. Assuming: MGτ represents the attenuation coefficient of the memory gate in the LSTM network; Ts and φs represent parameters to be trained, then Formula 22 gives the calculation formula of the attenuation coefficient of memory gate MGτ:
$M{{G}_{\tau }}={{d}^{-max\left( {{T}_{s}}\bullet U{{S}_{{{\tau }_{i}}}}+{{\phi }_{s}},0 \right)}}$ (22)
Since MGτ had been introduced into the LSTM network, the predicted value aτ of the computer big data should be modified, and the modification formula is given by Formula 23:
$\begin{align} & {{a}_{\tau }}=n*{{a}_{\tau }}+\left( 1-n \right)*M{{G}_{\tau }}*{{a}_{\tau '}} \\ & +\left( 1-n \right)*\left( 1-M{{G}_{\tau }} \right)+{{a}_{\tau }} \\\end{align}$ (23)
Assuming: JY'τ represents current memory; JYτ-1 represents long-term memory; gτ represents forget gate; iτ represents input gate, then the formula for obtaining new state in the input gate could be modified to:
$J{{Y}_{\tau }}={{g}_{\tau }}*J{{Y}_{\tau -1}}*M{{G}_{\tau }}+{{i}_{\tau }}*J{{{Y}'}_{\tau }}$ (24)
The computer big data with missing values were input into the improved LSTM network model introduced above, the values of each time moment aτ in the cycles within the model were updated based on Formula 21. If there’s no missing value in aτ, the missing matrix QSτi is 1, and there’s no need to update aτ. If there’re missing values in aτ, the missing matrix QSτi is 0, and aτ is determined by the data of the previous time moment aτ-1 and the previous period aτ-W.
Expectation can describe the relative central position of all statistical values in the computer big data set. Variance can measure the extent to which the computer big data deviate from the mathematical expectations, and covariance is the overall error of expectation and variance. Tables 1 and 2 give the comparison results of entropy, time domain deviation, expectation, variance, and covariance of different big data sampling methods. Compared with other sampling methods, the self-adaptively adjusted sampling method proposed in this paper got smaller values in term of the deviation, variance, covariance and distortion rate of original sequence distribution, indicating that the proposed method showed a better performance in dynamically reflecting the changes in computer big data.
Table 3 shows the training time and accuracy of different CNN models. The reference models are three classic CNNs: LeNet, AlexNet, and DenseNet. According to the data in the table, under the condition that the accuracy change requirement of CNNs was not very high, adopting the proposed model as the strategy for the parallel processing of computer big data could attain shorter training time and higher training speed.
Table 1. Entropy, time-domain deviation, and expectation of different big data sampling methods
|
Indicator |
Entropy |
Time-domain deviation |
Expectation |
||
|
Value |
Distortion rate |
Value |
Distortion rate |
||
|
Original sequence |
2.0316 |
0.0125% |
0.9526 |
2.8475 |
0.0241% |
|
Uniform sampling |
2.4857 |
0.0384% |
0.0152 |
3.2695 |
0.0148% |
|
Poisson sampling |
2.7369 |
0.0168% |
0.0263 |
2.5841 |
0.0362% |
|
The proposed sampling method |
2.8457 |
0.0326% |
0.0528 |
2.6585 |
0.0485% |
Table 2. Variance and covariance of different big data sampling methods
|
Indicator |
Variance |
Covariance |
||
|
Value |
Distortion rate |
Value |
Distortion rate |
|
|
Original sequence |
4.5812 |
0.1258% |
4.185 |
0.1462% |
|
Uniform sampling |
3.9586 |
0.1625% |
3.2694 |
0.1528% |
|
Poisson sampling |
5.4721 |
0.1748% |
5.1473 |
0.1362% |
|
Self-adaptively adjusted sampling |
4.1853 |
0.0126% |
4.1629 |
0.1394% |
Table 3. Training time and accuracy of different CNN models
|
Model |
The proposed method |
Reference model 1 |
Reference model 2 |
Reference model 3 |
|
|
Mnist |
Time (s) |
15.027 |
59.152 |
9635.147 |
24851.396 |
|
Accuracy |
0.915 |
0.947 |
0.926 |
0.918 |
|
|
Cifar10 |
Time (s) |
11.251 |
55.284 |
8946.295 |
28415.153 |
|
Accuracy |
0.815 |
0.835 |
0.926 |
0.872 |
|
|
Flowers |
Time (s) |
16.928 |
9.184 |
552.362 |
1625.841 |
|
Accuracy |
0.819 |
0.842 |
0.951 |
0.817 |
|
Table 4. Prediction errors of different prediction models
|
Model |
The proposed model |
Reference model 1 |
Reference model 2 |
Reference model 3 |
Reference model 4 |
|
RMSE |
0.6308 |
0.7485 |
0.6259 |
0.7124 |
0.6925 |
|
MAE |
0.4624 |
0.5274 |
0.4624 |
0.4172 |
0.4051 |
|
MAPE |
2.4131 |
2.368 |
2.0152 |
2.386 |
2.9158 |
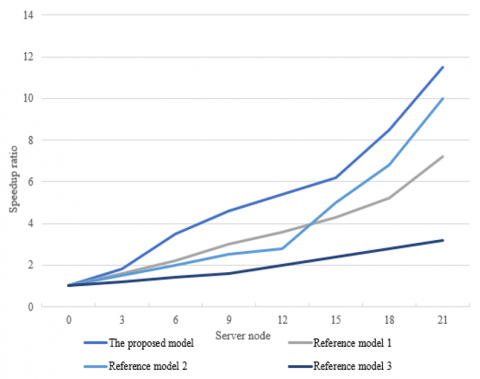
Figure 3 gives the experimental results of the speedup ratios of different CNN models. According to the figure, compared with other reference models, the proposed model exhibited lower sensitivity to the volume growth of computer big data, indicating that it is more suitable for the processing of large-volume computer big data. Also, under the condition that the number of big data analysis algorithm processing server nodes had increased, the proposed model got a higher speedup ratio, and its effect in improving data processing speed was more obvious.
Figure 3. Experimental results of speedup ratios of different CNN models
To verify the advantages of predictive maintenance of computer big data based on deep learning, this research ran the constructed predictive maintenance model for multiple times in the experiment and took the average value of the results. Table 4 compares the prediction errors of different prediction models. The reference models include the time series model, autoregressive integrated moving average model, feedforward neural network, and radial basis neural network. According to the table, the prediction error of the proposed model was the smallest, indicating that it could effectively cope with the prominent periodic characteristics and spatiotemporal correlations of computer big data with significant non-linear features during the prediction process.
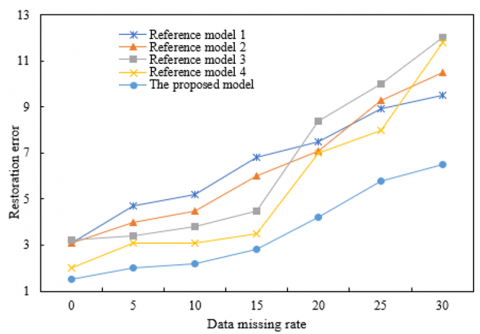
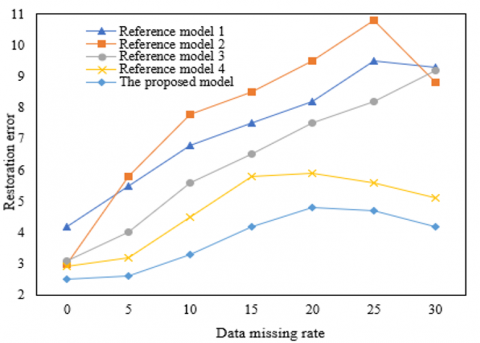
Figures 4 and 5 respectively give the prediction error and determination coefficient of each model under different sampling intervals. As can be seen from the figures, the prediction error of each model increased with the increase of data missing rate. According to Figure 4(1), when the sampling interval was 10 minutes, the prediction errors of the models were similar, and their effects in computer big data restoration were close. According to Figure 4(2), when the sampling interval was 20 minutes, under the condition of a data missing rate between 5% and 30%, the prediction error of the proposed model was always the lowest, and its prediction accuracy was the highest.
1)
2)
Figure 4. Prediction error of each model under different sampling intervals
1)
2)
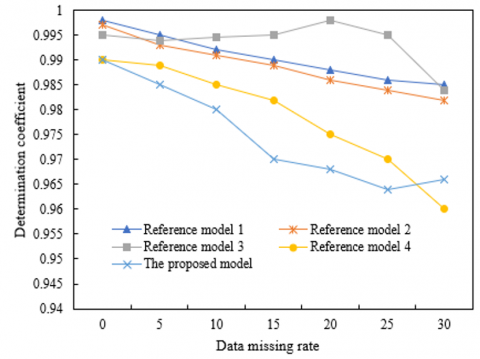
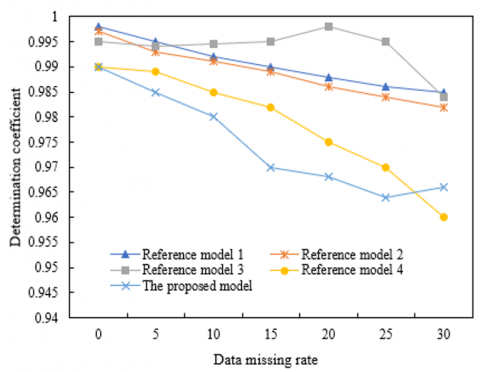
Figure 5. Determination coefficient of each model under different sampling intervals
The determination coefficient of the model is the goodness of fit, which can measure the predictive maintenance effect of the model. According to Figure 5, when the data missing rate was relatively low, the proposed model attained a smaller sampling interval; when the goodness of fit of the computer big data was relatively high, the restoration accuracy of computer big data was the best.
This paper studied the computer big data analysis and predictive maintenance based on deep learning. In the beginning, the texts expounded how to self-adaptively adjust the sampling of computer big data and perform parallel optimization, then it gave the flow of computer big data pre-processing based on deep learning, and proposed a predictive maintenance method for computer big data based on deep learning. In the experimental results, this paper compared the entropy, time-domain deviation, expectation, variance, and covariance of different sampling methods, and verified that the proposed sampling method performed better in dynamically reflecting the changes in computer big data. Moreover, the speedup ratios of different CNN models and the prediction errors of different prediction models were compared as well, and the results proved that the proposed model had the smallest prediction error and it can effectively cope with the prominent periodic characteristics and spatiotemporal correlations of computer big data with significant non-linear features during the prediction process. At last, this paper compared the prediction error and determination coefficient of each model under different sampling intervals, and demonstrated that the error of the proposed model was always the smallest, its prediction accuracy was the highest, and its restoration accuracy of computer big data was the best.
Ministry of Education Industry-University Collaborative Education Project: "Exploration and design of personalized instruction model in smart education environment". (Grant No.: 202101307004).
[1] Zhao, L. (2021). Event prediction in the big data era: A systematic survey. ACM Computing Surveys (CSUR), 54(5): 1-37. https://doi.org/10.1145/3450287
[2] Wang, X., Wu, Z., Shen, S. (2022). Financial technology risk management and control in the big data era. In International Conference on Cognitive based Information Processing and Applications (CIPA 2021), pp. 368-374. https://doi.org/10.1007/978-981-16-5854-9_46
[3] Yan, P. (2022). The mixed teaching mode of civil aviation English in the era of big data. In Innovative Computing, 1245-1252. https://doi.org/10.1007/978-981-16-4258-6_152
[4] Liu, X.Y. (2021). Agricultural products intelligent marketing technology innovation in big data era. Procedia Computer Science, 183: 648-654. https://doi.org/10.1016/j.procs.2021.02.110
[5] Li, C. (2021). Construction of digital management courses in the big data era. In International Conference on Machine Learning and Big Data Analytics for IoT Security and Privacy, 97: 27-435. https://doi.org/10.1007/978-3-030-89508-2_54
[6] Xie, J. (2021). New tools for macroeconomic analysis in the era of big data. In International Conference on Big Data Analytics for Cyber-Physical-Systems, 102: 513-521. https://doi.org/10.1007/978-981-16-7466-2_57
[7] Zhang, W., Liu, B., Tsai, S.B. (2022). Analysis and research on digital reading platform of multimedia library by big data computing in internet era. Wireless Communications and Mobile Computing, 2022. https://doi.org/10.1155/2022/5939138
[8] Liu, Y., Qi, W. (2021). Application of flipped classroom in the era of big data: what factors influence the effect of teacher-student interaction in oral English teaching. Wireless Communications and Mobile Computing, 2021. https://doi.org/10.1155/2021/4966974
[9] Xu, G.T., Jiang, R.Q., Wei, W., Jiang, L.B., Yue, Z.J. (2019). Correlation analysis and causal analysis in the era of big data. In IOP Conference Series: Materials Science and Engineering, 563(4): 042032. https://doi.org/10.1109/ACCESS.2019.2927360
[10] Li, T. (2022). Cigarette data marketing methods based on big data analysis. In International Conference on Cognitive based Information Processing and Applications (CIPA 2021), 84: 438-444. https://doi.org/10.1007/978-981-16-5857-0_55
[11] Xu, G., Yu, Z., Chen, Z., Qiu, X., Yao, H. (2019). Sensitive information topics-based sentiment analysis method for big data. IEEE Access, 7: 96177-96190. https://doi.org/10.1109/ACCESS.2019.2927360
[12] Iosifidis, A., Tefas, A., Pitas, I., Gabbouj, M. (2017). Big Media data analysis. Signal Processing: Image Communication, 59: 105-108.
[13] Li, Y.X., Lu, Z., Zhang, F. (2022). Product packaging design based on cognitive big data analysis. In International Conference on Cognitive based Information Processing and Applications (CIPA 2021), 84: 502-509.
[14] Dellnitz, A. (2022). Big data efficiency analysis: Improved algorithms for data envelopment analysis involving large datasets. Computers & Operations Research, 137: 105553. https://doi.org/10.1016/j.cor.2021.105553
[15] Simpson, W.R., Foltz, K.E. (2016). Access and privilege in secure big data analysis. International Journal of Design & Nature and Ecodynamics, 11(3): 295-305. https://doi.org/10.2495/DNE-V11-N3-295-305
[16] Khezrimotlagh, D., Zhu, J., Cook, W.D., Toloo, M. (2019). Data envelopment analysis and big data. European Journal of Operational Research, 274(3): 1047-1054. https://doi.org/10.1016/j.ejor.2018.10.044
[17] Kremer, J., Stensbo-Smidt, K., Gieseke, F., Pedersen, K.S., Igel, C. (2017). Big universe, big data: machine learning and image analysis for astronomy. IEEE Intelligent Systems, 32(2): 16-22. https://doi.org/10.1109/MIS.2017.40
[18] Chen, J., Jiang, Q., Wang, Y., Tang, J. (2016). Study of data analysis model based on big data technology. In 2016 IEEE International Conference on Big Data Analysis (ICBDA), pp. 1-6. https://doi.org/10.1109/ICBDA.2016.7509810
[19] Cremer, S., Loebbecke, C. (2019). Artificial intelligence imagery analysis fostering big data analytics. Future Internet, 11(8): 178. https://doi.org/10.3390/fi11080178
[20] Rosà, A., Chen, L.Y., Binder, W. (2016). Failure analysis and prediction for big-data systems. IEEE Transactions on Services Computing, 10(6): 984-998. https://doi.org/10.1109/TSC.2016.2543718
[21] Liu, O., Man, K.L., Chong, W., Chan, C.O. (2016). Social network analysis using big data. In Proceedings of the International Multi Conference of Engineers and Computer Scientists, 2: 6-7.
[22] Alsheikh, M.A., Niyato, D., Lin, S., Tan, H.P., Han, Z. (2016). Mobile big data analytics using deep learning and apache spark. IEEE network, 30(3): 22-29. https://doi.org/10.1109/MNET.2016.7474340
[23] Ahmed, A.S., Abood, M.S., Hamdi, M.M. (2021). Advancement of deep learning in big data and distributed systems. In 2021 3rd International Congress on Human-Computer Interaction, Optimization and Robotic Applications (HORA), pp. 1-7. https://doi.org/10.1109/HORA52670.2021.9461274
[24] Luo, X. (2021). Research on convolutional neural network based on deep learning framework in big data education. In EAI International Conference, BigIoT-EDU, pp. 109-114. https://doi.org/10.1007/978-3-030-87903-7_16
[25] Li, J., Liu, Y., Zhang, Z., Chao, H. C. (2020). A method of data integrity check and repair in big data storage platform. In International Conference on Bio-inspired Information and Communication Technologies, pp. 183-188. https://doi.org/10.1007/978-3-030-57115-3_15
[26] Rama Satish, K.V., Kavya, N.P. (2017). Hybrid optimization in big data: error detection and data repairing by big data cleaning using CSO-GSA. In International Conference on Cognitive Computing and Information Processing, pp. 258-273. https://doi.org/10.1007/978-981-10-9059-2_24