Wiharto* | Esti Suryani | Sigit Setyawan
© 2021 IIETA. This article is published by IIETA and is licensed under the CC BY 4.0 license (http://creativecommons.org/licenses/by/4.0/).
OPEN ACCESS
Coronary heart disease is a non-communicable disease with high mortality. A good action to anticipate this is to do prevention, namely by carrying out a healthy lifestyle and routine early examinations. Early detection of coronary heart disease requires a number of examinations, such as demographics, ECG, laboratory, symptoms, and even angiography. The number of inspection parameters in the context of early detection will have an impact on the time and costs that must be incurred. Selection of the right and important inspection parameters will save time and costs. This study proposes an intelligence system model for the detection of coronary heart disease by using a minimal examination attribute, with performance in the good category. This research method is divided into a number of stages, namely data normalization, feature selection, classification, and performance analysis. Feature selection uses a Two-tier feature selection framework consisting of correlation-based filters and wrappers. The system model is tested using a number of datasets, and classification algorithms. The test results show that the proposed two-tier feature selection framework is able to reduce the highest attribute of 73.51% in the z-Alizadeh Sani dataset. The performance of the system using the bagging-PART algorithm is able to provide the best performance with parameters area under the curve (AUC) 95.4%, sensitivity 95.9% while accuracy is 94.1%. Referring to the AUC value, the proposed system model is included in the good category.
coronary artery disease, two-tier feature selection, information gain, fast correlation-based filter
The ongoing COVID-19 pandemic has had an impact on changing people's lifestyles. These lifestyle changes will affect physical, mental health, and aspects of social behavior [1]. It was shown that the COVID-19 pandemic had a negative impact on the general health status of physically inactive women aged 50 to 70 years, potentially increasing their susceptibility to comorbidities, such as type 2 diabetes and hypertriglyceridemia [2]. It is also reinforced that changes in lifestyle that are not goodwill have an impact on the incidence of coronary heart disease [3]. Heart disease has a high mortality rate plus during the COVID-19 pandemic it is a comorbid disease, so appropriate prevention and treatment are needed [4].
The development of artificial intelligence is so fast and has been widely applied in various fields, including the health sector, one of which is for the diagnosis of coronary heart disease [5, 6]. The development of intelligence system models for the diagnosis of coronary heart disease has been carried out, one of the stages is feature selection. Research that has been carried out using a two-tier ensemble classifier and tested using the z-Alizadeh Sani, Cleveland, Hungarian and Statlog dataset [7]. The feature selection used is correlation-based feature selection (CFS) with the search method using particle swarm optimization (PSO). The best performance produced is when using the z-Alizadeh Sani dataset with the number of attributes that provide the best performance of 27 attributes, with AUC performance above 90% (very good category) [8]. In testing using the Cleveland dataset, 7 attributes are needed to be able to provide 85.86% AUC performance.
The next intelligence system model uses hybrid particle swarm optimization and emotional neural network, while using the z-Alizadeh Sani dataset it still requires 22 attributes to produce 88.34% accuracy, the Statlog dataset requires 8 attributes and the Cleveland 7 attributes dataset [9]. The ability of feature selection which is not much different is done with a feature selection model that uses the relief technique, and the proposed Least Absolute Shrinkage and Selection Operator (LASSO) is only able to reduce the Cleveland attribute dataset to 10 attributes to provide the best performance [10].
Furthermore, the development of an intelligence system model based on Classification and Regression Trees (CART) algorithms has been carried out [11]. The CART algorithm belongs to the decision tree family, so the feature selection process is embedded. In testing using 15, 10, and 5 attributes. The performance resulting from the test shows the use of 5 attributes in the z-Alizadeh Sani dataset, able to provide a sensitivity of 98.61%. Unfortunately, the performance does not explain the validation method used. Tests carried out using only one dataset. The z-Alizadeh Sani dataset was also used in the study of Joloudari et al. [12]. This study uses a feature selection stage by using a significance ranking for prediction using the Random Tree, C5.0, Support Vector Machine (SVM), and Chi-Squared Automatic Interaction Detection (CHAID) algorithms. The best system performance uses Random Trees, with a total of 40 attributes with an AUC value of 96.70%, and uses 10-fold cross-validation. The number of attributes is more than the 2 previous studies [7, 11].
The use of the z-Alizadeh Sani dataset was also carried out in the study of Abdar et al. [13] and Dahal and Gautam [14]. Research by Abdar et al. [13] proposed a diagnosis model using the Nested Ensemble Nu-Support Vector Classification (NE-nu-SVC) algorithm. The resulting performance reached an accuracy of 94.66%, besides that it was also tested using a Cleveland dataset, with an accuracy result of 98.6%. In this study, no feature selection process was carried out, meaning that all attributes of the dataset were used in the test. Dahal and Gautam's [14] research proposes a model using the feature selection stage, the feature selection process produces 15 attributes. The results of the feature selection process are then classified by testing using a number of classification algorithms, namely logistic regression (LR), bagging PART, RF, SVM, and kNN. The resulting performance for the highest accuracy with SVM algorithm 89.47%, RF sensitivity 96.23%, and the highest AUC LR 90.32%.
The next research focuses only on using the Cleveland dataset. Research conducted by Akella and Akella [15], tested 6 machine learning methods using the Cleveland dataset. The model used does not perform the feature selection stage. The highest accuracy performance is obtained when using the neural network method. The research of Enriko et al. [16], also used the Cleveland dataset. This study uses chi-square to rank the examination attributes, while the classification uses the k-NN algorithm with weighting. The test results using 8 attributes and 13 attributes are able to provide better performance than nave Bayesian and simple CART. A similar study was also conducted by Almustafa [17], with the best performance generated when using the k-NN algorithm with 3 examination attributes.
Referring to a number of studies that have been carried out, it shows that the developed intelligence system model has good performance but requires a lot of inspection attributes. Multiple inspections have consequences for the cost and time required. In these conditions, a feature selection process is needed that is able to select features that are relatively few but are capable of being used for diagnosis with good performance. Many feature selection algorithms have been developed, such as based on filtering, wrapper, and embedded, where each has advantages and disadvantages, so many developments are carried out in combination, but the selection of combinations must be right, in order to be able to produce the best features. The most commonly used combinations are filtering and wrapper.
Filtering-based algorithms include Correlation-based Feature Subset Selection (CFSS), this algorithm has a better feature selection capability, which is indicated by better classification results than information gain, relief, and fuzzy rough + fuzzy entropy [18]. Another advantage of this method is that the computational process is faster than the others, but the disadvantage of this method is that it has fewer features. The weakness of this method can be improved by combining it with the BFS algorithm [19]. The BFS algorithm can find solutions quickly without having to test more samples, so it doesn't require a lot of memory. Unfortunately, the ability of BFS is also not perfect, one of the weaknesses is that it allows for local optimum [20]. The combination of CFSS with BFS still allows for local optimum, so it needs to be improved by combining it with a wrapper. The use of wrappers for feature selection will make feature selection controlled by the performance of the resulting classification. This makes the weaknesses in the first layer can be overcome. The wrapper process uses the PART classification algorithm [18, 21] which is combined with a stepwise greedy algorithm [22], and the performance parameter uses accuracy. The greedy stepwise algorithm has a relatively fast computation time and is very suitable for optimization cases [20].
In this study, a two-level feature selection framework is proposed. This framework combines feature selection based on filtering and wrapper. The filtering used is Correlation-based Feature Subset Selection combined with the best-first search algorithm, while the wrapper uses a combination of Partial Decision Tree (PART) algorithm with greedy stepwise. The system model is measured using the performance parameters sensitivity, accuracy, and area under the curve (AUC).
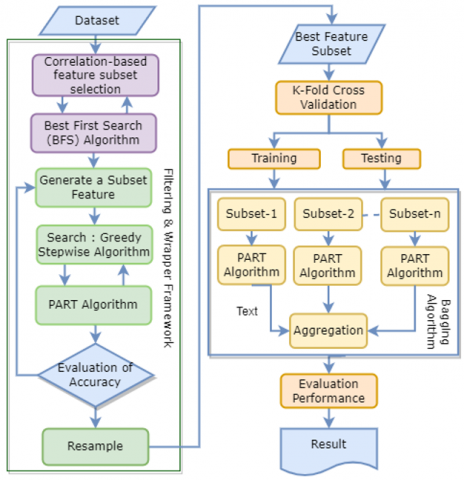
Research on the intelligence system model for the detection of coronary heart disease based on two-tier feature selection uses the method shown in Figure 1. In Figure 1, the first stage is the dataset that will be used for training and testing. This study uses existing datasets, namely z-Alizadeh Sani [23-25], Cleveland, Hungarian, Statlog, and Statlog-Cleveland-Hungary. The z-Alizadeh Sani and Statlog-Cleveland-Hungary datasets were downloaded from Kaggle, while Cleveland, Hungarian, and Statlog were obtained from the UCI (University of California, CA, USA) Center for Machine Learning and Intelligent Systems [26]. The z-Alizadeh dataset was generated from a number of examinations grouped into demographic, ECG, Laboratory & ECHO, Symptom & examinations. The Cleveland, Hungarian, and Statlog datasets consist of examination of risk factors, chest pain, ECG, scintigraphy, and fluoroscopy. For the Statlog-Cleveland-Hungary (SCH) dataset, the type of examination is the same as that of Cleveland. The five datasets have the number of features and the amount of data as shown in Table 1.
The study used a number of stages as shown in Figure 1. Figure 1 shows that the proposed feature selection model is a two-tier feature selection, which consists of filtering and wrapper. The combination becomes a Filtering & wrapper framework. The filtering used is correlation-based feature subset selection (CFSS) [27, 28] which is combined with the Best First Search (BFS) algorithm [21], so that the best feature subset will be produced.
Table 1. Dataset
|
No |
Dataset |
#Feature |
#Instance |
|
1 |
a-Alizadeh Sani |
55 |
303 |
|
2 |
Cleveland |
13 |
303 |
|
3 |
Hungarian |
13 |
294 |
|
4 |
Statlog |
13 |
270 |
|
5 |
Statlog-Cleveland-Hungary (SCH) |
11 |
1190 |
At the feature selection stage based on filtering, the process involves searching through all possible combinations of attributes in the data to find which subset of attributes are most suitable for prediction, so attribute evaluators and search methods are needed. The evaluator used is a heuristic approach by looking at the value and benefits of the feature subset. To measure the value of feature relevance, it is done by measuring the correlation value between features and classes and between features and other features. The following is a feature relevance measurement model.
$M_{s}=\frac{F_{t} \quad \overline{r_{c f}}}{\sqrt{F_{t}+\left(F_{t}-1\right)} \quad \overline{r_{f f}}}$
where, $M_{s}$ is the relevance of the feature subset, $F_{t}$ is the number of features, $\overline{r_{c f}}$ is the mean correlation coefficient between features and classes, while for $\overline{r_{f f}}$ the mean correlation coefficient between different features. In addition to measuring relevance, a search process with BFS is also required. In the search with BFS, the search is allowed to visit the node at a lower level, if it turns out that the node at a higher level turns out to have a worse heuristic value. This is done iteratively based on the best heuristic value for adjacent nodes for each current node.
Figure 1. Research method
After obtaining the results of the filtering-based feature selection process, the wrapper-based feature selection process is then carried out again. In the wrapper method, an induction algorithm is entered to then calculate the accuracy of the induction algorithm against the feature subset. The induction algorithm used is the PART algorithm [29]. The PART algorithm has an effective performance for classification in the case of high-dimensional data, so it is suitable in this case. Furthermore, the selection of feature subsets is carried out using the Greedy Stepwise search method [22] with a forward search direction starting with no features at all then features will be added one by one. In each iteration, the reduction or addition of the feature will be evaluated based on the accuracy results of the PART algorithm in the Wrapper method. Features that provide improved accuracy results will then be selected and included in the final feature subset. The last stage of the framework is the resampling process. This process aims to generate random subsampling of the dataset used.
The result of the wrapper process is the best feature which is then used for the classification process. The classification process is carried out using a classification algorithm, which tested include multi-layer perceptron [30], catBoost [30], k-NN [16], XgBoost [30], support vector machine (SVM) [12] and ensemble bagging. In the bagging ensemble, for each bootstrap, the PART classification algorithm is used [31], and then aggregation is done using majority vote (bagging-PART). The bagging-PART algorithm is shown in Algorithm 1 [32].
|
Algorithm-1: Bagging of PART |
|
Input dataset Begin
End. Output Trained C* classifier |
The proposed system model uses the k-folds cross-validation method. Evaluation of system performance uses three parameters, namely, accuracy, sensitivity, and area under the curve (AUC). The test uses 5 datasets and 7 classification algorithms, to conclude the Friedman Test is used. Friedman Test (FT) is used to rank all classification algorithms used so that the best classification algorithm can be shown.
3.1 Result
The two-tier feature selection framework uses two feature selection concepts, namely filtering and wrapper. The result of feature selection for each tier can be shown in Table 2. In Table 2, if it is seen from the percentage reduction of the attributes of dust, the average for the first tier is 53.03%, whereas if using two tiers the average is 73.51%. The addition of the second tier is able to reduce the attribute reduction results in the first tier by an average of 49.20%. The highest reduction was 92.73% in the z-Alizadeh Sani dataset and the lowest was 36.36% in the SCH dataset.
Table 2. Result of feature selection
|
Dataset |
#Feature |
#Selected Feature |
Reduction |
|
|
1st Tier |
2nd Tier |
|||
|
z-Alizadeh Sani |
55 |
13 |
4 |
92.73% |
|
Cleveland |
13 |
7 |
3 |
76.92% |
|
Hungarian |
13 |
4 |
2 |
84.62% |
|
Statlog |
13 |
7 |
3 |
76.92% |
|
SCH |
11 |
8 |
7 |
36.36% |
The next test is performance measurement using a classification algorithm. The parameters used are the area under the curve, accuracy, and sensitivity. The performance of the proposed system model for the AUC performance parameters can be shown in Table 3. Referring to the ranking of the Fredman test results shown in Table 3, the best performance is given by the Random Forest algorithm, followed by the bagging + PART algorithm, and the lowest performance is the SVM algorithm. The bagging-PART algorithm gives the best performance on the z-Alizadeh Sani, Cleveland, and SCH datasets, with the AUC value included in the very good category [8].
Table 3. Performance of area under the curve (AUC)
|
Methods |
Dataset to- |
FT |
||||
|
1 |
2 |
3 |
4 |
5 |
||
|
Neural Network |
92.4 |
85.9 |
85.8 |
87.6 |
92.1 |
26 |
|
Catboost |
88.7 |
88.6 |
89.7 |
87.7 |
97.1 |
17 |
|
Random Forest |
87.2 |
89.3 |
90.1 |
88.3 |
97.9 |
11 |
|
kNN |
86.7 |
86.9 |
88.0 |
88.2 |
84.8 |
25 |
|
xgboost |
86.3 |
88.4 |
90.0 |
85.9 |
98.0 |
20.5 |
|
SVM |
86.2 |
87.1 |
89.1 |
87.8 |
92.5 |
24 |
|
Bagging-PART |
95.4 |
90.2 |
75.8 |
86.3 |
98.0 |
16.5 |
Table 4. Performance of accuracy
|
Methods |
Dataset to- |
|||||
|
1 |
2 |
3 |
4 |
5 |
FT |
|
|
Neural Network |
87.5 |
84.2 |
84.2 |
83.0 |
85.1 |
20 |
|
Catboost |
83.8 |
85.8 |
85.8 |
85.9 |
91.8 |
13.5 |
|
Random Forest |
81.2 |
84.8 |
84.5 |
85.6 |
93.5 |
19 |
|
kNN |
84.2 |
80.9 |
80.9 |
81.1 |
77.1 |
28 |
|
xgboost |
82.2 |
83.8 |
83.8 |
85.9 |
96.4 |
18.5 |
|
SVM |
83.8 |
79.5 |
79.5 |
83.3 |
84.5 |
29.5 |
|
Bagging-PART |
94.1 |
85.8 |
80.6 |
87.0 |
93.9 |
11.5 |
Table 5. Performance of sensitivity
|
Methods |
Dataset to- |
FT |
||||
|
1 |
2 |
3 |
4 |
5 |
||
|
Neural Network |
90.7 |
84.2 |
89.1 |
87.2 |
83.9 |
22.5 |
|
Catboost |
88.0 |
85.8 |
91.0 |
91.0 |
91.8 |
14.5 |
|
Random Forest |
87.0 |
84.8 |
87.8 |
90.4 |
93.1 |
21.0 |
|
kNN |
91.2 |
80.9 |
87.2 |
87.2 |
74.8 |
28.5 |
|
xgboost |
87.5 |
83.8 |
89.7 |
91.0 |
96.6 |
16.5 |
|
SVM |
91.7 |
79.5 |
86.5 |
88.5 |
81.3 |
27.0 |
|
Bagging-PART |
95.9 |
91.7 |
87.9 |
92.3 |
93.1 |
10.0 |
The next parameter is accuracy, the test results are shown in Table 4. The best accuracy of the test using five datasets is Bagging-PART, with the highest accuracy value is 95.9%. The performance ranking below is given by the catBoost algorithm, while the lowest is the k-NN algorithm. The next performance parameter is sensitivity, the test results are shown in Table 5. The best performance is shown by the Bagging-PART algorithm, with the highest value reaching 95.9% and the lowest performance occurring in the k-NN algorithm. Performance parameters are important parameters when used for screening coronary heart disease. The sensitivity value is 95.9%, indicating that when the intelligence system tests patients who are positive for coronary heart disease, the system is able to provide a 95.6% probability of the patient being true positive for coronary heart disease. The sensitivity performance parameter is also used in the AUC parameter. The AUC parameter is a graph of sensitivity vs. 1-specificity. The AUC value of 95.4% indicates that, when the system is used to detect 100 patients, the intelligence system can detect with correct conclusions as many as 96 patients, while the rest are wrong.
3.2 Discussion
The ability of the two-tier feature selection framework in reducing attributes is as shown in Table 2. Referring to Table 2, it can be explained the increase in each tier of the proposed framework. The use of the first tier, which is using a combination of CFSS and BFS, is able to reduce attributes by an average of 73.51%, with the highest reduction occurring in the z-Alizadeh Sani dataset. Furthermore, with the addition of a second tier, which uses a wrapper with the PART algorithm and the greedy algorithm, it is able to provide an additional increase in an average reduction of 20.48%. The highest additional reduction occurred in the Cleveland and Statlog datasets. The percentage increase in a reduction for each tier can be shown in Table 6. Referring to Table 6 shows that the addition of tiers can increase the attribute reduction ability. The ability of a two-tier framework that is able to reduce attributes by an average of 73.51% is also balanced with good system performance. The ability of the system is shown by the performance parameters of the best accuracy and sensitivity occurred in the z-Alizadeh Sani dataset of 94.10% and 95.90%. For the AUC performance parameter, the best ability is given to the SCH dataset, which is 98.0%, while the z-Alizadeh Sani dataset is 95.4%.
Table 6. Percentage reduction for each tier
|
Dataset |
Reduction |
||
|
1st Tier |
2nd Tier |
Total |
|
|
z-Alizadeh Sani |
76.36% |
16.36% |
92.73% |
|
Cleveland |
46.15% |
30.77% |
76.92% |
|
Hungarian |
69.23% |
15.38% |
84.62% |
|
Statlog |
46.15% |
30.77% |
76.92% |
|
SCH |
27.27% |
9.09% |
36.36% |
|
Mean |
53.03% |
20.48% |
73.51% |
Attributes reduction using a two-tier feature selection framework result in attribute reduction as shown in Table 7. The z-Alizadeh Sani dataset has attributes that can be grouped into 4, namely demographic groups Electrocardiogram (ECG), laboratory and echo, and symptom and examination [11]. Referring to the grouping, the results of the reduction with the two-tier framework obtained 3 groups, meaning that the two-tier framework eliminates the ECG inspection. The examination only requires Demographics consisting of age and HTN, then the examination of symptoms in the form of typical chest pain, and laboratory examination in the form of the Regional Wall Motion Abnormality (RWMA) region. When compared with the research of Ghiasi et al. [11], two attributes are the same, namely age and typical chest pain, while the next two attributes are different. The number of attributes produced is also less, with the resulting performance for better accuracy, reaching 94.1%. In the proposed system, the inspection attribute that requires high costs is the inspection of the RWMA region. So overall it is relatively cheap when compared to previous models.
The reduction for the Cleveland, Hungarian, Statlog, and SCH datasets is almost the same, namely, the examination includes risk factor screening, symptoms, ECG, scintigraphy, and fluoroscopy [33]. The reduction results for the Cleveland and Statlog datasets are the same, namely cp (chest-pain-type), ca (number of major vessels colored by coronary angiography), and thal (defect type: scintigraphy). When referring to the examination of angiography and scintigraphy, it is an expensive type of examination and is the main type of examination for the diagnosis of coronary heart disease, which is able to confirm the presence or absence of blockages in blood vessels. This means that by using these two examinations, it is able to produce an accurate examination. The use of these 3 attributes is able to provide an AUC performance of 90.2%, the performance is the same as the study conducted by Wiharto et al. [34], but this study used all examinations except coronary angiography. The Hungarian dataset uses the same attributes as Cleveland and Statlog, but the attribute reduction results are different, this is because the Hungarian dataset has a number of missing value attributes. Most of the missing values are ca and thal attributes, so the results of the reduction are Exang and Slope, which are the results of the ECG examination.
Table 7. Selected feature
|
Dataset |
#Selected Feature |
|
z-Alizadeh Sani |
age, HTN, typical-chest-pain, region-RWMA |
|
Cleveland |
cp, ca, thal |
|
Hungarian |
exang, slope |
|
Statlog |
cp, ca, thal |
|
SCH |
sex, chest-pain-type, cholesterol, max-heart-rate, exercise-angina, oldpeak, st-slope |
The next research that has been done using the Cleveland dataset was carried out by Miao and Miao [35] using a deep neural network. The resulting performance is only able to provide the AUC performance parameter value of 89.22%. Unfortunately, the performance is obtained by using all existing attributes. Deep learning algorithms are also used in the research of Hussain et al. [36]. The results of the study were able to provide 96.15% AUC performance, but by using 13 examination attributes. The performance is generated by using a data validation model that is, dividing the data into 80% for training and 20% for testing. When compared with the proposed model, the resulting AUC is 90.2% with 10-fold cross-validation, and it is still in the very good category [8]. The advantage of the proposed model is that it only uses 3 examination attributes. A deep learning-based intelligence system model was also carried out by Mehmood et al. [37], but with relatively similar results to Hussain et al. [36].
Table 8. Previous research using the z-Alizadeh Sani dataset
|
Ref. |
Methods |
#Feature |
ACC |
AUC |
|
[7] |
CFS+PSO |
27 |
98.13 |
98.7 |
|
[9] |
Hybrid PSO +ENN |
22 |
88.34 |
- |
|
[11] |
CART |
5 |
92.41 |
- |
|
[12] |
Random Forest |
40 |
91.47 |
96.70 |
|
[13] |
v-support vector machine |
29 |
93.08 |
91.51 |
|
[14] |
SVM |
15 |
89.47 |
88.68 |
|
[25] |
Genetic + NN |
22 |
93.85 |
- |
|
Proposed |
Two-tier FS, Bagging-PART |
4 |
94.10 |
95.40 |
The results of the reduction for the Cleveland dataset which produces 5 attributes have been carried out by Shah et al. [38]. Attribute reduction is done by using a combination of feature selection and feature extraction. Feature selection uses the mean fisher-based feature selection algorithm (MFFSA) and accuracy-based feature selection algorithm (AFSA). The feature selection stages are able to reduce attributes to 9 (cp, thalach, exang, oldpeak, ca, thal, age, sex, slope). In the feature extraction stage, using a principal component analysis (PCA) based feature extraction algorithm (PCAFEA), then 5 principal components are selected and then classified. This study did not do a mapping from 5 principal components to attributes [39], so it could not detect how many inspection attributes were produced. The complexity of the attribute reduction process was only able to provide 83.1% accuracy performance. If referring to the stages before PCA was carried out, the number of examination attributes is still too high, plus from the 9 attributes there are still two expensive examinations, namely ca and thal. A complete comparison with several studies that have been carried out can be shown in Table 8.
The two-tier feature selection framework model, by combining two filtering and wrapper methods, is able to reduce attributes to an average of 73.51%. Attribute reduction with this value is still able to provide AUC performance in the very good category. The best AUC value is shown when using the Bagging-PART classification algorithm on the SCH dataset of 98% and 95.4% on the z-Alizadeh Sani dataset. The lowest performance was obtained when using the Hungarian dataset, this was due to a large number of missing values. The proposed framework has been able to reduce many attributes so that it can affect the cost and time of inspection. The thing that needs to be done in the future is how in the feature selection process there are cost variables that are used for consideration in feature selection.
Many dimensional reduction models have been developed, especially with the wrapper method. The current reduction model still focuses on how to be able to reduce as many features as possible with the best possible classification performance output. In many cases, the dimension reduction process must consider several things, which are not just classification performance. This is the future challenge in the development of dimensional reduction models, in various fields.
We would like to thank the National Research and Innovation Agency of the Republic of Indonesia for providing research funding under the Basic Research Grant scheme with Contract Number: 221.1/UN27.22/HK.07.00/2021. We would like to thank all those who have assisted in the completion of this research.
[1] Powers, S.K., Roberts, W.O., Gomez-Cabrera, M.C., Radak, Z. (2020). The COVID-19 pandemic and physical activity. Sports Medicine and Health Science, 2(2): 55-64. https://doi.org/10.1016/j.smhs.2020.05.006
[2] Ribeiro de Lima, J.G., Abud, G.F., de Freitas, E.C., Bueno Júnior, C.R. (2021). Effects of the COVID-19 pandemic on the global health of women aged 50 to 70 years. Experimental Gerontology, 150(2021): 1-6. https://doi.org/10.1016/j.exger.2021.111349
[3] Kim, J., Lee, J., Lee, Y. (2015). Data-mining-based coronary heart disease risk prediction model using fuzzy logic and decision tree. Healthcare Informatics Research, 21(3): 167-174. https://doi.org/10.4258/hir.2015.21.3.167
[4] Seidu, S., Kunutsor, S.K., Cos, X., Khunti, K. (2021). Indirect impact of the COVID-19 pandemic on hospitalisations for cardiometabolic conditions and their management: A systematic review. Primary Care Diabetes, 15(4): 653-681. https://doi.org/10.1016/j.pcd.2021.05.011
[5] Haleem, A., Javaid, M., Singh, R.P., Suman, R. (2021). Applications of Artificial Intelligence (AI) for cardiology during COVID-19 pandemic. Sustainable Operations and Computers, 2(2021): 71-78. https://doi.org/10.1016/j.susoc.2021.04.003
[6] Wiharto, W., Kusnanto, H., Herianto, H. (2017). System diagnosis of coronary heart disease using a combination of dimensional reduction and data mining techniques: A review. Indonesian Journal of Electrical Engineering and Computer Science, 7(2): 514-523. https://doi.org/10.11591/ijeecs.v7.i2.pp514-523
[7] Tama, B.A., Im, S., Lee, S. (2020). Improving an intelligent detection system for coronary heart disease using a two-tier classifier ensemble. BioMed Research International, 2020: 1-10. https://doi.org/10.1155/2020/9816142
[8] Gorunescu, F. (2011). Data Mining: Concepts, Models and Techniques. Soft Computing. Berlin, Heidelberg: Springer.
[9] Shahid, A.H., Singh, M.P. (2020). A novel approach for coronary artery disease diagnosis using hybrid particle swarm optimization based emotional neural network. Biocybernetics and Biomedical Engineering, 40(4): 1568-1585. https://doi.org/10.1016/j.bbe.2020.09.005
[10] Ghosh, P., Azam, S., Jonkman, M., Karim, A., Shamrat, F.M.J.M., Ignatious, E. (2021). Efficient prediction of cardiovascular disease using machine learning algorithms with relief and LASSO feature selection techniques. IEEE Access, 9: 19304-19326. https://doi.org/10.1109/ACCESS.2021.3053759
[11] Ghiasi, M.M., Zendehboudi, S., Mohsenipour, A.A. (2020). Decision tree-based diagnosis of coronary artery disease: CART model. Computer Methods and Programs in Biomedicine, 192: 1-14. https://doi.org/10.1016/j.cmpb.2020.105400
[12] Joloudari, J.H., Hassannataj Joloudari, E., Saadatfar, H., Ghasemigol, M., Razavi, S.M., Mosavi, A. (2020). Coronary artery disease diagnosis; ranking the significant features using a random trees model. International Journal of Environmental Research and Public Health, 17(3): 731. https://doi.org/10.3390/ijerph17030731
[13] Abdar, M., Acharya, U.R., Sarrafzadegan, N., Makarenkov, V. (2019). NE-nu-SVC: A new nested ensemble clinical decision support system for effective diagnosis of coronary artery disease. IEEE Access, 7: 167605-167620. https://doi.org/10.1109/ACCESS.2019.2953920
[14] Dahal, K.R., Gautam, Y. (2020). Argumentative comparative analysis of machine learning on coronary artery disease. Open Journal of Statistics, 10(4): 694-705. https://doi.org/10.4236/ojs.2020.104043
[15] Akella, A., Akella, S. (2021). Machine learning algorithms for predicting coronary artery disease: Efforts toward an open source solution. Future Science OA, 7(6): 1-9. https://doi.org/10.2144/fsoa-2020-0206
[16] Enriko, I.K.A., Suryanegara, M., Gunawan, D. (2016). Heart disease prediction system using k-nearest neighbor algorithm with simplified patient’s health parameters. Journal of Telecommunication, Electronic and Computer Engineering, 8(12): 59-65.
[17] Almustafa, K.M. (2020). Prediction of heart disease and classifiers’ sensitivity analysis. BMC Bioinformatics, 21(2020): 1-18. https://doi.org/10.1186/s12859-020-03626-y
[18] Arun Kumar, C., Sooraj, M.P., Ramakrishnan, S. (2017). A comparative performance evaluation of supervised feature selection algorithms on microarray datasets. Procedia Computer Science, 115: 209-217. https://doi.org/10.1016/j.procs.2017.09.127
[19] Singh, L., Chetty, G., Sharma, D. (2012). A novel machine learning approach for detecting the brain abnormalities from MRI structural images. In IAPR International Conference on Pattern Recognition in Bioinformatics, pp. 94-105. https://doi.org/10.1007/978-3-642-34123-6_9
[20] Russell, S.J., Norvig, P. (2010). Artificial Intelligence a Modern Approach. Third Edition. New Jersey: Prentice Hall.
[21] Kohavi, R., John, G.H. (1997). Wrappers for feature subset selection. Artificial Intelligence, 97(1-2): 273-324. https://doi.org/10.1016/S0004-3702(97)00043-X
[22] Han, J., Kamber, M., Pei, J. (2012). Data Mining: Concepts and Techniques. Third Edition. USA: Morgan Kaufmann is an Imprint of Elsevier.
[23] Alizadehsani, R., Habibi, J., Hosseini, M.J., Mashayekhi, H., Boghrati, R., Ghandeharioun, A. (2013). A data mining approach for diagnosis of coronary artery disease. Computer Methods and Programs in Biomedicine, 111(1): 52-61. https://doi.org/10.1016/j.cmpb.2013.03.004
[24] Alizadehsani, R., Zangooei, M.H., Hosseini, M.J., Habibi, J., Khosravi, A., Roshanzamir, M. (2016). Coronary artery disease detection using computational intelligence methods. Knowledge-Based Systems, 109: 187-197. https://doi.org/10.1016/j.knosys.2016.07.004
[25] Arabasadi, Z., Alizadehsani, R., Roshanzamir, M., Moosaei, H., Yarifard, A.A. (2017). Computer aided decision making for heart disease detection using hybrid neural network-Genetic algorithm. Computer Methods and Programs in Biomedicine, 141(2017): 19-26. https://doi.org/10.1016/j.cmpb.2017.01.004
[26] Detrano, R., Janosi, A., Steinbrunn, W., Pfisterer, M., Schmid, J.J., Sandhu, S. (1989). International application of a new probability algorithm for the diagnosis of coronary artery disease. The American Journal of Cardiology, 64(5): 304-310. https://doi.org/10.1016/0002-9149(89)90524-9
[27] Hall, M.A. (1999). Correlation-based Feature Selection for Machine Learning. [NewZealand]: University of Waikato.
[28] Moon, S.H., Kim, Y.H. (2020). An improved forecast of precipitation type using correlation-based feature selection and multinomial logistic regression. Atmospheric Research, 240(2020): 1-14.
[29] Cao, Y., Wu, J. (2004). Dynamics of projective adaptive resonance theory model: The foundation of PART algorithm. IEEE Trans. Neural Netw, 15(2): 245-260. https://doi.org/10.1109/TNN.2004.824261
[30] Ibrahim, A.A., Ridwan, R.L., Muhammed, M.M., Abdulaziz, R.O., Saheed, G.A. (2020). Comparison of the CatBoost classifier with other machine learning methods. International Journal of Advanced Computer Science and Applications (IJACSA), 11(11): 738-48. https://doi.org/10.14569/IJACSA.2020.0111190
[31] Berger, H., Merkl, D., Dittenbach, M. (2006). Exploiting partial decision trees for feature subset selection in e-mail categorization. Proceedings of the 2006 ACM symposium on Applied computing-SAC ’06. Dijon, France: ACM Press, pp. 1-5. https://doi.org/10.1145/1141277.1141536
[32] Gaikwad, D.P., Thool, R.C. (2015). Intrusion detection system using bagging with partial decision treebase classifier. Procedia Computer Science, 49: 92-98. https://doi.org/10.1016/j.procs.2015.04.231
[33] Wiharto, W., Herianto, H., Kusnanto, H. (2018). A tiered approach on dimensional reduction process for prediction of coronary heart disease. Indonesian Journal of Electrical Engineering and Computer Science, 11(2): 487-495. https://doi.org/10.11591/ijeecs.v11.i2.pp487-495
[34] Wiharto, W., Kusnanto, H., Herianto, H. (2017). Hybrid system of tiered multivariate analysis and artificial neural network for coronary heart disease diagnosis. International Journal of Electrical and Computer Engineering, 7(2): 1023-1031. https://doi.org/10.11591/ijece.v7i2.pp1023-1031
[35] Miao, K.H., Miao, J.H. (2018). Coronary heart disease diagnosis using deep neural networks. International Journal of Advanced Computer Science and Applications (IJACSA), 9(10): 1-8. https://doi.org/10.14569/IJACSA.2018.091001
[36] Hussain, S., Barigidad, S., Akhtar, S. (2021). Novel deep learning architecture for heart disease prediction using convolutional neural network. 1-6. arXiv:2105.10816.
[37] Mehmood, A., Iqbal, M., Mehmood, Z., Irtaza, A., Nawaz, M., Nazir, T. (2021). Prediction of heart disease using deep convolutional neural networks. Arabian Journal for Science and Engineering, 46(4): 3409-3422. https://doi.org/10.1007/s13369-020-05105-1
[38] Shah, S.M.S., Shah, F.A., Hussain, S.A., Batool, S. (2020). Support vector machines-based heart disease diagnosis using feature subset, wrapping selection and extraction methods. Computers & Electrical Engineering, 84(2020): 1-18. https://doi.org/10.1016/j.compeleceng.2020.106628
[39] Wiharto, W., Kusnanto, H., Herianto, H. (2017). Clinical decision support system for assessment coronary heart disease based on risk factor. Indian Journal of Science and Technology, 10(22): 1-12. https://doi.org/10.17485/ijst/2017/v10i22/84940