Asmae Berhich* | Imane Jebli | Paul Menounga Mbilong | Asmae El Kassiri | Fatima-Zahra Belouadha
© 2021 IIETA. This article is published by IIETA and is licensed under the CC BY 4.0 license (http://creativecommons.org/licenses/by/4.0/).
OPEN ACCESS
In recent days, the world has seen an expansion of the COVID-19 outbreak, especially the number of deaths. The mobility, the laziness to take necessary precautions, the new variants, and many other factors made the situation worse. It is thus important to study coronavirus spread to prevent people from its severity and face its danger. This paper is an investigation of the COVID-19 outbreak in six different countries. It discusses correlations and statistical analysis of the COVID-19 with weather conditions and vaccinations to explain how these factors impact the coronavirus spread. In addition, it predicts the new cases and deaths of the incoming seven days for Morocco. The predictive models applied in this paper use multi-step and multi-output prediction with both machine learning and deep learning algorithms that are specialized in time series problems. Our model algorithms give decision-makers a smart tool, using input features, to simulate different disaster situations, predict new infections, and expected deaths. It’s useful for future pandemics or new variants to be more proactive. Predicting the epidemic situation in the future using the current conditions will allow humanity to be ready for the necessary sanitary measures. This work is typically useful for any time and any pandemic crisis.
COVID-19 prediction, deep learning, neural networks, statistical analysis
The current coronavirus outbreak that broke out in Wuhan, China at the end of 2019 is a severe disease in continuous and rapid spread over the world. It was noted by the World Health Organization (WHO) as a "Public Health Emergency of International Concern" [1]. In the absence of specific drugs and treatments, vaccination is the most effective and economical way to prevent and control the COVID-19 epidemic. Global vaccine research and development were accelerating. At present many different vaccines are developed and taken by the world. As reported by WHO, on August 16, 2021, 207,784,507 cases of COVID-19 have been confirmed, including 4,370,424 deaths, and a total of 4,462,336,040 vaccine doses have been administered [2]. In this summer, various regions have actively expressed mobilization, where the recent global average is about 700,000 cases per day, a new high since the beginning of the epidemic. This increase could be caused by many factors such as mobility, weather conditions, the addition of social exchanges, and the spread of mutant strains.
With the emergent artificial intelligence (IA) and data science techniques, we can dissect the main factors causing the spread of COVID-19, by studying the correlations, analyzing the relationships, and making predictions using different methods and algorithms. These kinds of studies could help the authorities and the decision-makers to prevent and mitigate the outbreak of coronavirus and any other types of pandemics. To this end, novel machine learning (ML) deep learning (DL) based approaches and models have been applied to the COVID-19 data as a time series problem. In the same context, this paper suggests a deep analysis of the coronavirus outbreak; On one hand, it studies the impact of vaccinations and the temperature factor on the COVID-19 outbreak in six countries: Morocco, Algeria, Saudi Arabia, China, the USA, and Iceland. On the other hand, it evaluates the predictions of coronavirus in Morocco using four ML and DL multi-step/multi-output models. The models were constructed using Random Forest (RF), Multilayer Perceptron (MLP), Long Short-Term Memory (LSTM), and Convolutional Neural Networks (CNN) algorithms. RF, LSTM, MLP, and CNN are widely used in non-linear regression problems and time-series data forecast [https://machinelearningmastery.com/when-to-use-mlp-cnn-and-rnn-neural-networks/]. However, the performance of these models varies depending on the studied problem. To this end, this paper explores the four models and evaluates their efficiency in COVID-19 forecasting.
Using the data of the seven previous reported days, the models were trained to predict two outputs: the new cases and the new deaths of the incoming seven days. The multi-output quality makes the training easier because the outputs are depending on the input features and also on each other. This strong relationship facilitates the learning process for the models. And, the multi-step quality gives the predictions of multiple future time series of the given outputs, which is the future seven days in our case.
The results were evaluated and compared using the most popular performance metrics: MSE (Mean Squared Error), MAE (Mean Absolute Error), RMSE (Root Mean Squared Error), and R squared.
The paper is organized as follows: Section 2 presents the related work. Section 3 presents the statistical study of the COVID-19 outbreak before and during vaccination and its relationship with weather conditions. Section 4 explains the implemented models and the followed steps to build our prediction method. Section 5 discusses and evaluates the results. Finally, Section 6 summarizes the conclusions and perspectives of this work.
Like any epidemiological model, the COVID-19 model is characterized by uncertainties and high complexity. For this reason, ML has increasingly been considered as a potential technology for the prediction of epidemics with higher performance thanks to its generalization capacity and robustness. Several ML algorithms were used in this context, such as RF, Autoregressive Integrated Moving Average (ARIMA), Cubist Regression (CUBIST), RIDGE Regression (RIDGE), Support Vector Regression (SVR), and Stacking-Set learning that are to predict cumulative confirmed COVID-19 cases with a time horizon of one, three, and six days in advance in Brazilian provinces with high daily incidence [3]. Four other different ML methods including Linear Regression (LR), MLP, RF, and Support Vector Machines (SVM) are employed to predict cumulative coronavirus cases for the US, Germany, and the world [4]. Another ML model based on Broad Learning System was proposed by Zhan et al. [5]. It exploited the RF to select the key features, and then combined the bagging strategy and road learning system to realize a random-forest-bagging broad learning system (RF-Bagging BLS) approach to predict the progression of COVID-19.
A new nonlinear autoregressive neural network time series model (NAR-NNTS) based on Scaled Conjugate Gradient (SCG), Levenberg Marquardt (LM), and Bayesian Regularization (BR) training algorithms are used by Namasudra et al. [6] to predict COVID-19 cases. The ARIMA and nonlinear autoregressive artificial neural networks (NARANN) approaches are employed by Saba & Elsheikh [7], to model and predict the prevalence of this outbreak in Egypt. The suggested model can be used to perform multistage forecasting for the following days. Braga et al. [8] have proposed an approach based on artificial neural networks to predict daily and cumulative cases and deaths caused by COVID-19, as well as forecasting the demand for hospital beds in the Brazilian Amazon. It has been shown that this last model was able to make consistent short-term predictions.
In the field of AI, DL is recognized as a powerful tool for obtaining promising results in the analysis and prediction of time series problems. DL models can to automatically learn time dependencies and structures. In this sense, time-series techniques based on DL, including Auto-Regressive Integrated Moving Average (ARIMA), Long Short-Term Memory (LSTM), Stacked Long Short-Term Memory (SLSTM) and Prophet approaches have been applied [9], to predict short and medium-term cumulative confirmed cases, deaths and overall recovered cases in India and Chennai. According to their results, Stacked LSTM outperforms the other used models with an error of less than 2%. In addition, Elsheikh et al. [10] proposed LSTM to predict the total number of confirmed cases, cured cases, and deaths for the next three weeks in six different countries: Brazil, India, Saudi Arabia, South Africa, Spain, and the United States. In Saudi Arabia, this model outperforms ARIMA and NARANN models. Furthermore, Abbasimehr & Paki [11] suggested three hybrid methods based on combining three models multi-head attention, LSTM, and CNN with Bayesian optimization algorithm, to predict the number of daily COVID-19 infection cases for short term and long term horizons in 10 of the countries with the highest number of infections. Ayoobi et al. [12] have examined six different DL methods, including LSTM, convolutional LSTM, GRU, and bidirectional extension of each method to predict new cases and new deaths in Australia and Iran countries for one, three, and seven days ahead in the next 100 days. Dairi et al. [13] have investigated the performance of DL methods, including hybrid convolutional neural networks-Long short-term memory (LSTM-CNN), hybrid gated recurrent unit-convolutional neural networks (GAN-GRU), GAN, CNN, LSTM, and Restricted Boltzmann Machine (RBM), as well as basic ML methods, namely logistic regression (LR) and SVR, to predict confirmed and recovered COVID-19 cases from seven affected countries: Brazil, France, India, Mexico, Russia, Saudi Arabia, and the United States. Nabi et al. [14] have evaluated four DL models: LSTM, gated recurrent unit (GRU), CNN, and multivariate convolutional neural network (MCNN), to predict new COVID-19 cases in Brazil, Russia, and the United Kingdom in the long term. According to this study, the CNN algorithm outperformed the other studied models in terms of validation accuracy and consistency of predictions. [15] have proposed a new approach based on CNN and temporal Component Transformation (CT), to predict confirmed COVID-19 cases in the United States, Mexico, Brazil, and Colombia. This approach exploits CT to transform daily predictions and observations into weekly components and vice versa, also this method adapts the predictions made by CNN by employing ARIMA and ES (Exponential Smoothing) methods, according to the obtained results this hybrid method outperforms LSTM.
In terms of understanding the nature of the coronavirus and predicting its spread, further researches were needed to determine the actual impact of meteorological variables (temperature and humidity) on the virus propagation. Sajadi et al. [16] have developed a simplified model that presents an area of high risk for COVID-19 spread. Using weather modeling, they predict the most risked areas for significant community spread of COVID-19 in future weeks, allowing for focused public health efforts to limit the spread of the infectious virus. Demongeot et al. [17] showed that the virtuosity of coronavirus diseases due to viruses such as SARS-CoV and MERS-CoV decreases under humid and warm climatic conditions. The temperature dependence of the contagion by the novel coronavirus COVID-19 has raised such interest in the field of medicine. Liu et al. [18] have examined the impact of seasonality in the spread of COVID-19. This study showed that both infectivity and mortality of SARS-CoV-2 are higher in colder climates with an increase of 59.71 ± 8.72% in the total number of infections, while the warm season in the northern hemisphere countries resulted in a 46.38 ± 29.10% reduction.
A conducted study by Malki et al. [19] used various ML models, to identify the relationship between different factors and the rate of spread of COVID-19. The applied models in this study demonstrated the impact of weather variables such as temperature and humidity on the COVID-19 spread using the correlations between the number of confirmed cases and weather variables in certain regions. Based on the results, they concluded that temperature and humidity are key characteristics in predicting the mortality rate of COVID-19, in addition to an inversed correlation between temperature and the number of infections (higher the temperature is, the lower the number of infection cases is).
The current pandemic of COVID-19 requires a great deal of research to address this problem. Medical treatment has found vaccines that work as a defense system to prevent the COVID-19 reaction process. However, many of these discoveries are still being improved and tested periodically to find better results for humans. The recently integrated vaxign and vaxign-ML reverse vaccinology method based on ML was used by authors [20], to predict COVID-19 vaccine candidates. A study on the classification of four ML algorithms (decision tree, K-nearest neighbors, random tree, and Naive Bayes) is conducted by the paper [21], to study the progress of vaccination in the world by identifying the most efficient algorithms in terms of consistency and accuracy. According to their results, the decision tree outperforms the other algorithms. In addition, the authors [22] have used ML models based on bagging and boosting, employed ensemble-based models, such as RF, Extra Trees, Gradient Boosting, AdaBoost, and Extreme Gradient Boosting, to predict the daily vaccination rate in the world. The Extra Trees algorithm shows better results, i.e., minimized MAE of 6.465 and RMSE of 8.127.
In our recent works [23-25] we have applied ML and DL algorithms namely LR, RF, MLP, CNN, GRU, and LSTM memory to predict the new cases of COVID-19. Our first work uses different scenarios by examining different time lags and three COVID-19 datasets: the dataset of the confinement period (from February 7 to June 15, 2021), the dataset of the deconfinement period (from June 16 to December 2, 2021), and hybrid datasets (February 7 to December 2, 2021). The results proved the efficiency of the DL models and gave the best time lags that had good predictions of new cases. The other works, exploit and compare different LSTM and CNN architectures for COVID-19 daily cases prediction.
The majority of the previous research contributions are interesting. Some works have taken into consideration the weather conditions to predict new cases of COVID-19. However, seasonality alone is not sufficient to curb the transmission of COVID-19, but it is important to formulate intervention strategies. In addition, the literature suggests that there is a bias towards predicting the progress of vaccination without predicting new cases and deaths of COVID-19. In this context, we suggest exploiting the vaccine and weather data to study the COVID-19 pandemic, to identify the most crucial parameters that would have a real impact on the accuracy of the prediction. In other words, the use of a predictive model based on the input vaccine and weather parameters, especially the most relevant ones, is important to help health policymakers make strategic decisions to win the fight against the COVID-19 pandemic.
3.1 Vaccination analyses
As a first step, we have calculated some statistical measures such as the mean, kurtosis, standard deviation (STD), and skew to describe the evolution of the new cases, the new deaths, the total cases, and the total deaths from the COVID-19 outbreak beginning until August 29, 2021. The results are presented in Table 1.
Generally, we can note that the new cases and new deaths skew is positive and superior to one, which means that the daily values of cases and deaths were increasing and just start to decrease. But, in China and Iceland, the positive skew of new is higher, which means that they follow a normal distribution where the values were more reduced than the other countries. We think that these skewness values explain that the vaccinations were handling the decreasing of COVID-19 in the overall cases, especially in China and Iceland; and in the other countries other factors were setting back the evolution of this decrease.
Table 1. Skew, Kurtosis, Mean, and Standard deviation of COVID-29 cases and deaths in Morocco, Algeria, Saudi Arabia, United States, China, and Iceland
(The described data is from Jan 2, 2020, to Aug 29, 2021)
|
Country |
Statistical parameters |
Parameters |
|||
|
New deaths |
New cases |
Total deaths |
Total cases |
||
|
Morocco |
Skew |
1.82 |
2.74 |
0.48 |
2.1 |
|
Kurtosis |
2.95 |
8.32 |
-1.51 |
-1.15 |
|
|
Mean |
18.66 |
1246.92 |
3823.04 |
544806.31 |
|
|
STD |
24.62 |
1973.51 |
4026.26 |
242481.51 |
|
|
Algeria |
Skew |
2.17 |
1.75 |
-0.01 |
0.15 |
|
Kurtosis |
5.36 |
3.12 |
-0.84 |
-1.12 |
|
|
Mean |
9.56 |
355.4 |
2266.76 |
76409.13 |
|
|
STD |
7.68 |
314.4 |
1276.99 |
55746.0 |
|
|
Saudi Arabia |
Skew |
1.27 |
1.82 |
-0.55 |
-0.74 |
|
Kurtosis |
1.86 |
3.3 |
-1.14 |
-0.53 |
|
|
Mean |
16.8 |
1094.13 |
4710.78 |
307163.6 |
|
|
STD |
14.21 |
1115.83 |
2809.82 |
159962.46 |
|
|
USA |
Skew |
1.33 |
1.52 |
0.08 |
0.15 |
|
Kurtosis |
1.38 |
1.63 |
-1.53 |
-1.68 |
|
|
Mean |
1153.8 |
70208.1 |
326967.7 |
16779851.2 |
|
|
STD |
949.02 |
65766.0 |
214911.2 |
13573515.3 |
|
|
China |
Skew |
7.42 |
6.18 |
-2.78 |
-0.03 |
|
Kurtosis |
53.37 |
46.4 |
6.01 |
-1.14 |
|
|
Mean |
24.56 |
30.63 |
4489.99 |
86710.97 |
|
|
STD |
167.9 |
54.91 |
439.54 |
3557.55 |
|
|
Iceland |
Skew |
10.32 |
2.19 |
4.6 |
23.33 |
|
Kurtosis |
131.75 |
4.69 |
19.27 |
547.2 |
|
|
Mean |
1.03 |
21.38 |
1269.62 |
5871.88 |
|
|
STD |
0.29 |
31.54 |
6002.36 |
34419.76 |
|
Table 2. Pearson correlations between COVID-19 parameters and the daily vaccinations in Morocco, Algeria, Saudi Arabia, United States, China, and Iceland
|
Country |
Parameters |
New cases |
New deaths |
Daily vaccinations |
|
Morocco |
New cases |
1 |
0.86 |
0.45 |
|
New deaths |
0.86 |
1 |
0.28 |
|
|
Daily vaccinations |
0.45 |
0.28 |
1 |
|
|
Algeria |
New cases |
1 |
0.71 |
0.19 |
|
New deaths |
0.71 |
1 |
0.13 |
|
|
Daily vaccinations |
0.19 |
0.13 |
1 |
|
|
Saudi Arabia |
New cases |
1 |
0.77 |
0.21 |
|
New deaths |
0.77 |
1 |
0.09 |
|
|
Daily vaccinations |
0.21 |
0.09 |
1 |
|
|
USA |
New cases |
1 |
0.69 |
-0.04 |
|
New deaths |
0.69 |
1 |
-0.03 |
|
|
Daily vaccinations |
-0.04 |
-0.03 |
1 |
|
|
China |
New cases |
1 |
0.08 |
-0.06 |
|
New deaths |
0.08 |
1 |
-0.07 |
|
|
Daily vaccinations |
-0.06 |
-0.07 |
1 |
|
|
Iceland |
New cases |
1 |
0.07 |
-0.08 |
|
New deaths |
0.07 |
1 |
-0.06 |
|
|
Daily vaccinations |
-0.09 |
-0.06 |
1 |
Figure 1. Occurrences preview of the numbers of new deaths, new cases, daily vaccinations, and the fully vaccinated people in Morocco, Algeria, Saudi Arabia, United States, and Iceland
(The data is normalized for comparison and it belongs to the period between Jan 2, 2020, and Aug 29, 2021)
The standard deviation is low in the daily number of deaths which indicates that the data tend to be very close to the mean; in the case of new cases, the standard deviation is high which indicates that the data points are expanded over a large range of values.
Using the Pearson method, we have calculated the correlation between vaccinations and COVID-19 parameters (Table 2). We note that the daily number of new cases and deaths are negatively correlated with the daily vaccinations in China and the USA, which explains that the increase of vaccination numbers fits with the decrease of new cases and deaths values. But, the small numbers of correlations mean that the numbers of deaths and infected cases start to increase. In contrast, for the other countries, all the values are positively correlated with the daily vaccinations, which means that the number of deaths and cases is increasing with the increase of vaccinations.
To understand the relationship between the evolution of coronavirus and vaccination, we visualize their values in the graphs in Figure 1. We notice that the number of deaths decreased with the beginning of the vaccination process, and the number of new cases starts to decrease some days before the vaccination. From July, the number of deaths and cases start to increase reaching high numbers.
In brief, we think that vaccinations play an influencing factor in decreasing the coronavirus spread in the six countries. Whereas, the apparition of other factors like the spread of mutant strains and the mobility augmentation for unvaccinated people are increasing the spread of coronavirus causing large numbers of cases and deaths.
3.2 Weather conditions analyses
As we have explained in section II, previous works focused on humid and warm weather role on the coronavirus spread. For this reason, we have tried to explore the relationship between Covid-19 features and two main parameters of weather conditions: maximum temperature and relative humidity.
To study the correlations, we have considered the maximum temperature and the relative humidity of values of each day during the study period (from March 2020 to 29 August 2021). Table 3 shows the correlations between the daily values of weather conditions and the COVID-19 features using the Pearson method.
Table 3. Pearson correlations between COVID-19 parameters and weather conditions in Morocco, Algeria, Saudi Arabia, United States, China, and Iceland
|
Country |
Parameters |
New cases |
New deaths |
Max temperature |
Relative humidity |
|
Morocco |
New cases |
1 |
0.9 |
0.15 |
0.05 |
|
New deaths |
0.9 |
1 |
0.05 |
0.09 |
|
|
Max temperature |
0.15 |
0.05 |
1 |
-0.47 |
|
|
Relative humidity |
0.05 |
0.09 |
-0.47 |
1 |
|
|
Algeria |
New cases |
1 |
0.7 |
0.2 |
-0.003 |
|
New deaths |
0.7 |
1 |
0.38 |
0.05 |
|
|
Max temperature |
0.2 |
0.38 |
1 |
-0.11 |
|
|
Relative humidity |
-0.003 |
0.05 |
-0.11 |
1 |
|
|
Saudi Arabia |
New cases |
1 |
0.77 |
0.69 |
-0.41 |
|
New deaths |
0.77 |
1 |
0.58 |
-0.40 |
|
|
Max temperature |
0.69 |
0.58 |
1 |
-0.74 |
|
|
Relative humidity |
-0.41 |
-0.40 |
-0.74 |
1 |
|
|
USA |
New cases |
1 |
0.68 |
-0.35 |
0.03 |
|
New deaths |
0.68 |
1 |
-0.36 |
-0.06 |
|
|
Max temperature |
-0.35 |
-0.36 |
1 |
0.11 |
|
|
Relative humidity |
0.03 |
-0.06 |
0.11 |
1 |
|
|
China |
New cases |
1 |
0.11 |
-0.11 |
0.05 |
|
New deaths |
0.11 |
1 |
-0.02 |
-0.19 |
|
|
Max temperature |
-0.11 |
-0.02 |
1 |
0.31 |
|
|
Relative humidity |
0.05 |
-0.19 |
0.31 |
1 |
|
|
Iceland |
New cases |
1 |
0.07 |
0.14 |
0.19 |
|
New deaths |
0.07 |
1 |
-0.04 |
-0.01 |
|
|
Max temperature |
0.14 |
-0.04 |
1 |
0.16 |
|
|
Relative humidity |
0.19 |
-0.01 |
0.16 |
1 |
We notice high positive and negative correlations between the new deaths, cases, and the max temperature and relative humidity. For example, in Saudi Arabia, the COVID-19 feature is negatively correlated with Relative humidity -0.40 and positively correlated with max temperature +0.69 for infected cases and +0.58 for deaths. Concerning other countries, we note for some of them a small negative correlation between humidity with deaths and cases. However, we think that we should trust the correlation values of Saudi Arabia known by its recorded numbers of dew point temperature that invokes high humidity.
Thus, we think that weather conditions and especially max temperature and relative humidity could be important factors in influencing the spread of COVID-19 that should not be neglected when developing our predictive models.
4.1 Overview of the ML and DL algorithms
ML is a subset of AI. It is based on programming computers of various forms to be able to perform tasks, execute commands, and make predictions or decisions using a large amount of data without human intervention. Generally, ML algorithms are based on statistical analysis techniques to recognize patterns from a set of data, which makes them limited to learning difficult and complex problems such as time-series forecasting. To deal with this, DL algorithms are very suitable since they are designed and inspired by the way human brains work; they can extract the hidden patterns from features using multiple tuned hyperparameters.
For this reason, to enhance the COVID-19 predictions that represent a non-linear and complex behavior, we choose to apply the strongest ML model RF and DL models MLP, LSTM, and CNN.
4.1.1 Random Forest
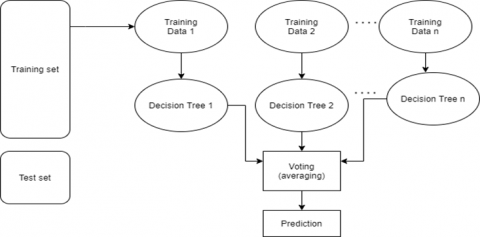
Random forest is an ensemble of ML algorithms based on the Bagging technique. It combines multiple decision trees to train and predict samples (Figure 2). It is used for classification and regression problems. To perform regression problems, RF uses bootstrap sampling to assemble multiple training subsets from the global training set. Then, the decision trees train these subsets of data and make predictions. At the end of the prediction phase, RF calculates the average of the prediction results made by the decision trees [26]. In other words, the idea behind the RF is to combine multiple “weak learners” to construct a stronger model: strong learners. RF is also known for its capacity to produce high-dimensional data without dimensionality reduction or feature selection. Otherwise, it is sensible to noisy classification or regression problems where it tends to overfit.
Figure 2. Random Forest architecture
4.1.2 Multilayer perceptron
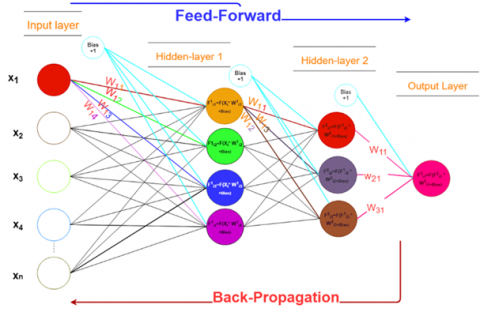
Multilayer perceptron (MLP) also called an artificial neural network, is inspired by the way that human biological neurons work. It is generally composed of three types of layers: an input layer, one or multiple hidden layers, and an output layer (Figure 3). Each layer contains one or various interconnected neurons [27].
Figure 3. Multi-layer perceptron architecture
The MLP is also a feedforward network, where it feeds the data forward from the input to the output layer, and it uses the backpropagation learning algorithm to train the data [28]. The MLP is known for its capability to learn non-linear features, thanks to the complex calculations made by the activation functions at the different units of hidden layers and the output layer.
The MLP process of calculation is described in the following equations:
$o(x)=A(b(2)+W(2) h(x))$ (1)
$h(x)=a(b(1)+W(1) x)$ (2)
h(x) is the hidden layer; o(x) is the output layer; b(1) and b(2) are the bias vectors; W(1) and W(2) are the weight matrices, and A and a are the activation functions. It exists multiple types of activation functions.
4.1.3 Long short-term memory
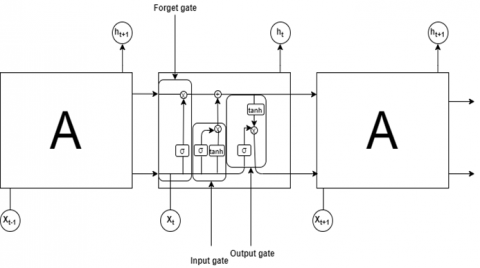
LSTM is a DL algorithm and a special kind of Recurrent neural network (RNN) that replaces the standard neural networks with three gates. It was proposed in the reference [29] and was improved and promoted by many people in later works (Figure 4). LSTM is greatly efficient on a variety of problems and it is currently widely used for time-series problems. LSTM is explicitly geared to overcome long-term dependency problems by memorizing information for a long time.
Figure 4. Long Short-Term Memory architecture
LSTM trains the inputs in a different manner where it uses a Tanh activation function to squash them and make them very small and non-linear. Then, the squashed features are fed into the input gate which selects the important information by operating a multiplication using a sigmoid function. This function filters the unneeded elements, it gives 1 to pass the information through the network and 0 to remove it. Afterward, another element called the internal state takes the last state st-1 and joins it to the current inputs, where it replaces the multiplication operation with an addition operation to avert the gradient vanishing problem. These operations are described in the following Eqns. (3)-(7):
$i_{t}=\sigma\left(W_{i \cdot}\left[h_{t-1}, x_{t}\right]+b_{i}\right)$ (3)
$c_{t}=\tanh \left(W_{c}\left[h_{t-1}, x_{t}\right]+b_{c}\right)$ (4)
$f_{t}=\sigma\left(W_{f \cdot}\left[h_{t-1}, x_{t}\right]+b_{f}\right)$ (5)
$o_{t}=\sigma\left(W_{o}\left[h_{t-1}, x_{t}\right]+b_{o}\right)$ (6)
$h_{t}=o_{t} * \tanh \left(c_{t}\right)$ (7)
The recurrence of states is enhanced by a forget gate. This gate picks the elements that should be memorized and ignores the others that should be forgotten using a sigmoid function. Finally, the Tanh function squashes the outputs. These outputs are controlled by an output gate that specifies the values that are recognized to be the outputs of the current cell state.
Where it, ct, ft, ot, ht are the input gate, cell state, forget gate, output gate, and the hidden state respectively. Wi, Wc, Wf, and Wo are their weight matrices respectively. bi, bc, bf, and bo are the biases. Xt is the input, ht-1 is the last hidden state, ht is the internal state. σ is the sigmoid function.
4.1.4 Convolutional Neural Network
Convolutional Neural Network (CNN) is an effective DL algorithm for image processing. It is inspired by the human visual nervous system [30].
CNN has two main characteristics; it can reduce high-dimensional data into small and rich data. At present, CNN is widely in face recognition, autonomous driving, security, and many other fields.
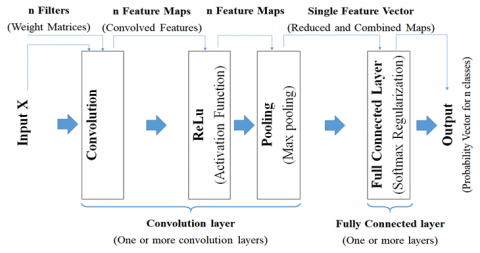
A typical CNN consists of 3 parts (as it is described in Figure 5): a convolutional layer, a pooling layer, and a fully connected layer. The convolutional layer is responsible for extracting the patterns and features; the pooling layer is used to reduce the dimensions; the fully connected layer is a classical neural network output layer it is used to give the outcome results.
Figure 5. Convolutional neural networks architecture
CNN network was designed for image processing but it also works well for temporal and special data. In addition, it is applied in classification and regression problems; It uses local connectivity between neurons (each neuron is connected with only the nearest neurons of the next layer), which allows significantly reduces the total number of parameters in the network [31].
4.2 Methodology
Since the appearance of the COVID-19 pandemic in Morocco in March 2020, the authorities have taken the necessary measures and precautions to curb its spread. However, the epidemic curve in Morocco has seen these last days an increase reaching a high number of infections and deaths. To this end, this current work treats the COVID-19 data from its first appearance in Morocco to build four predictive models based on the presented ML and DL models. These models predict the incoming epidemic situation to be ready against this crisis, confront the pandemic contributing factors, and stop the Covid-19 outbreak.
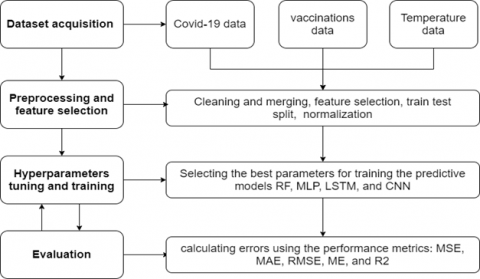
This section explains the principal steps followed to train our predictive models which are: Data acquisition, feature selection, Hyperparameters tuning and models training, and performance metrics for error evaluation. The flowchart in Figure 6 illustrates these steps clearly.
Figure 6. The Flowchart of our proposed multistep approach for Covid-19 prediction
4.2.1 Data acquisition
To build our models, we have used three different datasets; the first one, from the European Center for disease prevention and control [32], reports the Covid-19 data of Moroccan cases and deaths from March 2020 to 29 August 2021. The second one is available in the reference [33]; it gives the number of vaccinations administered, first and second doses administered, daily vaccination rates, and population-adjusted coverage. And the last one contains the weather conditions data in the different regions of Morocco, obtained from the Visual Crossing website [34], in the period from March 2020 to August 2021.
4.2.2 Pre-processing and feature selection
In this step, we have first cleaned and merged the three datasets. We have then selected the most influenced features on the coronavirus spread. The features are presented as follows:
After selecting the necessary features, we split the dataset into two subsets: 80% of the training set and 20% of the testing set. Then, we use the MinMax scaler (described in equation 8) to normalize these two subsets and make them all between 0 and 1 values. The normalization objective is to avoid that a feature dominating others in the training phase.
For the mutant strains feature and the confinement/deconfinement feature are categorical values, we have used a label encoder to transform them to classes before the normalization so that the DL algorithms don't treat them as continuous values.
$z=\frac{x-\min (x)}{\max (x)-\min (x)}$ (8)
4.2.3 Hyperparameters tuning and training
MLP, CNN, and LSTM algorithms are known for their high number of hyperparameters that should be tuned multiple times to find the best and optimal ones. Table 4, shows the best hyperparameters values found after tuning our models.
Table 4. Hyperparameters architecture of the proposed models: RF, CNN, MLP, and LSTM for COVID-19 prediction
|
Models |
RF |
CNN |
MLP |
LSTM |
|
Kernel-1D |
- |
2 |
- |
- |
|
Max Pooling-1D |
|
1 |
- |
- |
|
Layers |
- |
1 |
|
3 |
|
Fully Connected Layers |
- |
2 of 11 and 14 cells |
4 of 100 cells |
2 |
|
Filters |
- |
373 |
- |
- |
|
Epochs |
- |
50 |
50 |
50 |
|
Activation Function |
- |
ReLu |
ReLu |
ReLu |
|
Dropout function |
- |
0.2 |
0.25 |
0.25 |
|
Optimizer |
- |
Adam |
Adam |
Adam |
|
Batch Size |
- |
1 |
1 |
1 |
|
number of trees |
100 |
- |
- |
- |
|
samples |
2 |
- |
- |
- |
|
Leaf size |
1 |
- |
- |
- |
The activation function used in CNN, LSTM, and MLP is the Rectified Linear Function (ReLu) simple and performant. It returns the main value if it is positive and 0 if it is null or negative.
Concerning optimization algorithm, we opted for the Adam optimizer that is an extension of stochastic gradient descent. It is widely used in DL because it helps the model to achieve good results quickly. Empirical research demonstrates that Adam outperforms other stochastic optimizers [35].
We have also used the Dropout function to avoid overfitting models. It randomly assigns some hidden units to 0 at each update of the training phase.
4.2.4 Performance metrics
To evaluate the performance of our predictive models, we use five metrics Mean squared error (MSE), Mean absolute error (MAE), Root mean squared error (RMSE), Max error (ME), normalized root mean squared error (NRMSE), and R squared (R2) described respectively in Eqns. (9)-(14).
$M S E=\frac{1}{n} \sum_{j=1}^{n}\left(y_{j}-\hat{y}_{j}\right)^{2}$ (9)
$M A E=\frac{1}{n} \sum_{j=1}^{n}\left|y_{j}-\hat{y}_{j}\right|$ (10)
$R M S E=\sqrt{\frac{1}{n} \sum_{j=1}^{n}\left(y_{j}-\hat{y}_{j}\right)^{2}}$ (11)
$M E=\operatorname{Max}_{1 \leq j \leq n}\left|y_{j}-\hat{y}_{j}\right|$ (12)
$R 2=1-\left(\frac{S S r e s}{S S t o t}\right)$ (13)
$N R M S E=\left(\frac{R M S E}{\max (y)-\min (y)}\right)$ (14)
MAE gives the average errors over the test set considering the absolute differences between the predicted and actual values. MSE considers the average of the squared differences between the predicted and actual values. RMSE is the square root of the average of squared differences between predictions and actual values. These three metrics represent the average of errors in the same scale of the outcome contrary to NRMSE and R2. NRMSE expresses the average of errors on a scale between 0 and 1 because it is normalized by the difference between the maximum and the minimum of the desired target. The R2 ranges from 0 to 1. The closer to 1 it is, the better the model is where it describes the model fitting efficiency.
In this section, we present the results of our suggested models, namely RF, MLP, CNN, and LSTM of COVID-19 prediction in Morocco. Table 5 presents the results using the performance metrics MSE, RMSE, MAE, R2, and NRMSE. As we have mentioned, those models are used as multistep time-series regressors (feed by seven days of inputs data to predict the new deaths and infected cases for the seven incoming days). The results show that all the models approximately give the same quality of performance. RF reached an R2 of 0.98 and an NRMSE of 0.02 on the training data, but on the testing set, those indicators failed to 0.89 and 0.05 for R2 and NRMSE respectively. We didn’t use any regularization method to avoid the overfitting risk because there is not yet a well-established regularization procedure of decision trees in the literature. On the contrary, MLP, LSTM, and CNN are showing good fitting since they apply a dropout function to ignore some units and avoid overfitting. MLP and CNN models have typically the same quality of prediction giving an NRMSE of 0.05 for the training phase and 0.06 in the validation phase in the prediction of both outputs’ new deaths and new cases. LSTM also gave good results but a little worst compared to MLP and CNN.
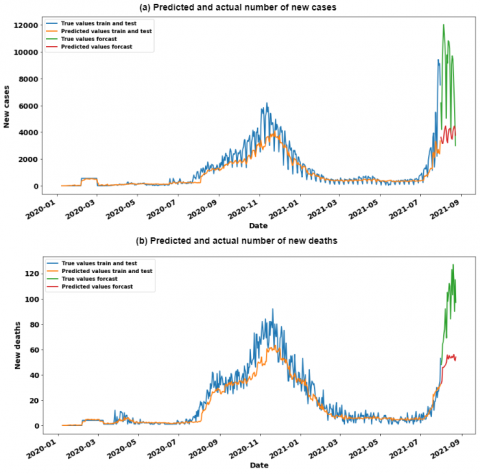
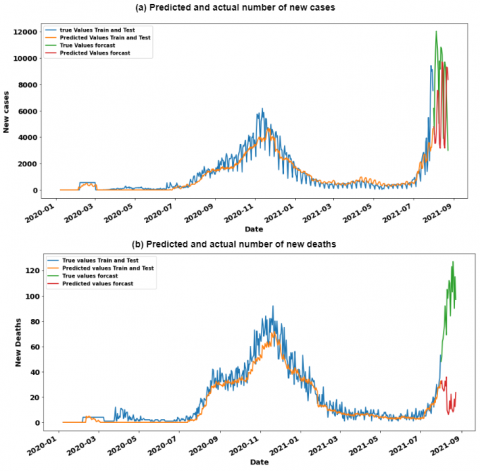
To illustrate the prediction results clearly, Figures 7, 8, 9, and 10. The orange and blue lines show the real epidemic values of the new cases and deaths versus the predicted ones during the test process by RF, MLP, LSTM, and CNN respectively. The green and red lines show the true values of the real development of the epidemic during the last week and the predicted values using the trained models.
Table 5. Results of COVID-19 new cases and deaths prediction in Morocco using the performance metrics MSE, RMSE, MAE, R2, Max Error, and NRMSE
|
Algorithms |
MSE |
RMSE |
MAE |
R 2 |
Max Error |
NRMSE |
|
|
RF New cases |
Training |
36063.34 |
189.90 |
94.91 |
0.98 |
1992.36 |
0.02 |
|
Test |
204354.44 |
452.06 |
231.85 |
0.89 |
4329.98 |
0.05 |
|
|
RF New deaths |
Training |
4.03 |
2.01 |
1.25 |
0.99 |
11.75 |
0.02 |
|
Test |
25.38 |
5.04 |
3.35 |
0.94 |
23.20 |
0.05 |
|
|
MLP New cases |
Training |
185041.8 |
430.16 |
258.82 |
0.91 |
3372.85 |
0.05 |
|
Test |
259219.87 |
509.14 |
278.04 |
0.87 |
4852.82 |
0.05 |
|
|
MLP new deaths |
Training |
24.95 |
4.99 |
3.56 |
0.94 |
21.27 |
0.05 |
|
Test |
29.88 |
5.47 |
3.90 |
0.93 |
22.98 |
0.06 |
|
|
LSTM new cases |
Training |
289936.59 |
538.46 |
310.92 |
0.85 |
5106.43 |
0.06 |
|
Test |
225161.36 |
474.51 |
292.77 |
0.89 |
4022.11 |
0.05 |
|
|
LSTM new deaths |
Training |
28.80 |
5.37 |
3.77 |
0.93 |
22.80 |
0.06 |
|
Test |
25.15 |
5.01 |
3.47 |
0.94 |
24.23 |
0.05 |
|
|
CNN New cases |
Training |
191398.96 |
437.49 |
264.12 |
0.90 |
3737.41 |
0.05 |
|
Test |
254523.62 |
504.50 |
284.08 |
0.87 |
4470.61 |
0.05 |
|
|
CNN New deaths |
Training |
23.78 |
4.88 |
3.33 |
0.95 |
22.42 |
0.05 |
|
Test |
27.40 |
5.23 |
3.54 |
0.94 |
23.73 |
0.06 |
|
Table 6. Results of COVID-19 new cases and deaths prediction in Morocco (when only the COVID-19 were applied) using the performance metrics MSE, RMSE, MAE, R2, Max Error, and NRMSE
|
Algorithm |
MSE |
RMSE |
MAE |
R 2 |
Max Error |
NRMSE |
|
|
RF New cases |
Training |
40480.67 |
201.20 |
98.17 |
0.98 |
2561.05 |
0.02 |
|
Test |
194631.00 |
441.17 |
225.84 |
0.90 |
3910.23 |
0.05 |
|
|
RF New deaths |
Training |
3.96 |
1.99 |
1.26 |
0.99 |
10.38 |
0.02 |
|
Test |
25.43 |
5.04 |
3.35 |
0.94 |
22.46 |
0.05 |
|
|
MLP New cases |
Training |
228410.83 |
477.92 |
270.58 |
0.88 |
4548.83 |
0.05 |
|
Test |
262280.91 |
512.13 |
273.24 |
0.86 |
3809.33 |
0.05 |
|
|
MLP New deaths |
Training |
25.94 |
5.09 |
3.24 |
0.94 |
26.06 |
0.06 |
|
Test |
26.43 |
5.14 |
3.37 |
0.94 |
21.53 |
0.06 |
|
|
LSTM New cases |
Training |
337685.18 |
581.11 |
386.38 |
0.83 |
4527.82 |
0.06 |
|
Test |
440108.24 |
663.41 |
367.29 |
0.77 |
5486.60 |
0.07 |
|
|
LSTM New deaths |
Training |
29.07 |
5.39 |
3.82 |
0.94 |
23.64 |
0.06 |
|
Test |
33.60 |
5.80 |
4.23 |
0.92 |
20.00 |
0.06 |
|
|
CNN New cases |
Training |
221726.66 |
470.88 |
265.78 |
0.89 |
3850.45 |
0.05 |
|
Test |
276897.75 |
526.21 |
281.26 |
0.85 |
4081.91 |
0.06 |
|
|
CNN New deaths |
Training |
27.76 |
5.27 |
33.42 |
0.94 |
24.39 |
0.06 |
|
Test |
26.77 |
5.17 |
3.45 |
0.94 |
23.36 |
0.06 |
|
Figure 7. RF curves of prediction results and actual values of new deaths and new cases
Figure 8. MLP curves of prediction results and actual values of new cases and new deaths
Figure 9. LSTM curves of prediction results and actual values of new deaths and new cases
Figure 10. CNN curves of prediction results and actual values of new deaths and new cases
The four curves typically give the same trend of predictions, where they suit the tendency of the real values, but they cannot reach the high peaks. This behavior is explained by the lack of these high occurrences. In other words, the great values of deaths and infected values somewhat appear then the models consider them as outliers; as it has already known ML and DL models cannot learn these kinds of rare data.
For the last week's forecast by using the trained models, the curves of the new cases are close to the real values; but the forecasted values of the deaths are not approaching the real values, and this is due to the high peaks of numbers that were never reached in the training and testing sets. In other words, the trends of the real COVID-19 deaths values are increasing and changing at a high rate, which was never attained from the beginning of the epidemic.
To prove the efficiency of our proposed models and the usefulness of the selected features, we have tested the four models RF, MLP, LSTM, and CNN using only the COVID-19 data and the confinement/deconfinement feature without using the vaccination and weather features. The models were trained with the same utilized architectures presented in Section 4. The obtained results are presented in Table 6.
As we can see, the prediction errors MSE, MAE, and RMSE for the models LSTM, MLP, and CNN are increasing in the training and test for both the new cases and deaths outputs. For the model RF, the MSE, MAE, and RMSE errors are increasing for the new cases train and test. Also, the R squared values are worst compared to our proposed models. Thus, these results perceive that the utilized features of vaccinations and weather conditions help the models to learn more details and information about the COVID-19 development.
In short, the strength of our proposed models is presented in two well-defined strategies. The first one is the multistep architecture that allows them to learn the time-series behaviors and nature of the data, and the second one is the input features containing two important factors that are weather conditions and vaccinations; Moreover, our models can predict several outputs (new cases and new deaths) at the same time with very good prediction accuracy.
This paper is an ML and DL algorithms investigation, namely RF, MLP, LSTM, and CNN, for COVID-19 outbreak prediction. The proposed models are based on a multistep/multioutput architecture; it feeds the model with seven days of inputs to predict the next seven days' outputs. The inquired features of vaccinations and weather conditions are described and analyzed in the context of COVID-19 spread; correlations and preview graphs are illustrated to show the dependencies of these factors. Our forecasting approach gives two interesting COVID-19 outcomes that are the number of new cases and deaths. After examining the models using multiple metrics, we found that the multistep/multioutput architecture outperforms the other models. The proposed approach will constantly forecast the epidemic development by considering other factors such as the number of vaccinations, weather conditions, the mutant strains. However, we think that finding the data of other factors such as information about mutant strains could help to get better results. Finally, we believe that this work can also be helpful to forecast and anticipate other pandemic situations. As future work, we will implement further deep learning models adapted to time-series forecasts for a time horizon longer than seven days with good prediction accuracy.
This paper was written within the scope of a COVID-19 project supported by the supervisory ministry MENFPESRS and the CNRST of Morocco to prevent and forecast the spread of the COVID-19 pandemic.
[1] WHO. (2020). COVID-19 Public Health Emergency of International Concern (PHEIC) Global Research and Innovation Forum: Towards a Research Roadmap. https://digitallibrary.un.org/record/3859866
[2] WHO CORONAVIRUS (COVID-19) DASHBOARD. WHO Coronavirus (COVID-19) Dashboard with Vaccination Data. https://covid19.who.int/.
[3] Dal Molin Ribeiro, M.H., da Silva, R.G., Mariani, V.C., Coelho, L. (2020). Short-term forecasting COVID-19 cumulative confirmed cases: Perspectives for Brazil. Chaos, Solitons & Fractals, 135: 109853. https://doi.org/10.1016/j.chaos.2020.109853
[4] Ballı, S. (2021). Data analysis of Covid-19 pandemic and short-term cumulative case forecasting using machine learning time series methods. Chaos, Solitons, and Fractals, 142: 110512. https://doi.org/10.1016/j.chaos.2020.110512
[5] Zhan, C.J., Zheng, Y.F., Zhang, H.J., Wen, Q. (2021). Random-forest-bagging broad learning system with applications for COVID-19 pandemic. IEEE Internet of Things Journal, 8(21): 15906-15918. https://doi.org/10.1109/JIOT.2021.3066575
[6] Namasudra, S., Dhamodharavadhani, S., Rathipriya, R. (2021). Nonlinear neural network based forecasting model for predicting COVID-19 cases. Neural Processing Letters. https://doi.org/10.1007/s11063-021-10495-w
[7] Saba, A.I., Elsheikh, A.H. (2020). Forecasting the prevalence of COVID-19 outbreak in Egypt using nonlinear autoregressive artificial neural networks. Process Safety and Environmental Protection, 141: 1-8. https://doi.org/10.1016/j.psep.2020.05.029
[8] Braga, M., Fernandes, R., de Souza Jr, G.N., da Rocha, J.E.C., Dolácio, C.J.F., Tavares Jr, I., Pinheiro, R.R., Noronha, F.N., Rodrigues, L.L.S., Ramos, R.T.J., Carneiro, A.R., De Brito, S.R., Diniz, H.A.C., Botelho, M., Vallinoto, A.C.R. (2021). Artificial neural networks for short-term forecasting of cases, deaths, and hospital beds occupancy in the COVID-19 pandemic at the Brazilian Amazon. PLOS ONE, 16(3): e0248161. https://doi.org/10.1371/journal.pone.0248161
[9] Devaraj, J., Elavarasan, R.M., Pugazhendhi, R., Shafiullah, G.M., Ganesan, S., Jeysree, A.K., Khan, I.A., Hossain, E. (2021). Forecasting of COVID-19 cases using deep learning models: Is it reliable and practically significant? Results in Physics, 21: 103817. https://doi.org/10.1016/j.rinp.2021.103817
[10] Elsheikh, A.H., Saba, A.I., Elaziz, M.A., Lu, S.F., Shanmugan, S., Muthuramalingam, T., Kumar, R., Mosleh, A.O., Essa, F.A., Shehabeldeen, T.A. (2021). Deep learning-based forecasting model for COVID-19 outbreak in Saudi Arabia. Process Safety and Environmental Protection, 149: 223-233. https://doi.org/10.1016/J.PSEP.2020.10.048
[11] Abbasimehr, H., Paki, R. (2021). Prediction of COVID-19 confirmed cases combining deep learning methods and Bayesian optimization. Chaos, Solitons & Fractals, 142: 110511. https://doi.org/10.1016/j.chaos.2020.110511
[12] Ayoobi, N., Sharifrazi, D., Alizadehsani, R., Shoeibi, A., Gorriz, J.M., Moosaei, H., Khosravi, A., Nahavandi, S., Chofreh, A.G., Goni, F.A., Klemes, J.J., Mosavi, A. (2021). Time series forecasting of new cases and new deaths rate for COVID-19 using deep learning methods. Results in Physics, 27: 104495. https://doi.org/10.1016/j.rinp.2021.104495
[13] Dairi, A., Harrou, F., Zeroual, A., Hittawe, M.M., Sun, Y. (2021). Comparative study of machine learning methods for COVID-19 transmission forecasting. Journal of Biomedical Informatics, 118:103791. https://doi.org/10.1016/j.jbi.2021.103791
[14] Nabi, K.N., Tahmid, M.T., Rafi, A., Kader, M.E., Haider, M.A. (2021). Forecasting COVID-19 cases: A comparative analysis between recurrent and convolutional neural networks. Results in Physics, 24: 104137. https://doi.org/10.1016/j.rinp.2021.104137
[15] Frausto-Solís, J., Hernández-González, L.J., González-Barbosa, J.J., Sánchez-Hernández, J.P., Román-Rangel, E. (2021). Convolutional neural network–component transformation (CNN–CT) for confirmed COVID-19 cases. Mathematical and Computational Applications 2021, 26(2): 29. https://doi.org/10.3390/mca26020029
[16] Sajadi, M.M., Habibzadeh, P., Vintzileos, A., Shokouhi, S., Miralles-Wilhelm, F., Amoroso, A. (2020). Temperature, humidity, and latitude analysis to estimate potential spread and seasonality of coronavirus disease 2019 (COVID-19). JAMA Network Open, 3(6): e2011834. https://doi.org/10.1001/JAMANETWORKOPEN.2020.11834
[17] Demongeot, J., Flet-Berliac, Y., Seligmann, H. (2020). Temperature decreases spread parameters of the new Covid-19 case dynamics. Biology, 9(5): 94. https://doi.org/10.3390/biology9050094
[18] Liu, X.Y., Huang, J.P., Li, C.Y., Zhao, Y.J., Wang, D.F., Huang, Z.W., Yang, K. (2021). The role of seasonality in the spread of COVID-19 pandemic. Environmental Research, 195: 110874. https://dx.doi.org/10.1016/j.envres.2021.110874
[19] Zohair, M., Atlam, E.S., Hassanien, A.E., Dagnew, G., Elhosseini, M.A., Gad, I. (2020). Association between weather data and COVID-19 pandemic predicting mortality rate: Machine learning approaches. Chaos, Solitons & Fractals, 138: 110137. https://doi.org/10.1016/j.chaos.2020.110137
[20] Ong, E., Wong, M.U., Huffman, A., He, Y. (2020). COVID-19 coronavirus vaccine design using reverse vaccinology and machine learning. Frontiers in Immunology, 11: 1581. https://doi.org/10.3389/fimmu.2020.01581
[21] Abdulkareem, N.M., Abdulazeez, A.M., Zeebaree, D.Q., Hasan, D.A. (2021). COVID-19 world vaccination progress using machine learning classification algorithms. Qubahan Academic Journal, 1(2): 100-105. https://doi.org/10.48161/qaj.v1n2a53
[22] Bandyopadhyay, S., Dutta, S., Mukherjee, U. (2021). Pharmacy impact on vaccination progress using machine learning approach. Preprints, 2021060533. https://doi.org/10.20944/preprints202106.0533.v1
[23] Berhich, A., Belouadha, F.Z., El Kassiri, A. (2021). Single and multilayer LSTM models for positive COVID-19 cases prediction. In Proceedings of the 2nd International Conference on Advanced Technologies for Humanity - ICATH, 27-34. https://doi.org/10.5220/0010426900270034
[24] Mbilong, P.M., Berhich, A., Jebli, I., El Kassiri, A., Belouadha, F.Z. (2021). Artificial intelligence-enabled and period-aware forecasting COVID-19 spread. Ingenierie des Systemes d’Information, 26(1): 47-57. http://dx.doi.org/10.18280/isi.260105
[25] Mbilong, P.M., El Kassiri, A., Belouadha, F.Z., Brahim, E.B. (2021). Predicting COVID-19 cases using CNN model. In Proceedings of the 2nd International Conference on Advanced Technologies for Humanity - ICATH, pp. 217-223. http://dx.doi.org/10.5220/0010466102170223
[26] Breiman, L. (2001). Random forests. Machine Learning, 45: 5-32. https://doi.org/10.1023/A:1010933404324
[27] Kleene, S.C. (2016). Representation of events in nerve nets and finite automata. Automata Studies. (AM-34), 34: 3-42. https://doi.org/10.1515/9781400882618-002/HTML
[28] Rumelhart, D.E., Hinton, G.E., Williams, R.J. (1986). Learning representations by back-propagating errors. Nature, 323(6088): 533-536. https://doi.org/10.1038/323533a0
[29] Hochreiter, S., Schmidhuber, J. (1997). Long short-term memory. Neural Computation, 9(8): 1735-1780. https://doi.org/10.1162/neco.1997.9.8.1735
[30] Matsugu, M., Mori, K., Mitari, Y., Kaneda, Y. (2003). Subject independent facial expression recognition with robust face detection using a convolutional neural network. Neural Networks, 16(5-6): 555-559. https://doi.org/10.1016/S0893-6080(03)00115-1
[31] Emmert-Streib, F., Yang, Z., Feng, H., Tripathi, S., Dehmer, M. (2020). An introductory review of deep learning for prediction models with big data. Frontiers in Artificial Intelligence. https://doi.org/10.3389/frai.2020.00004
[32] Ritchie, H., Mathieu, E., Rodés-Guirao, L., Appel, C., Giattino, C., Ortiz-Ospina, E., Hasell, J., Macdonald, B., Beltekian, D., Roser, M. (2020). Coronavirus Pandemic (COVID-19). Our World in Data. https://ourworldindata.org/coronavirus.
[33] Mathieu, E., Ritchie, H., Ortiz-Ospina, E., Roser, M., Hasell, J., Appel, C., Giattino, C., Rodés-Guirao, L. (2021). A global database of COVID-19 vaccinations. Nature Human Behaviour, 5(7): 947-953. https://doi.org/10.1038/S41562-021-01122-8
[34] VISUAL CROSSING. Weather Data Services | Visual Crossing [online]. https://www.visualcrossing.com/weather/weather-data-services#/login.
[35] Kingma, D.P., Ba, L.J. (2015). Adam: A method for stochastic optimization. In: 3rd International Conference on Learning Representations, ICLR 2015 - Conference Track Proceedings. https://hdl.handle.net/11245/1.505367.