Moram Vishnu Vardhana Rao* | Aparna Chaparala
© 2021 IIETA. This article is published by IIETA and is licensed under the CC BY 4.0 license (http://creativecommons.org/licenses/by/4.0/).
OPEN ACCESS
A fundamental target of strength monitoring frameworks for different structures is to analyze the condition of the structure and to assess its conceivable danger and furthermore to investigation, identification, and characterization of danger in complex structures is a critical part of auxiliary strength checking. The capacities are browsed as lexicon of time-recurrence movement and scaled variants of a basic Gaussian hypothesis work. This word reference is likewise adjusted to utilize genuine estimated information. Characterization is then accomplished by coordinating the removed damage includes in the time-frequency. In this paper, we utilize our model to assess our information mining approach for the fault checking. The balanced scratch-off and high-pass sifting strategies are consolidated adequately to take care of basic issues in numerical reconciliation signs gathered from sensors are disintegrated into direct blends of very confined Gaussian capacities utilizing the coordinating significance decay calculation. The combination exactness is enhanced and contrasted with former numerical integrators. Rough set analysis uses only internal knowledge and does not rely on prior model assumption as fuzzy set methods or probabilistic models do. In this manuscript a novel hybrid algorithm combining the features of Rough set Support vector machine (Rs-SVM) classified structures and Rough set Artificial Neural Network (Rs-ANN) classified structures are used. At long last the vertices of the structure of different types are connected and analysed by the Hybrid algorithm and furthermore to additionally enhance order execution, the data gathered from numerous sensors is incorporated utilizing a Bayesian sensor combination approach.
classification, classifiers, clustering, structure strength, integrators
Auxiliary vibration control and Basic Structure Strength Monitoring (BSSM) innovations are worried about the security of structures. The first issue in BSSM is to locate the basic danger and its area by playing out some factual example acknowledgments on the deliberate information named as feature extractions. The danger caused by ecological burdens ought to be fixed; else it will develop with time and may prompt aggregate framework disappointment [1]. Dynamic parameters like increasing velocity, velocity, and dislocating assume a vital job in deciding the structure elements. Particularly on account of scaffolds, removal is an essential data. Customary uprooting sensors are hard to introduce on extensions and can't be valuable particularly amid a seismic movement [2]. Another detecting technique is the Global Positioning System (GPS). Be that as it may, its use is influenced by terrible climate, electromagnetic commotion, Wireless systems are utilized to keep away from the incredible expense of customary conventional anxious frameworks.
The BSSM of tall structures for the most part utilizes vibration information [3]. The danger represents the progressions of auxiliary parameters, for example, the firmness and damping coefficients [4]. Just couple of research utilized an information mining procedure on BSSM. Support Vector Machine is a profoundly attractive order technique, since it offers a hyper plane that speaks to the biggest partition (or) edge between the two classes [5]. Notwithstanding, it needs to settle quadratic programming (QP) with the end goal to discover a partition hyper plane, which causes an escalated computational complicated nature.
Rough Set Theory (RST), which developed in mid 1980's, is the ongoing scientific tools which is having it's significance to information procurement and grouping through AI, Feature supportive networks, inductive thinking and so forth. One prime preferred position of RST is that it needn't bother with any sort of primer data about the example informational collection for example likelihood appropriation, measured likelihood task and so forth. A technique for decreasing ordered information is to utilize the geometric properties of SVM. In computational geometry, various calculations are known for figuring the curved structure for a limited arrangement of focuses [6]. By utilizing a nonconvex disaster work, it shapes a nonconvex SVM [7]. Be that as it may, some great properties of SVM, for instance, the most extreme edge, can't be ensured, in light of the fact that the crossing point parts of informational indexes are not fulfilled curved conditions [8].
Utilizing the RST lessens the properties for SVM activity. Rough Set Theory is one of information mining strategies which lessen the highlights from enormous quantities of information [9]. Utilizing RST needs to fabricate the choice table or the data table. The idea of Rough Set hypothesis depends on the supposition that with each object of the universe (U) there is related a specific measure of data (information, learning), communicated by methods for certain characteristics (Q) utilized for item depiction. Specifically, the choice table outlines all the potential connections between the articles (additionally called choice properties D) and the comparing descriptors (condition characteristics C) as consistent proclamations" if ..., then ..."; the forerunner condition part (if) indicates the value(s) expected by one 0 more condition traits, and the outcome choice part (at that point) determines the qualities accepted by the choice attribute(s).
Hypothesis of Rough Sets (RS) is one of such strategies, which is utilized to decipher information and handle vulnerability [10]. It prompts a one of a kind RS way to deal with handle every single such trouble like trait choice, decrease in the dimensionality and further the arrangement of pictures. This is utilized as a pre handling venture for ANN based pictures characterization. The outfit strategy is a notable procedure to upgrade the exhibition of ANN by coupling a gathering of prepared neural systems [11].
In the present work, a hybrid method for spatial image classification is proposed, which uses Rough Sets (RS) for feature selection and Artificial Neural Network (ANN) technique for image classification.
An arrangement of characterization for danger distinguishing proof strategies, as introduced by Housner et al. [1], characterizes four dimensions of danger ID, as pursues:
• Purpose that danger is there in the structure.
• Purpose of geometric area of the danger.
• Purpose of the seriousness of the danger.
• Calculation of the administration life of the structure.
The survey can be characterized for the most part as Level 1, Level 2, or Level 3 strategies in light of the fact that these dimensions are regularly related specifically to basic elements testing and demonstrating issues. Level 4 expectation is for the most part ordered with the fields of crack mechanics, weakness investigation, or basic plan appraisal and, all things considered, isn't tended to in the auxiliary vibration or modular examination [12].
Different techniques for danger recognizable proof and strength monitoring of structures dependent on changes in their deliberate unique properties are introduced in this area [13]. The strategies are ordered dependent on the sort of estimated information utilized, and additionally the procedure used to recognize the danger from the deliberate information.
A lot of research, in the fields of mechanical, material, and auxiliary designing, and flag preparing and factual examination [1], exists on procedures for deciding the nearness, type, area, and power of basic danger. A few models incorporate factual techniques [4], time-arrangement investigation [6], measurable example acknowledgment [8], impedance-based strategies [9], Fourier part match examination [10], Bayesian techniques [11], extreme value measurements [12], and support vector machines [13]. Mechanical, material, and basic strategies can give physically based danger models to depict the engendering of waves through materials [14]. Then again, flag preparing and factual investigation calculations can give viable portrayals to remove the data substance of gathered information, prompting productive and dependable frameworks for danger assumption.
Utilizing the Rough Set Theory (RST) decreases the qualities for SVM activity. Harsh Set Theory is one of information mining techniques which lessens the highlights from enormous quantities of information. Utilizing RST needs to construct the choice table or the data table.
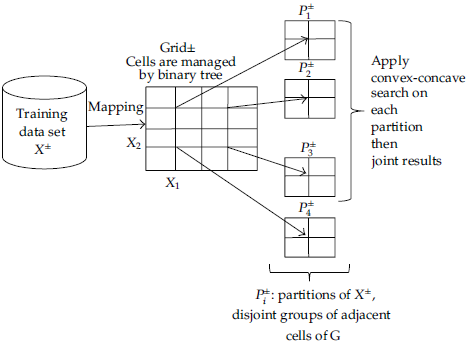
In the proposed work, two nearby extreme indications focuses are utilized to recognize the curved body Nch(x) between them. The curved weak body looking plan can be modified if the informational collection X has a uniform circulation of components in an area. Be that as it may, the circulation of an informational collection is obscure ahead of time. Figuring the curved inward body B(X) straightforwardly from X isn't fitting for preparing the SVM classifier. The Figure 1 clearly explains the dataset ore-processing model for removing noise values from the dataset.
Figure 1. Data set pre-processing
The pre-processing of data is a significant phase in the process of data mining. The term "garbage in, garbage out" applies in particular to data mining and machine learning ventures. Methods of data collection are frequently loose, leading to out-of-range and lack of meaning. Pre-processing data is an important phase in the process of data mining. The expression "dumping in, dumping out" refers to data mining and machine learning projects in particular. Methods of data collection are also openly regulated, leading to out of range values (for example, Income: –100), unlikely combinations of data (for example, Sex: Male, Pregnant: Yes), and missing data, etc. Analysis of data that have not been screened carefully for these issues will generate incorrect results, etc. Data that have not been screened thoroughly for these issues can lead to misleading results.
Support vector machine (SVM) is an exceptionally attractive characterization strategy, since it presents a hyper plane which speaks to the biggest partition (or edge) among two classes. Nonetheless, it wants to unravel quadratic programming (QP) with the end goal to discover a division hyperplane, which causes a concentrated computational multifaceted nature. A strategy for diminishing sensitive information is to utilize the geometric properties of SVM. Curved body has been connected in preparing SVM. In computational geometry, various calculations are known for registering the arched body for a limited arrangement. The increased curved structure and fast frame calculations comprise of dispensing with a few points so the issues are effortlessly explained. The Kernel function is a method for input data and processing data in the appropriate form. The "kernel" is used to control the data by setting mathematical functions that are used for Support Vector Machine. The Kernel function therefore typically transforms the training data set such that a non-linear decision surface in a higher number of dimensional areas can be translated into a linear equation. In essence, it gives the internal product a normal function dimension between two points.
Standard Kernel Function Equation is
K ({x}) = 1, if ||{x}|| <= 1
K ({x}) = 0, Otherwise
SVM algorithms use a collection of kernel defined mathematical functions. The kernel's job is to enter data and convert it into the form requested. Various SVM algorithms use various kernel function types. There may be various kinds of functions. Linear, nonlinear, polynomial, RBF, and sigmoid, for instance.
Enter sequence files, graphs, text, pictures and vectors kernel functions. The kernel function is most commonly used in RBF. Since the whole x-axis has localised and finite reactions.
Within two points in an acceptable feature space, the Kernel functions return the inner product. By defining a notion of similarity, also in very large spaces with low computational costs.
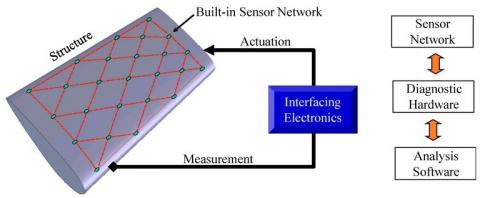
Figure 2 represents the full system of Hybrid RS-SVM &RS-ANN component which is being adjusted and a calculation is proposed for discretization. RST gets the principles and further makes the information vectors having most basic and basic highlights. This standard base in decreased arrangement is then utilized to prepare the spatial information bases.
Figure 2. Proposed framework
3.1 Accelerometer capacity with Arithmetic Integrator
Accelerometer is viewed as a solitary level of opportunity with involuntary framework. It tends to be displayed utilizing a basic mass m regularly called confirmation mass, joined to a mechanism of solidness k and a dashpot having damping coefficient c appended to base [15].
Mxr(t) + cxr(t)+kxx(t)=-mx(t)
where, x¨(t) is speeding up accelerometer and x¨r(t) is general increasing speed of confirmation mass as for the base. The accelerometer have an inclination named as balanced voltage which is equivalent to half of its capacity supply (Vdd/2). This counterbalance may fluctuate from one sensor to other. The information of this balanced mistake will expel the inclination from the increasing speed flag adequately. The accelerometer resultant flag can be depicted as
Ar(t) = kax(t) + ω(t) +q
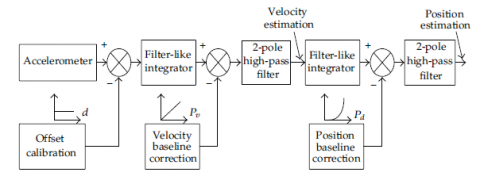
ω(t) is noise level and unsettling influence impacts on the estimation and q means the 0g counterbalance. The Figure 3 illustrates the order of the proposed numerical integrator for strength estimation.
Figure 3. Order of the proposed numerical integrator
Utilizing different pattern adjustments the low-pass channel having a little time consistent can be accomplished to surmised the perfect integrator conduct. The exchange capacity of a channel as is integrator is
$H(s)=\frac{\alpha}{t+\beta^{l}}$
Here α and β are gain and period consistent that is near zero. when β value is zero, the above framework decreases to a perfect integrator.
The perfect integrator (β=0) enhances the DC counterbalance rapidly. Then again, a huge β diminishes the stage exactness [16]. Choosing an ideal β is an exchange off issue between a minimal DC balance and a superior stage precision. Normally we select α=1. β is somewhere in the range of 0.1 and 0.001. All things considered, the main result is the 0g-counterbalance.
$A r(t+f)=\left\{\begin{array}{cl}d & \text { if } n<0 \\ x(t+n) & \text { if } n \geq 0\end{array}\right.$
Finally the counter balance quickening is represented as
P(m)= q(t)=x(t)
The above calculation can expel the unmodified DC part totally. As talked about before, there exist different wellsprings of counterbalance other than 0g-balance. All things considered, the balanced Calibration won't have the capacity to take out totally the float from speed estimation. Presently the floated benchmark pv(t) should be computed, which can be spoken to in a polynomial shape as
Prv(t) = Prv2t2 + Prv1t +Prv0
where, Prvi are the coefficients to be resolved. The accompanying advances depict the calculation utilized for Rough sets.
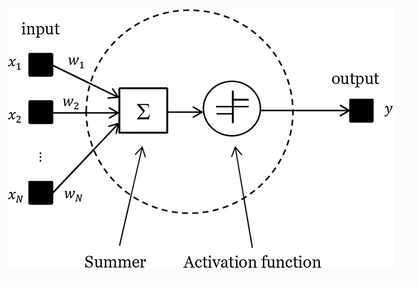
The activation function for the proposed model is indicated in Figure 4.
Figure 4. Activation function
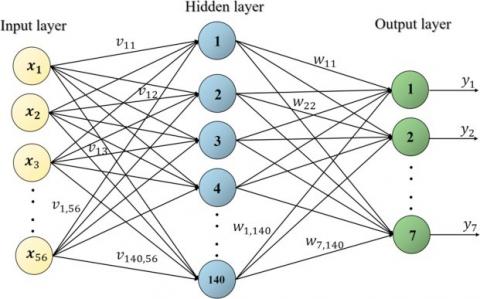
The Figure 5 indicates the model of ANN used for the monitoring of strength of the structures for improving safety levels.
Figure 5. ANN model
Step-1: Establish clusters of relevant data related to change in the structural parameters using the information gathered from the sensor.
Step-2: Input training set TS{S1,S2,.....Sn} where S is the sensor gathered data.
Step-3: Assign the weights Wi for the data Ds= 1/n.
Step-4: Identify the probability levels of sensor data gatherings.
Si(Dn) = λ* S(d)∑ Wm where m is the median of the data gathered.
Step-5: Calculate the Normalization factor with damaged values
Si(Dn) – S(W):
Step-6: Generate the structural strength based on D(Si).
Step-7: Update the sensors data frequently by repeating Step-4.
Step-8: End
In order to monitor operational and loading environments and structural responses in real time to effectively assess the structural health condition and safety and to instruct regular structural inspections and maintenance, Structural Health Surveillance is the use of modern sensing technology, communications algorithms and advanced database mining and management systems. A number of SSM long-term systems, for civil engineering structures such as large-scale bridging and high-rise buildings, have been planned and implemented worldwide over the past several decades. With these SSM systems a huge ocean is continuously obtainable in real time of knowledge related to structural reactions and behaviour. The measurement data are valuable for the early identification, evaluation and evaluation of structural irregularities and damage for organisational safety and for the timely assessment of catastrophes and extreme events. A major issue of concern is how the data on structure performance evaluation aimed at safety, reliability, longevity and sustainability are extracted from the monitoring data.
The above algorithm generates the structural strength of different buildings and then the generates the strength levels to continuously monitor the structural strength. The structural strength indicates the strength levels of the building and the strength grades indicates the strongness of the building.
3.2 Faults analysis
We expect that na accelerometers have introduced in the structures. The numerical coordination results are speed x˙a∈Rna and movement xa∈Rna. The liability, analysis indications are
X1 = xa –x ɛ Tna and X2 = x-xa ɛ Tna
We express that a destruction organizes will not ensue when
Ali < |xli|, bli and C2i < |x2i| <d2i and X1= [x11,....xn]T , X2= [x21....xn]T
where, i=1……..na and a1i,b1i,c2i,and d2iare prior well-defined constants. When no destruction occurs, we express that the things of (x1i,x2i) is +1. Then the property of (x1i,x2i) is -1. Because the accelerometers take a shot at line, the tested information are tremendous.
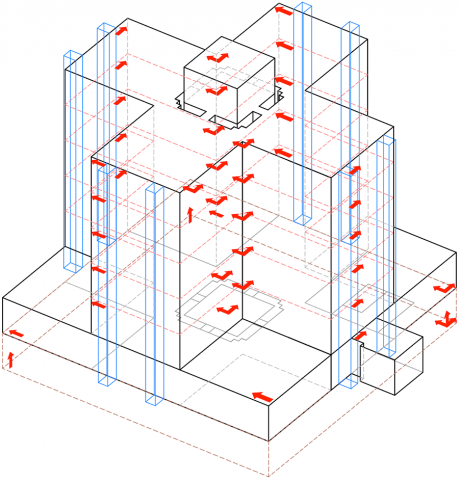
We utilize our strength monitoring system to analyze the weakness in structures and also to identify the strength of the structures. We contrast proposed method calculations with other techniques and the decreased strong structure. The proposed method is developed in MATLAB 9.2 which simulates different structures and identifies the strength levels of different structures. The table structure for checking the strength is illustrated in Figure 6 and the sensors arranged in the building is depicted in Figure 7.
Figure 6. Table structure for strength checking
Figure 7. Structure of building with sensors arranged
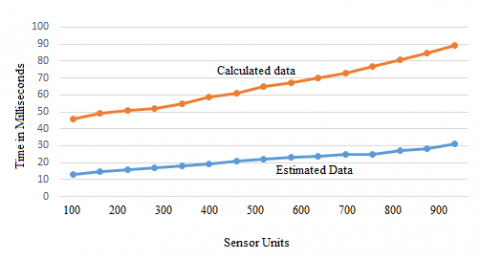
The data compression rate is depicted in Figure 8.
Figure 8. Data comparisons of estimated and calculated data
Table 1. Correlation results
|
Dataset |
hg |
Tbp |
#SV |
Accuracy |
|
DS (1000k) |
12 |
12874 |
3654 |
94.21 |
|
DS (2000k) |
16 |
26984 |
5788 |
94.68 |
|
DS (3000k) |
19 |
59984 |
8811 |
95.13 |
|
DS (4000k) |
23 |
112488 |
13524 |
95.84 |
The Table 1 considers parameters like, hg, Thp, #SV and Accuracy levels, where hg is sensor gathered data, Thp is the tensor measurement and SV is the strength vector. We initially look at how the preparation information measure influences the preparation time and grouping precision of our arched curved structure. We utilize 10K(K= 103), 50K, 100K, 200K, and 250K informational index tests. For all informational indexes, the preparation information are picked haphazardly among 80% of informational index; the rest of the information are utilized for testing informational collection. The Correlation Results are appeared in Table 1. Here 10K intends to utilize 10K information to prepare strength monitoring method.
At the point when the information measure is expanded, the preparation time is drastically expanded with SMO, while our own solitary builds a bit. In spite of the fact that the order of exactness can't be enhanced fundamentally when information estimation is expansive.
Now we compare our proposed method with LIBSVM, CSVM, and RCHSVM with 40K data set. The contrast results are shown in Table 2.
Table 2. Classification levels
|
Dataset |
hg |
Tbp |
#SV |
#BS |
Accuracy |
|
SVM |
15 |
1259 |
19874 |
5841 |
85.33 |
|
ANN |
18 |
1588 |
18652 |
- |
86.93 |
|
RCHSVM |
23 |
2013 |
12997 |
8647 |
76.85 |
|
Proposed Hybrid Method |
28 |
2415 |
8542 |
5471 |
91.24 |
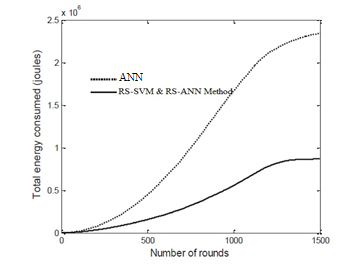
Figure 9. Energy consumption rate
The Table 2 considers parameters like, hg, Thp, #SV,#BS and Accuracy levels, where hg is sensor gathered data, Thp is the tensor measurement SV is the strength vector and BS is the neighbour sensor data relation. The proposed model is contrasted with ANN classifiers are comparisons are depicted in above table, our methodology has great order precision and preparation is altogether quicker than other ANN classifiers. The order precision is more than strong structure ANN. The total energy consumption rate is depicted in Figure 9.
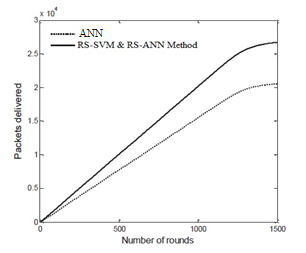
The energy consumption rate of the proposed and existing models is depicted in Figure 9. The Packet count delivered by the sensors is represented in Figure 10.
Figure 10. Packet delivery rate
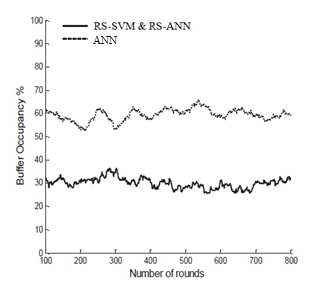
The buffer occupancy holding the data received from the sensor is depicted in Figure 11.
The prediction rate of the strength of the structures is depicted in Figure 12.
Figure 11. Buffer occupancy rate
Figure 12. Structural strength prediction rate
In this proposed work we utilize two systems for structure strength monitoring system of different structures: numerical integrator and arched curved frame arrangement. A novel method is proposed for evaluating speed and location from a quickening signal. This strategy joins the various gauge levels and the separating methods. The projected integrator can create steady and exact estimation. The RS-ANN method is used for extracting different features of a structure and RS-SVM classifier is used for the classification of structures and to identify their strength. The trial results show that the exactness of the float free integrator is expanded by including the counterbalanced crossing out channel, and our methodology has great grouping precision while the preparation is fundamentally quicker than other classifiers. The characterization exactness is more than other traditional methods. The proposed work is supportive for damage detection at an earlier stage. The proposed work can be applied for detecting any damage caused to a building structure, if its primary causes are known. Once if the primary causes are known, the information is collected using sensors and transmitted to the remote monitoring system to take decisions. As a future extension, factors apart from the distance between nodes, congestion mitigation, buffer occupancy level and fairness index can be considered to improve the network lifetime.
[1] Jahangiri, M., Najafgholipour, M.A., Dehghan, S.M., Hadianfard, M.A. (2019). The efficiency of a novel identification method for structural damage assessment using the first vibration mode data. Journal of Sound and Vibration, 458: 1-16. https://doi.org/10.1016/j.jsv.2019.06.011
[2] Ostachowicz, W., Soman, R., Malinowski, P. (2019). Optimization of sensor placement for structural health monitoring: A review. Structural Health Monitoring, 18(3): 963-988. https://doi.org/10.1177/1475921719825601
[3] Lee, K., Jeong, S., Sim, S.H., Shin, D.H. (2019). A novelty detection approach for tendons of prestressed concrete bridges based on a convolutional autoencoder and acceleration data. Sensors, 19(7): 1633. https://doi.org/10.3390/s19071633
[4] Cremona, C., Santos, J. (2018). Structural health monitoring as a big-data problem. Struct. Eng. Int., 28(3): 243-254. https://doi.org/10.1080/10168664.2018.1461536
[5] Cech, M., Davis, P., Gambardella, F. (2018). Performance of European cross-country oil pipelines–statistical summary of reported spillages in 2016 and since 1971, report no.6/18, Concawe. https://www.concawe.eu/wp-content/uploads/Rpt_21-4.pdf.
[6] Anaissi, A., Alamdari, M.M., Rakotoarivelo, T., Khoa, N.L.D. (2018). A tensor-based structural damage identification and severity assessment. Sensors, 18(1): 111. https://doi.org/10.3390/s18010111
[7] Salehi, H., Das, S., Bsiwas, S., Burgueño, R. (2019). Data mining methodology emplying artifical intelligence and a probabilistic approach for energy-efficient structural health monitoring with noisy and delayed signals. Expert Syst. Appl., 135: 259-272. https://doi.org/10.1016/j.eswa.2019.05.051
[8] Sen, D., Aghazadeh, A., Mousavi, A., Nagarajaiah, S., Baraniuk, R., Dabak, A. (2019). Data-driven semi-supervised and supervised learning algorithms for health monitoring of pipes. Mech. Syst. Signal Process, 131: 524-537. https://doi.org/10.1016/j.ymssp.2019.06.003
[9] Zhou, P., Wang, D., Zhu, H. (2018). A novel damage indicator based on the electromechanical impedance principle for structural damage identification. Sensors, 18(7): 2199. https://doi.org/10.3390/s18072199
[10] Mei, H., Haider, M.F., Joseph, R., Migot, A., Giurgiutiu, V. (2019). Recent advances in piezoelectric wafer active sensors for structural health monitoring applications. Sensors, 19(2): 383. https://doi.org/10.3390/s19020383
[11] Alkayem, N.F., Cao, M., Zhang, Y., Bayat, M., Su, Z. (2018). Structural damage detection using FE model updating with evolutionary algorithms: A Survey. Neural Comput. Appl., 30: 389-411. https://doi.org/10.1007/s00521-017-3284-1
[12] Umar, S., Bakhary, N., Yassin, A.Y.M. (2018). Response surface methodology for damage detection using frequency and mode shape. Measurement, 115: 258-268. https://doi.org/10.1016/j.measurement.2017.10.047
[13] Zhang, Y., Kurata, M., Lynch, J.P. (2017). Long-term modal analysis of wireless structural monitoring data from a suspension bridge under varying environmental and operational conditions: system design and automated modal analysis. J Eng Mech., 143(4). https://doi.org/10.1061/(asce)em.1943-7889.0001198
[14] Moschas, F., Stiros, S. (2011). Measurement of the dynamic displacements and of the modal frequencies of a short-span pedestrian bridge using GPS and an accelerometer. Engineering Structures, 33(1): 10-17. https://doi.org/10.1016/j.engstruct.2010.09.013
[15] Jindal, A., Liu, M. (2012). Networked computing in wireless sensor networks for structural healthmonitoring. IEEE/Acmtransactions on Networking, 20(4): 1203-1217. https://doi.org/10.1117/12.880023
[16] Kalyani, S. (2011). Classification and assessment of power system security using multiclass SVM. IEEE Transactions on Systems, Man, and Cybernetics C, 41(5): 753-758. https://doi.org/10.1109/tsmcc.2010.2091630