Seiyedeh Maryam Hosseiny* | Akram Isvand Rahmani | Morad Derakhshan | Robabe Fatahizadeh
© 2021 IIETA. This article is published by IIETA and is licensed under the CC BY 4.0 license (http://creativecommons.org/licenses/by/4.0/).
OPEN ACCESS
With the advent of technology and the Internet, security concerns seem to increase every day. and as the technology has become increasingly sophisticated, concerted and cooperative attacks have risen too. In such circumstances, there is a pressing need for software tools that can detect a wide range of infiltrations. So far, suggestions have been made by researchers for the intrusion detection system. However, more research is still needed to improve its accuracy. Therefore, the proposed method detects and classifies a series of distributed denial of service attacks using the grasshopper optimization algorithm (GOA). In this way, after reducing the feature by the grasshopper optimization algorithm (GOA) and finding the optimal features, we classify the attacks as normal and abnormal by using the Nearest Neighbor Classifier (KNN). Experiments have been performed on the NSL-KDD datasetThe results show that the proposed method has a significant advantage over PSO, GA, and ACO in accuracy and speed of identifying attacks.
denial of service attacks, grasshopper optimization algorithm, Nearest Neighbor Classifier
With the rise of the Internet usage, its relevant problems have also increased. Besides, infiltration technology has led to complex methods such as coordinated and participatory attacks. In such situations, there is an urgent need for software that could automatically make use of a wide range of "Detect intrusion" systems. These network guards must be able to detect and defend the system efficiently.
Digital security tools can be considered as equivalent to physical security tools. For example, if we think of the information we have on our network as confidential documents in a home, firewalls have the role of locked doors. In fact, locked doors have the roles of deterrence and intrusion prevention, but they are not alert in the event of an intrusion, but the role of intrusion detection systems is like home-based alert systems that do not prevent intrusion if they occur. But they are warning the system that infiltration is in progress.
In fact, a secure network is a set of systems that complement each other and work together to secure a network. As we have seen, it was the firewall that prevented intrusion, but the system was tasked with alerting intrusion detection systems. Therefore, the duties of these members are complementary and harmonious with each other [1]. The purpose of systems is not to detect intrusions, but to detect intrusions and, of course, the weaknesses of the overall system and report them to the system administrator. In fact, components like firewalls and intrusion detection systems complement each other to maintain security and prevent intrusion into a system. But intrusion detection systems are the first line of defense against potential intrusions.
By collecting network traffic data and using feature selection methods, only feature vectors containing information are considered as necessary. Data collected at this stage are analyzed in order to be determined whether they are normal or abnormal. In this step, different methods are applied to detect intrusion. At the end, the reaction of intrusion detection system alerts the system administrator the occurrence and the nature of an attack. Besides, the intrusion detection system also helps control the attack by closing the network port or destroying processes.
Due to the fact that in the data set of intrusion detection systems we are faced with a large number of features, the decrease in dimensions can make analysis easier, increase separator performance, and eliminate duplicate and irrelevant information. Data volume reduction is possible in two ways. First, reducing the number of features, which leads to the removal of features with less emphasis on intrusion detection system. Second, reducing the number of instances which in turn lead to the deletion of records and instances and optimize accuracy of the intrusion detection system.
An examination of the Intrusion Detection Systems dataset shows that many features are unhelpful, ineffective in attack scenarios, or unrelated. Therefore, the removal of inappropriate features from the feature set is introduced as a viable solution to reduce the dataset of intrusion detection systems. The problem in selecting a subset of attributes is to identify and select a useful subset of attributes from the initial dataset. In this paper, the method of dimensionality reduction and its effect on penetration detection are investigated. The purpose of this research is to improve the classification accuracy, increase the detection rate of false alarms, and reduce false alarms in intrusion detection systems by using a new approach of grasshopper optimization algorithm (GOA) to reduce feature dimensions and nearest neighbor (KNN) [2]. The important point is that no such algorithm has been implemented for the intrusion detection system so far, and we will describe this algorithm in more detail in the next section [3]. The paper is organized as follows:
The second part is an overview of known methods of dimensionality reduction. In the third section, we investigate the effect of grasshopper optimization algorithm on dimensionality detection systems. The fourth section evaluates the methods examined along with the results table and comparisons and their analysis and concludes with the fifth section.
In general, various investigations into intrusion detection systems have been carried out in different fields and in the same way as in intrusion detection research. This article is about intrusion detection methods. This is the core area of the intrusion detection system, so some of the challenges that arise in this area and subsequent research in each case are mentioned. The K - Nearest Neighbor algorithm is used for the unobservable categorization of data [1].
In this study, the multilayer method was employed. The standard deviation was calculated so that the dimensions of the data were reduced for all data features.
A threshold is set for each feature for all the features of the dataset. A threshold is set for each feature. Based on the number of attributes of a record (whose values have exceeded the specified threshold for that attribute), it is decided that the record is a normal or outlier data. Then, with the K-NN algorithm, the new data is subdivided into either normal or outlier data.
Using a genetic algorithm, Paliwal and Gupta [4] proposed an intrusion detection system in the learning phase. They used the network audit data to generate intrusion detection rules, the highest fit function, and the best set of intrusion detection rules in the world. The genetic algorithm works on a unique chromosome, and the group of chromosomes evolves into a quality population. This test is performed by the NSL-KDD dataset.
Aghdam and Kabiri [5] used the ant colony algorithm method for the infiltration detection system. Therefore, this optimization method was applied to reduce the dimensions of the features. The accuracy of this algorithm was 98.9%. One of the advantages of this algorithm is low computational complexity. Experiments were performed on the NSL-KDD dataset.
Manekar and Waghmare [6] presented the integration of PSO (Particle Swarm Optimization) and SVM (Support Vector Machine) SVM. The PSO algorithm optimizes the C (cost) and g (gamma), respectively. Accordingly, the SVM method had higher accuracy. Experiments were performed on the NSL-KDD dataset.
Catherine et al. [7] proposed an Intrusion Detection System using a partial decision tree and correlation feature selection algorithm. In this paper, an efficient correlation-based decision tree algorithm is proposed. The proposed method for the correlation feature selection involves the selection of features and partial decision tree for the classification of normal and abnormal packages. The results of this study provide 94.58% better results than the existing algorithms. And they proposed decision tree method. This method used the correlation attribute selection algorithm. Feature reduction was performed using a correlation algorithm, which had a relatively proper performance in increasing the accuracy of decision tree classification. Therefore, this method has an accuracy of 94.58%.
Fan et al. [8] proposed a method to automatically detect malicious code to protect legitimate users against attacks. There are counter-attack software products that use diagnostic signatures to protect against distributed denial of service attacks. This method was used to detect new malware. It uses the Equation and classification of the K-Nearest Neighborhood (KNN) to identify incompatible samples. Experimental results in this method showed that this method has a high potential to detect new malware.
Rai et al. [9] designed the network infiltration detection system using the decision tree. The results show that using the proposed method; the C4.5 decision tree had 98% accuracy.
The method was tested using various classifiers such as decision trees and SVM by Goeschel [10].
simple Bayesian networks. The results showed that the proposed intrusion detection system with a 48.87% accuracy rate and 35.10% false-positive false alert rate performed better than any k-nearest neighbor algorithm in detecting network traffic anomalies.
Bejan [11] presented an intelligent network intrusion detection framework using an alternate decision tree. The basic idea is that the alternate decision tree is divided into intrusion data and categorization of types of distributed denial of service attacks. The proposed method improves the detection rate of intrusive attacks.
In most infiltration detection methods, the entire parameters are used to evaluate and identify malicious patterns, while some are irrelevant and redundant [12].
Mirza et al. [13] designed the method using genetics and improved the infiltration detection system. In this algorithm, various weaknesses were eliminated using operators such as mutations and intersections, and many new and old attacks could be prevented using artificial intelligence. Finally, it tested and simulated a penetration detection system using a genetic algorithm and standard NSL-KDD data sample. The results of the proposed method show the accuracy of Naïve Bayes classifier with decreasing time and minimum number of features.
Concerning the feature selection problem, it is necessary to adopt an appropriate algorithm for feature selection when the features outnumber and cause saturation. Therefore, other methods are not sufficiently accurate, and the grasshopper algorithm has been able to provide the optimal global solution to overcome the problems of other meta-heuristic algorithms.
3.1 Grasshopper optimization algorithm
Grasshopper optimization algorithms mimic the behavior of grasshoppers in nature, so the grasshopper flight path is affected by three components shown by Eq. (1):
$X_{i}=S_{i}+G_{i}+A_{i}$ (1)
In Eq. (1), the objective is to obtain the ith position of the locust indicated by $X_{i}$, $S_{i}$ indicates social interaction and $A_{i}$ is the direction of the wind. Given that the locust optimization algorithm mimics the swarming behavior of locusts in nature, locust behavior can be affected by three Factors, which are pointed out in Eq. (1). Therefore, social interaction is achieved through Eq. (2).
$S_{i}=\sum_{j=1, i \neq i}^{N} s\left(d_{i j}\right) \hat{d}_{i j}$ (2)
In Eq. (2), N is the number of locusts, dij represents the distance between ith and jth locusts, and social interaction is calculated by S, shown in Eq. (3). Si in fact, social interaction is the locust ith.
$s(r)=f e^{\frac{-r}{l}}-e^{-r}$ (3)
In Eq. (3), l is the scale of the gravity intensity's length, and f represents the gravity intensity [14]. The s function shows how this function can affect social interaction (attraction and repulsion).
$G_{i}=-g \widehat{e}_{g}$ (4)
In Eq. (4), $\widehat{e_{g}}$ is the unit vector and g is the gravitational constant of the earth. In the last step, component A represents the horizontal force of the wind, which is indicated by Eq. (5).
$A_{i}=u \widehat{e_{w}}$ (5)
In Eq. (5), $\widehat{e_{w}}$ is a unit vector that is constant in the direction of the wind and u. Due to the lack of wings in baby locusts, their movement changes with the wind direction, which is rewritten as Eq. (6), the result of Eq. (1), Therefore, only formulas have been substituted in this equation.
$X_{i}=\sum_{j=1, j \neq i}^{N} s\left|x_{i}-x_{j}\right| \frac{x_{j^{-}} x_{i}}{d_{i j}}-g \widehat{e_{g}}+u \widehat{e_{w}}$ (6)
Given that baby locusts do not fly, since their location is not at the level of inhalation, an amplification algorithm must be developed to be calculated by Eq. (7):
$X_{i}^{d}=c\left(\sum_{j=1, j \neq i}^{N} c \frac{u b_{d}-I b_{d}}{s} s\left(\left|x_{j}^{d}-X_{i}^{d}\right|\right)\right) \frac{x_{j}-x_{i}}{d_{i j}}+\widehat{T}_{d}$ (7)
where ubdis the upper bound in the dth dimension, and lbd is the lower bound in the dth dimension. Td is the value of the dth dimension in the target (best solution found so far), and the coefficient reduces the comfort zone proportional to the number of iterations and is calculated by Eq. (8) as follows:
In Eq. (7), ubd and lbd are the upper and the lower boundaries after dth. The Td value is the best solution ever found. Now the calculation of the comfort zone is carried out as Eq. (8).
$c=\operatorname{cmax}-l \frac{\operatorname{cmax}-\mathrm{cmin}}{L}$ (8)
In Eq. (8), Cmax and Cmin represent the maximum and minimum values of the current iterations, and L represents the maximum number of iterations (Cmax=1 and Cmin=0.00001).
In Eq. (8), to balance exploration and exploitation, parameter C must be reduced in proportion to the number of iterations. This mechanism increases the number of stays in operation. The coefficient C reduces the comfort zone in proportion to the number of stays and is calculated as follows.
According to what is mentioned in relations 1 to 8, the GOA algorithm is used to reduce the dimensions in the intrusion detection system, which is described below. It should be noted that such an algorithm has not been used to reduce the dimensions of intrusion detection.
3.2 Proposed algorithm
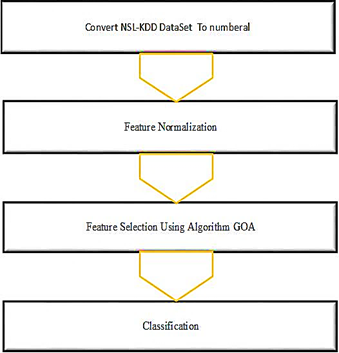
The proposed method generally consists of three stages: pre-processing, processing, and post-processing. In the pre-processing section to normalize the NSL-KDD dataset, the processing includes the Grasshopper Optimization Algorithm (GOA), and the post-processing includes the detection and classification of attacks by the KNN classifier. Figure 1 shows the general trend of the proposed method.
Figure 1. The proposed method
As shown in Figure 1, the first step is to convert non-numeric data to numeric. Then, feature normalization is performed on the data. In the next step, feature reduction is done by GOA and features are sorted according to the categories.
3.3 Pre-processing
Pre-processing involves clearing inconsistencies or noise from the data and combining or deleting redundant inputs. Preprocessing also involves converting data set properties to numerical data and storing them in a readable format because the k tool only works with numerical data. Alphabetical data were converted to numeric values starting at 0.001, 0.002. Smaller values (instead of 0, 2) were used to ensure that they did not affect the calculations [7].
Now, in the last step, the numerical data in [0,1] are calculated and normalized, which is shown in Eq. (9):
$\hat{x}=\frac{x_{i}-x_{\min }}{x_{\max }-x_{\min }}$ (9)
In Eq. (9), the initial value is denoted by $x_{i}$, also $x_{\min }$ and $x_{\max }$ represent the smallest and largest values. Finally, $\hat{x}$ represents the value of the new attribute.
In the proposed method, linear normalization makes features become homological and congruent, leading to increase in the classification accuracy.
3.4 Feature selection using GOA
As features increase, they can make classification work more difficult to increase accuracy. For this reason, a high-dimensional feature-based solution to the optimization algorithm is proposed, the Grasshopper optimization algorithm [13]. Tournament selection is a simple tool for implementing the selection mechanism [15].
In the competitive process, n solutions are randomly selected in the population. After this stage, n is placed in front, and the winner is selected in this tournament. Random numbers in this population are in [0,1]. If your probability is higher than 0.5, there is a suitable solution; it may be vital. Otherwise, it is considered a weak solution [16].
In method, Ahmed et al. [16] have presented a solution based on the feature reduction vector so that 1 indicates that the relevant feature has been selected, and 0 indicates that the feature has not been selected. Feature reduction by meta-heuristic algorithms has two main objectives: minimizing attribution and higher accuracy for classification.
However, each solution is calculated more accurately by the fertility function, which depends on the classification accuracy. Therefore, to calculate the fitness function, Eq. (10) is used:
$\text { fitness }=\alpha \gamma_{R}(D)+\beta \frac{|R|}{|N|}$ (10)
In Eq. (10), the classification error rate is shown by γ_R(D) as used in the proposed KNN classification method, |R|A is a subset of selected features, and |N| Shows all selected features. Besides, $\alpha$ and $\beta$ show the importance of the feature, respectively, is considered as 0 and $\beta=(1-\alpha)$ [17].
In the Grasshopper Algorithm, the operation can improve the results using the local search algorithm around the best-known solution, such as Eq. (8). According to Eq. (7), one can improve the exploration capability by using different selection mechanisms such as tournament selection [18].
This means that the tournament selection method provides more opportunity for poorly chosen solutions by operation search based on selective pressure that improves the grasshopper algorithm's ability to vary [18].
Finally, what can be summarized in the proposed method for intrusion detection data is done after pre-processing for data normalization. Also, we employed the Grasshopper optimization algorithm to select the best features and reduce the features. Using the cluster closest to the KNN neighborhood, we classified the data as normal or abnormal. It should be noted that such a method has not yet been performed on the intrusion detection network [18].
3.5 Classification
Classification is done in this work by KNN, Decision Tree, SVM algorithms.
3.5.1 k-Nearest Neighbors (k-NN)
K-Nearest Neighborhood (KNN) is a case study method that is one of the simplest machine learning algorithms known as the K-Near Neighborhood method. In this algorithm, a sample is categorized by the majority vote of its neighbors, and this sample is determined in the most general class among k close neighbors. K is a positive value and is generally small. If k = 1, the sample is easily determined in its nearest neighboring class. The value of k is odd because it prevents equal votes. In the proposed method, The KNN classification algorithm, due to the very high speed and less need for training other classifiers, is considered as a classification to detect attacks.
3.5.2 Decision tree
A decision tree is a structure used to classify a broad set of collected data into smaller chains of data, based on a series of simple decision rules. In each successive classification, the resulting sets' members become more and more similar to each other. A decision tree model consists of rules for dividing a large heterogeneous population into smaller and more homogeneous groups based on specific objective variables [6].
3.5.3 Multi support vector machine
The SVM classification uses supervised learning methods. This method is one of the relatively new methods that, in recent years, has shown good performance compared to older methods for classification, including perceptron neural networks. The SVM classifier's basis is the linear classification of data; therefore, we try to choose the line with the most reliable margin.
The proposed method is implemented by a computer with 64-bit Windows 8.1, Intel Core i5-4720 CPU @ 2.60 GHz, 6GB memory, and MATLAB R2018a.
All experiments were tested and compared with different categories to test the proposed method. The experiments were performed for comparison of different classifiers and the KNN algorithm. Network traffic data set has been used to evaluate the proposed method. This dataset was compiled by MIT's Lincoln Laboratory Technology and Cyber-Systems Unit. NSL-KDD datasets (Improved datasets (KDDcup, 1999) with the specifications in Tables (1-5) have been used in this study. For each connection in this data set, 41 discrete and continuous properties are defined, and each connection is also defined. It has a tag that indicates the connection is regular, or one of the attacks has happened. It is not prone to recurring records, including DoS, R2L, U2R, and Probing attacks [10]:
In the proposed method, the classification and detection of intrusion have led to 4 states: True Positive, True Negative, False Positive, and False Negative.
Accuracy $=\frac{T P+T N}{N}$ (11)
The Receiver Operating Characteristic (ROC) curve is also plotted for various techniques. ROC plots the curve between the true positive rate (TPR) and the false-positive rate (FPR) of an algorithm. TPR and FPR are computed as in (9) and (10), respectively.
The results of The Receiver Operating Characteristic (ROC) curve and AUC scores represent the true positive rate (TPR) and false-positive rate (FPR) of an algorithm. TPR and FPR are computed as in (12) and (13), respectively.
$T P R=\frac{T P}{T P+F N}$ (12)
$F P R=\frac{F P}{F P+T N}$ (13)
In the proposed method, three criteria for detecting attacks in terms of accuracy, correct detection rate and incorrect detection rate are used from 11 to 13 so that the proposed method is evaluated according to those criteria. In the proposed method, the NSL-KDD dataset was used. The attacks include the following four categories:
• Denial of Service (DoS): It involves an attack that engages the victim's resources by performing specific calculations or occupying memory resources to the extent that it prevents the victim from making legal requests.
• User to Root (U2R): In this case, the attacker collects information remotely about the network to make it possible to circumvent security measures.
• Remote to Local (R2L): In this case, the attacker collects information remotely about the network to make it possible to circumvent security measures.
• Probing: The attacker infiltrates a remote vehicle and gains local access to the victim's vehicle.
In Tables 1 and 2 represent the data set used in the proposed method. This dataset includes training and testing datasets.
Tables 1 and 2 illustrate that training datasets are used for the algorithm. Thus, the training and test data sets are completely separated from each other. Further, experiments compare the performance of feature selection methods using GA [13], PSO [6], and ACO [5] (Table 3).
Table 1. The number of training data sets which is used for the experiment
|
|
Normal |
Dos |
R2L |
U2R |
Probe |
Total Number |
|
Number of Train Data |
660 |
2100 |
90 |
6 |
187 |
3043 |
Table 2. The number of test data sets which is used for the experiment
|
|
Normal |
Dos |
R2L |
U2R |
Probe |
Total Number |
|
Number of Test Data |
297 |
1050 |
78 |
33 |
42 |
1500 |
Table 3. The number of test data sets which is used for the experiment
|
FS method |
Selected features |
Detection rate (TPR %) |
False alarms (FPR %) |
|
Raw |
38 |
94.70 |
5.30 |
|
GA [13] |
17 |
92.00 |
8 |
|
PSO [6] |
20 |
81.23 |
18.77 |
|
ACO [5] |
18 |
98.00 |
2 |
|
GOA Proposed |
16 |
99.5 |
0.50 |
As shown in Table 3, the proposed method, based on the GOA algorithm, has a much accurate detection rate and a much lower error rate, so it performs better compared to other methods.
Figure 2 also compares different attribute selection methods based on detection rates. It should be noted that the selected features are a subset of raw attribute.
Figure 2. Feature selection methods using detection rates
According to Figure 2, the proposed method based on GOA has the best performance among other feature selection methods using the minimum features. Also, Figure 3 examines the convergence of the GOA algorithm to reduce the feature.
According to Figure 3, it is correctly observed that the attribute reduction algorithm converges after 150 repetitions, which leads to the selection of optimal attribute with increasing classification accuracy.
Figure 3. Fitness function of the proposed method
In the proposed method, because in the different classifications, the KNN classification with different values of k has been tested, so different attacks in Table 4 have analyzed it.
The graphs for K-Values are illustrated in Figure 4 for the various attack types of different kNN classifications.
Comparing the methods on Accuracy of KNN with K-Values illustrates that the KNN algorithm with k=3 has the highest accuracy except for the U2R attack.
In the proposed method, the GOA method is examined based on different classifications. Thus, different classifications such as a KNN, naïve Bayes, multi-SVM, and decision tree were examined in Table 5. This feature has 16 attributes and is based on the NSL-KDD dataset.
Table 4. The number of test data sets which is used
|
Values |
K=3 |
K=5 |
K=7 |
|
R2L |
0.9987 |
0.9983 |
0.9962 |
|
DOS |
0.9994 |
0.9993 |
0.9911 |
|
U2R |
0.9993 |
0.9994 |
0.9991 |
|
Probe |
0.9975 |
0.9925 |
0.9935 |
Figure 4. Comparison of accuracy of kNN with K-values
Table 5. Comparison of accuracy of different classifiers
|
Classifier |
Accuracy |
Recall |
|
Multi SVM |
96.3% |
97.02 |
|
Decision Tree |
98.01% |
99.65 |
|
Proposed Technique KNN |
99.50 |
100 |
As shown in Table 5, the comparison of different classifications was performed using the NSL-KDD dataset and dimensional reduction. Studies have shown that the kNN classifier is more accurate and recall, among other methods compared to other methods. KNN classifier also has an outstanding performance in terms of time due to its speed.
Moreover, Table 6 examines the accuracy of the proposed method compared to other methods.
Table 6. Comparison of the proposed method with other methods
|
Technique |
NSL-KDD Dataset |
|
|
Classifier |
Accuracy |
|
|
GA [13] |
Naive Bayes |
98.89 |
|
PSO [6] |
Naive Bayes and J48 |
81.8% |
|
ACO [5] |
KNN, SVM |
98.90% |
|
Proposed Technique |
KNN |
99.50% |
In Table 6, by comparing the KNN method to other methods, we find out that the KNN method has a very high accuracy compared to other methods. Genetics, PSO, and ACO could not always be reasonable solutions to reduce the attribute due to local optima. In other words, the proposed method has outstanding performance because the previous and next solutions are considered.
We presented an intrusion detection system based on grasshopper optimization on the NSL-KDD dataset in the proposed method. The reduced data obtained from these methods are then evaluated by the Nearest Neighborhood Classifier (KNN) and their results. The proposed method was then compared with other methods based on ant colony optimization, particle swarm, and genetic algorithm. The results show that the proposed method could detect various attacks, and its quantitative performance results are very close to the ant colony optimality since the penetration detection method has not been investigated by the Grasshopper Optimization Algorithm (GOA).
[1] Vaarandi, R., Podiņš, K. (2010). Network IDS alert classification with frequent itemset mining and data clustering. 2010 International Conference on Network and Service Management, Niagara Falls, ON, Canada, pp. 451-456. https://doi.org/10.1109/CNSM.2010.5691262
[2] Verma, A., Ranga, V. (2018). Statistical analysis of CIDDS-001 dataset for network intrusion detection systems using distance-based machine learning. Procedia Computer Science, 125: 709-716. https://doi.org/10.1016/j.procs.2017.12.091
[3] Ibrahim, H.T., Mazher, W.J., Ucan, O.N., Bayat, O. (2019). A grasshopper optimizer approach for feature selection and optimizing SVM parameters utilizing real biomedical data sets. Neural Computing and Applications, 31(10): 5965-5974. https://doi.org/10.1007/s00521-018-3414-4
[4] Paliwal, S., Gupta, R. (2012). Denial-of-service, probing & remote to user (R2L) attack detection using genetic algorithm. International Journal of Computer Applications, 60(19): 57-62.
[5] Aghdam, M.H., Kabiri, P. (2016). Feature selection for intrusion detection system using ant colony optimization. IJ Network Security, 18(3): 420-432.
[6] Manekar, V., Waghmare, K. (2014). Intrusion detection system using support vector machine (SVM) and particle swarm optimization (PSO). International Journal of Advanced Computer Research, 4(3): 808.
[7] Catherine, F.L., Pathak, R., Vaidehi, V. (2014). Efficient host based intrusion detection system using Partial Decision Tree and Correlation feature selection algorithm. 2014 International Conference on Recent Trends in Information Technology, Chennai, India, pp. 1-6. https://doi.org/10.1109/ICRTIT.2014.6996115
[8] Fan, Y., Ye, Y., Chen, L. (2016). Malicious sequential pattern mining for automatic malware detection. Expert Systems with Applications, 52: 16-25. https://doi.org/10.1016/j.eswa.2016.01.002
[9] Rai, K., Devi, M.S., Guleria, A. (2016). Decision tree based algorithm for intrusion detection. International Journal of Advanced Networking and Applications, 7(4): 2828-2834.
[10] Goeschel, K. (2016). Reducing false positives in intrusion detection systems using data-mining techniques utilizing support vector machines, decision trees, and naive Bayes for off-line analysis. SoutheastCon 2016, Norfolk, VA, USA, pp. 1-6. https://doi.org/10.1109/SECON.2016.7506774
[11] Bejan, A. (2016). Constructal thermodynamics. International Journal of Heat and Technology, 34(1): S1-S8. https://doi.org/10.18280/ijht.34S101
[12] Jabbar, M.A., Samreen, S. (2016). Intelligent network intrusion detection using alternating decision trees. 2016 International Conference on Circuits, Controls, Communications and Computing (I4C), Bangalore, 2016, pp. 1-6. https://doi.org/10.1109/CIMCA.2016.8053265
[13] Mirza, Q.K.A., Awan, I., Younas, M. (2018). CloudIntell: An intelligent malware detection system. Future Generation Computer Systems, 86: 1042-1053. https://doi.org/10.1016/j.future.2017.07.016
[14] Desale, K.S., Ade, R. (2015). Genetic algorithm based feature selection approach for effective intrusion detection system. 2015 International Conference on Computer Communication and Informatics (ICCCI), Coimbatore, India, pp. 1-6. https://doi.org/10.1109/ICCCI.2015.7218109
[15] Saremi., S, Mirjalili, S., Lewis, A. (2017). Grasshopper optimisation algorithm: Theory and Application, 105: 30-47. https://doi.org/10.1016/j.advengsoft.2017.01.004
[16] Ahmed, A.M., Rizaner, A., Ulusoy, A.H. (2018). A novel decision tree classification based on post-pruning with Bayes minimum risk. PloS One, 13(4): e0194168. https://doi.org/10.1371/journal.pone.0194168
[17] Sanchita, G., Anindita, D. (2016). Evolutionary algorithm based techniques to handle big data. Techniques and Environments for Big Data Analysis, 113-158. https://doi.org/10.1007/978-3-319-27520-8_7
[18] Emary, E., Zawbaa, H.M., Hassanien, A.E. (2016). Binary ant lion approaches for feature selection. Neurocomputing, 213: 54-65. https://doi.org/10.1016/j.neucom.2016.03.101