Maryam Khanian Najafabadi* | Azlinah Mohamed | Madhavan A/L Balan Nair | Sayed Mojtaba Tabibian
© 2021 IIETA. This article is published by IIETA and is licensed under the CC BY 4.0 license (http://creativecommons.org/licenses/by/4.0/).
OPEN ACCESS
Collaborative Filtering (CF) has been known as the most successful recommendation technique in which recommendations are made based on the past rating records from like-minded users. Significant growth of users and items have negatively affected the efficiency of CF and pose key issues related to computational aspects and the quality of recommendation such as high dimensionality and data sparsity. In this study, a hybrid method was proposed and was capable to solve the mentioned problems using a neighborhood selection process for each user through two clustering algorithms which were item-based k-means clustering and user-based Fuzzy Clustering. Item-based k-means clustering was applied because of its advantages in computational time and hence it is able to address the high dimensionality issues. To create user groups and find the correlation between users, we employed the user-based Fuzzy Clustering and it has not yet been used in user-based CF clustering. This clustering can calculate the degree of membership among users into set of clustered items. Furthermore, a new similarity metric was designed to compute the similarity value among users with affecting the output of user-based Fuzzy Clustering. This metric is an alternative to the basic similarity metrics in CF and it has been proven to provide high-quality recommendations and a noticeable improvement on the accuracy of recommendations to the users. The proposed method has been evaluated using two benchmark datasets, MovieLens and LastFM in order to make a comparison with the existing recommendation methods.
recommendation system, fuzzy clustering, collaborative filtering, sparsity
A recommender system provides a personalized set of recommendations by incorporating users’ needs into a user model and applying suitable recommendation algorithms in mapping the user model into targeted item recommendations [1-3]. Due to the advancement in Internet technology, the development of recommender systems in e-commerce sites for product purchase advice is becoming more significant. This is due to its ability to save users' time and effort in searching for items [4-6].
Recent works have showed that to provide high-quality recommendations, the similarity metrics design have to be innovative and artificial learning machine and artificial intelligence ought to be employed [7, 8]. The major challenge is to accurately discover users’ interests through creating a proper user model. In doing this, it is significant to identify the computation times which is necessary for defining the relations among users or items that can be regarded as performance issue of the recommender systems due to the large numbers of items or users. Moreover, there are drawbacks of CF recommendation systems that need to be addressed in increasing the quality of recommendation and accuracy of the predicted rated. These drawbacks are high dimensionality, data sparsity, and cold-start [9-12]. Most of the proposed recommender systems in solving drawbacks of CF failed to take action based on both sides of similarity (similarity among users and items) and it was discovered that the amount of time spent in calculating similarity among users or items to produce recommendations was extended. With the goal of reducing the execution of time with the number of bit processing, this study proposes a hybrid recommender system with a new similarity measurement method that combines the calculation of similarity between items and users in predicting the score of active users on unseen items.
The motivation and contribution of this study will be presented in sub-section 1.1. This paper is organized into the following sections: Section 2 briefly provides reviews on previous works on recommender systems and the clustering techniques. Section 3 presents the research methodology used in this study. The proposed recommendation method and experiment methodology will be described in the following subsections (3.1 and 3.2). Section 4 describes results of the experiment conducted. Section 5 outlines the conclusions and future direction of this work.
1.1 Motivation
One of the most successful clustering techniques to overcome the issues of CF is fuzzy c-means. In fact, there are research methodologies developed to increase the quality of recommendations that apply fuzzy C-means clustering in CF. However, these research methodologies have not yet been applied in user's modeling for making recommendations and none of those concentrate on execution time that is required to calculate the similarity of active users among the existing users in the database. For example, the research done by Cheng and Wang [13] proposed fuzzy clustering on item based CF and find the grade of membership of items to different clusters. Koohi and Kiani [14] presented a model in which combined fuzzy clustering and Pearson correlation, but the authors did not show how to find the neighbor users and similarity weights for prediction process by considering fuzzy clustering.
Hence, to fill in the mentioned gaps this study applies two clustering methods to determine the correlation between user profiles and items. The first clustering is to group together items into clusters to minimize the dissimilarity between items assigned to the same cluster by using K-means clustering algorithm. The second clustering is to arrange similar users into clusters of items by using fuzzy c-means. Then, in the prediction step, the membership value of every user that belongs to k clusters with a similarity metric is measured in order to attain an increased quality of suggestions. To the best of our knowledge, none of previous research works have considered the potentials of employing two level clustering methods with a similarity metric to find group of neighbor users and improve the performance and processing times for recommendations.
Recommender systems are intelligent computer systems in which the relationship between users and items will be modeled on user’s preferences, user interaction history, online behaviors or hobbies. Recommender systems help customers to decide what products to buy or to select from a set of choices in order to fit their tastes. Therefore, the main issue in the recommender systems is the extraction of users’ interests to provide customized suggestions for users. In order to improve the performance of recommendations and the accuracy of the predicted ratings, several researches on recommendation systems have been recently conducted to propose different recommendation approaches [15-19].
CF recommendation systems are known as one of the most successful techniques among other recommendation techniques in gaining efficiency based on the similarity measurement of users and items. Memory-Based Collaborative Filtering employs users’ ratings on items to make recommendations by finding users with similar tastes. In contrast, Model-Based Collaborative Filtering produces predictions for the active users based on users’ interaction history in the entire user-item database. Unfortunately, because CF techniques rely on users’ interests and calculate the similarity of active users with each of the existing users in the database to make suggestions, some issues related to computational aspects and quality of recommendations still arise. The typical similarity metrics in CF are Cosine Vector Similarity (CVS) (Eq. (1)), Pearson's Correlation Coefficient (PCC) (Eq. (2)) [10, 13, 20-24]. CVS and PCC are statistical analysis methods to calculate the similarity between an active user x and another user y:
$W_{X y}=\frac{\mathrm{x} \cdot \mathrm{y}}{|\mathrm{x}| \times|\mathrm{y}|}=\frac{\sum_{\mathrm{i}=1}^{\mathrm{n}}\left(\mathrm{r}_{\mathrm{Xi}}\right)\left(\mathrm{r}_{y i}\right)}{\sqrt{\sum_{\mathrm{i}=1}^{\mathrm{n}}\left(\mathrm{r}_{\mathrm{Xi}}\right)^{2}} \sqrt{\sum_{\mathrm{i}=1}^{\mathrm{n}}\left(\mathrm{r}_{y i}\right)^{2}}}$ (1)
$W_{\mathrm{Xy}}=\frac{\sum_{\mathrm{i}=1}^{\mathrm{n}}\left(\mathrm{r}_{\mathrm{Xi}}-\overline{\mathrm{r}}_{\mathrm{x}}\right)\left(\mathrm{r}_{\mathrm{yi}}-\overline{\mathrm{r}}_{\mathrm{y}}\right)}{\sqrt{\sum_{\mathrm{i}=1}^{\mathrm{n}}\left(\mathrm{r}_{\mathrm{Xi}}-\overline{\mathrm{r}}_{\mathrm{x}}\right)^{2} \sum_{\mathrm{i}=1}^{\mathrm{n}}\left(\mathrm{r}_{\mathrm{yi}}-\overline{\mathrm{r}}_{\mathrm{y}}\right)^{2}}}$ (2)
where, n represents all items that both users x and y have rated. The notation $\overline{\mathrm{r}_{\mathrm{x}}}$ and $\overline{\mathrm{r}_{\mathrm{y}}}$ indicate the average rating of the items rated by user x and y, respectively. The similarity weight $W_{X y} \in[-1,1]$ measures the preferences of users as value of 1 denotes ratings of user x link perfectly with those of user y, while a value of -1 shows a perfect negative correlation between two users’ ratings. When neighbors of the active user by CVS and PCC were selected, a prediction of preference for the active user x on unseen items is calculated.
However, existing similarity measurement methods in CF lead to poor recommendations and system performance due to problems such as lengthy computation times in the process of creating recommendations, data sparsity, data correlation and cold start problems. In order to overcome the mentioned problems, recent studies have proved advantages of the adoption of clustering techniques [13-15] in improving recommendation techniques to create more accurate predictions for sparse data. Clustering techniques can process the massive data by grouping them into clusters, so that the dissimilarity between data assigned to the same cluster is minimized. The advantages of clustering algorithms in reducing the rating matrices’ sparsity have been proven in a study by Zahra et al. [6]. In this study, the technique employed was based on the notion that users tend to associate with each other better within a small-sub area compared to the whole domain area. Since clustered sub-matrices were likely to have higher density than the original large matrix, better correlations were expected to be discovered [6, 14, 15]. Zahra et al. [6] have improved recommendation process by exploiting users by employing maximum number of ratings for clustering user/item matrix and finding out the most similar centroids as neighbors of active user. To address the issues of basic CF, a fuzzy recommender system was proposed by Cheng and Wang [13] based on subjective and objective information. Subjective information included opinions gathered from domain experts, and the preferences of target users were based on similar users. Hence, users presented their choices or preferences in the fuzzy linguistic model.
Although artificial intelligence and machine learning algorithms in recommendation systems especially clustering algorithms are emerging techniques, the main problems are the computation times necessary for defining the relations among users or items that can be regarded as performance issue of the recommender systems and potentially useful information might be lost in reducing dimensionality of the user and product space that leads to low quality recommendations [25-28].
Therefore, in the current study, we propose a new model with employing the benefits of K-means and fuzzy C-means clustering to overcome the issues of data sparsity, computation times and high-dimensionality. In particular, our model is adopted with fuzzy logic to find a group of neighbor users in making personalized recommendations. Using the proposed model, a user belongs to two or more clusters of items with different membership value and this membership degree is used to connect active users to other users. Hence, a user has different neighbor group in different clusters and we have successfully improved concept of similar preferences between users in CF. Because CF techniques consider users who only having similar preferences on same items to the active user, such a result is not true in sparse data. Additionally, a new similarity measure has been presented which uses results of fuzzy c-means in Jaccard similarity metric to recommend items to the active user. Two benchmark datasets, Movielens and MSD are used to evaluate the proposed model in terms of MEA, RMSE and recommendation coverage.
3.1 The proposed recommendation method
This section explains our proposed method as a solution that is based on CF and clustering algorithms in handling the issues. Our method is based on four steps as depicted in Figure 1: (1) Item-based k-means clustering, (2) User-based Fuzzy Clustering, (3) Prediction process, and (4) Top-N recommendation. In the Item clustering step, we select k-means method to cluster similar items based on their features in clusters and minimize the dissimilarity between items assigned to the same cluster. User clustering step uses fuzzy c-means clustering on user-item interaction matrix in order to assign every user to k-clusters with different membership degrees. Then, prediction process combines the membership degree of users to each cluster with a similarity metric to find neighbor users and predict user’s interests on unseen items, and finally Top-N recommendation step suggests items with high rating value (items with higher rating of 3). The details of our model will be described in the next two sub-sections:
Figure 1. Diagram of the proposed recommendation method
3.1.1 Item-based via k-means clustering on the basis of item’s features
The K-means clustering algorithm is an unsupervised learning method that can efficiently deal with large amount of data and sparse data by grouping whole dataset into different K clusters [13, 14]. This paper utilizes the K-means clustering to partition items into k clusters and to conduct the correlation between items by minimizing the distances between items and cluster centers. The main goal of this phase in our method is to discover significant correlation among items and details of this phase are illustrated in Table 1.
In order to remove noise dimension in the data set, clustering was used to detect and remove outliers. We have used the fact behind this idea that within a small sub-area, users tend to associate with each other better than within the whole domain [6]. Clustering data decreases the dimensionality of sparse rating matrices. Because outliers do not belong to any cluster and sub-matrices grouped in clusters are likely denser than an original large matrix, better correlations are expected to be found in clusters.
A Euclidean distance function is applied on whole dataset of items to find partition of items and assign different items into k clusters. Given a whole dataset of items (i1, i2, ...., in) where each item is represented by a d-dimensional vector, the k-means clustering algorithm partitions these n items into k sets (k ≤ n) S = {S1, S2, ...., Sn}, where $\mu_{i}$ is the mean of data points in $S_{i}$. In k-means clustering, an item is not allowed to belong to more than one cluster where identify mutually exclusive groups of items.
$\sum_{i=1}^{k} \sum_{x_{j} \in s_{i}}\left\|x_{j}-\mu_{i}\right\|^{2}$ (3)
Table 1. Clustering of items based on item’s profile with K-means algorithm
|
Input: Items’ profile and K(the number of clusters) Output: Cluster Set of items |
|
1. Selectin items' features that are relevant and provide a more efficient clustering process when computing the similarity between items 2. Doing Data Preprocessing and normalize data or values of features before running clustering (the feature data is scaled to fit in a specific range and to be suitable for cluster analysis) 3. Define suitable numbers of clusters, k. 4. Select an initial set of clusters’ center randomly so that each cluster has a centroid 5. Calculate the distance between each item and the centroid of cluster and Assign each item to the cluster that has the closest centroid 6. Recalculate positions of K centroids for each cluster when all items have been assigned into clusters. 7. Repeat steps five and six to adjust the cluster center and the degree of membership for each item as no centroids move longer or no item changes its cluster membership 8. Return the clusters of items while items within the same cluster have a high degree of similarity |
It must be noted that most clustering methods assume that all attributes or variables are equally important for computing the similarity between objects. Such assumption is not true since attributes influence the efficiency of clustering: while some of these attributes may adversely affect the clustering process or have no impact on the model, others may be relevant for determining the structure of the problem. However, the irrelevant, noisy features and number of clusters influence the efficiency of the clustering algorithms. Therefore, a normalization and feature scaling needed before clustering and then, we perform k-means clustering on each of item’s features individually for K clusters with ranges from 2 to 10 to take the features and number of clusters which providing a more efficient clustering process. The clustering performance metric named ‘silhouette’ is employed to evaluate the accuracy and efficiency of clusters. As a consequence, we have a curve of clustering result for each of features. Then, we are able to see which subset of features and number of clusters provides the best performance. We conclude that our model exhibits best clustering results when the number of K is equal to 4 and items are grouped into 4 clusters, as shown in Table 2.
Table 2. Sample of 15 items grouped into 4 clusters
|
Cluster No. |
Cluster Set of items |
|
Cluster 1 |
{Item1, Item4, Item12} |
|
Cluster 2 |
{Item2, Item5, Item10, Item15} |
|
Cluster 3 |
{Item3, Item6, Item8, Item14} |
|
Cluster 4 |
{Item7, Item11, Item13, Item9} |
|
Algorithm: k-means. The k-means algorithm for partitioning, where each cluster’s center is represented by the mean value of the objects in the cluster. Input:
Output: A set of k clusters. Method:
|
3.1.2 User-based via fuzzy clustering algorithm
The description on the application of fuzzy c-means in our model will be given in this sub-section. Output of Phase 1 (Clustering made based on item’s features) which is the item clusters work as the input for fuzzy c-means in our model. To improve the similarity measure, we have applied the advantages of the adopting fuzzy logic onto user modeling. Fuzzy C-means is a clustering method in which an object is assigned to two or more clusters with different membership degree while K-means clustering groups a set of objects within a specified number k of clusters. Thus, objects at the same cluster have a high degree of similarity.
Fuzzy C-means attempts to find a group for input data X = {x1, x2, ..., xN}, where N shows number of data in X, xj € Rp, p denotes number of features in each vector xj. Fuzzy C-means able to minimize the cost function while clustering X into C prototypes [13]:
$J_{m}(A, V)=\sum_{i=1}^{c} \sum_{j=1}^{N}\left(a_{i j}\right)^{m} D_{i j}$ (4)
where, Dij is the distance measure between xj and vi, m is the fuzzification parameter in defuzzification method, V={v1,v2, ..., vC} is the cluster prototype matrix, A=$\left[a_{i j}\right]_{c * N}$ is the fuzzy partition matrix and aij € [0,1] is the membership coefficient of jth object in the ith cluster.
In order to simplify the similarity calculation between users and to reduce data dimensionality, our recommendation model employs fuzzy C-means. Assume there are 15 items in dataset, and users have shown the interactions on these 15 items (by giving ratings or selecting items). In the first step, every item is grouped into 4 clusters on the basis of item’s features. Now, Fuzzy C-means finds the membership degrees for each user assigned to 4 clusters as shown in Figure 2. This phase provides a partition of users according to their interactions with items grouped in clusters. The output is the assignment of various users in 4 clusters. As result of fuzzy C-means, a membership degree of a user to the four clusters is calculated. Sum of all the membership degrees of each user is equal to 1. Figure 2 illustrates the membership degree of each user to each cluster.
Figure 2. Assigning users to 4 clusters with different membership degrees using Fuzzy C-means
After assigning every user to 4 clusters with different membership degrees, the neighbour users will be then defined with computing the similarity measure between two users. We apply a “defuzzification” method for defining similar users or neighbour users in the prediction step. Assume the membership degrees of user u for k=4 are (0.7, 0.2, 0.1, 0). We select similar N users as neighbors of user u that has the highest grade of membership at each 4 clusters with keeping into account relatively of membership degree of user u to clusters. For example, we consider top-1 user from cluster 3 and top-2 users from cluster 2 and top-7 users from cluster 1. In fact, similar users are evaluated in a proportional way with keeping into account n1 users, that have the highest membership degree at cluster 1, n2 users, which have the highest membership degree at cluster 2, and so on. An advantage of extracting such similar users is that active users who show more actions in the prediction process. In addition, we combine the results of fuzzy c-means in the Jaccard similarity metric as a measure of similarity between two users to provide better recommendation results than traditional metrics in CF. Our motivation and foundations in designing a new similarity measure can be found in the following equation:
$W_{u v}=\frac{\left|I_{u} \cap I_{v}\right|}{\left|I_{u} \cup I_{v}\right|} *\left(1-\left(\sum_{k=1}^{n=\text { Cluster No. }}\left|u_{k}-v_{k}\right|\right)\right)$ (5)
The similarity weight $W_{u v} \in[-1,1]$ measures dependencies between preferences of user u and user v. Where $I_{u}$ and $I_{v}$ are the set of items seen by user u and user v, respectively. Also $u_{k}$ and $v_{k}$ are membership degrees of user u and user v of cluster k. Then, this similarity weight is used to contribute to the prediction process. The predicting preference of user u on item (i) is expressed by following equation:
pred $_{u i}=\overline{r_{u}}+\frac{\sum_{v=1}^{k}\left(r_{v i}-\bar{r}_{v}\right) \times W_{u v}}{\sum_{v=1}^{k}\left|W_{u v}\right|}$ (6)
where, k stands for users in neighborhood of user u, $r_{u}$ is the average rating given to items by user u and $W_{u v}$ is our similarity function between user u and user v. Finally, our algorithm predicts ratings for unseen items by the user u and selects the Top-N items to recommend.
Compared to traditional similarity metrics in CF, our proposed metric has several advantages. The proposed similarity metric not only provides better recommendation results than traditional metrics, it also decreases the computation times necessary in calculating the similarity between users due to the search on similar users in small groups. In addition, our proposed metric involves the weight given to similar items and number of similar items seen by two users to compute the most similar k users. Experimental results in Section 4 will show the effectiveness of the proposed recommender system in comparison with the other existing recommendation methods.
3.2 Experimental evaluation methodology
3.2.1 Datasets and experimental setup
We propose an innovative and efficient method to find neighbor users by employing K-means and fuzzy C-means. In order to evaluate the performance of our algorithm, we have used MovieLens and LastFM datasets in the experiment. MovieLens dataset was made up of data captured from film recommendation website which contained 1 million ratings for 3900 movies by 6040 users. The ratings were on the scale of 1 (bad film) to 5 (excellent). Movielens dataset was extremely sparse and the sparsity level of this matrix was 95.8% and it was calculated as in the following equation:
sparsity measure $=1-\frac{\text { total number of existing users' ratings }}{\text { total number of users } * \text { total number of items }}$ (7)
Moreover, we have used another dataset namely Last.fm which captures music listening information. This dataset contains 92,834 music listened by 1892 users. This dataset provides a listening count for each user and can be linked to data in other music recommendation datasets such as million song dataset (MSD) (https://labrosa.ee.columbia.edu/millionsong/) for music features and play count records of music by users. So we have utilized MSD to extract the audio features and metadata about music for groping similar items. To find out scale ratings that ranged from 1 to 5, we computed a listening count for a particular [user, music] pair relative to maximum number of listening counts in his profile. Hence, a listing count for a particular [user, music] pair located in the 80-100% range of user’s profile receives a rating of 5. The music with a listening count between the 60-80% percentiles were coded to a rating of 4 and listening count that appeared between the 40-60% percentiles were mapped to a rating of 3, and so on.
The datasets were randomly divided into a training set, which included the 80–95% of the ratings per user and a testing set (the remaining ratings). Starting from the training set recommendation algorithms that predicted unknown rating, the testing set was used to evaluate the accuracy of the predictions. MovieLens and LastFM datasets are the largest and benchmark datasets which are used frequently in the field of recommender systems to test recommendation algorithms. Hence, we were able to compare the efficiency and prediction accuracy of our algorithm with some of the state of art algorithms. Our algorithm was implemented in Python and run on a machine with 4 GB of RAM and 3.1 GHz CPU.
3.2.2 Evaluation metrics
To evaluate the performance and quality of a recommender system, various evaluation metrics were divided into two categories (statistical accuracy metrics and decision-support metrics) and they were calculated. A detailed description of using the evaluation metrics for recommender systems can be found in our previous work [9, 28-30]. The type of evaluation metrics adopted depends on the result of recommendation algorithm and type of application. In this research, we used Mean Absolute Error (MAE) and Root Mean Squared Error (RMSE) which are commonly applied in the evaluation of recommendation performance. These metrics measure the extent a recommendation system can predict an exact rating value for a specific item. Both metrics compute the absolute errors between the predicted ratings provided by a recommender system and actual ratings and they are computed as in the following equation:
$\mathrm{MAE}=\frac{\sum_{i=1}^{N}\left|p_{i}(u)-r_{i}(u)\right|}{\mathrm{N}}$
$R M S E=\sqrt{\frac{1}{N} \sum_{i=1}^{N}\left(p_{i}(u)-r_{i}(u)\right)^{2}}$ (8)
where, N is the total numbers of ratings provided by users in the test set, Pi (u) is predicted rating provided by for user u on item i and ri (u) is the actual rating. The lower scores of RMSE and MAE indicate the better predictions and higher accuracy. Moreover, we used coverage, which describes the percentage of user-item pairs that a recommendation algorithm is able to provide prediction for [26, 28].
3.2.3 Experimental methodology
In our experiment, we used a pre-processing method that has been extensively used in many research works [12, 13, 30-32]. In this method, the datasets are randomly divided into training and testing set, which were 80% of the ratings per user as training set and the remaining ratings (20%) as the test set. The training set was used for the training of our algorithm and predicting the unknown ratings, while the testing set was utilized to evaluate the accuracy of ratings predicted. Each user in our dataset rated at least 5 music or movies.
In this section, the results of the comparison amongst the performance of our algorithm with K-Means Collaborative Filtering (KMCF), IFCCF algorithm proposed by Yera et al. [15], Centroid selection algorithm proposed by Cheng and Wang [13], SOM-cluster, K-means-cuckoo algorithm proposed by Yera et al. [14] and Soft K-indicators Alternative Projection (SKAP) algorithm proposed by Li et al. [1] are presented. The results are benchmarked with aforementioned algorithms in terms of MAE in recommendation, and recommendation coverage by means of two benchmark datasets: LastFM and Movielens.
4.1 Comparative evaluation in terms of MAE metrics
The aim of this sub-section is to provide the results of the analysis conducted on the performance by comparing the MAE results offered by K-Means Collaborative Filtering (KMCF), IFCCF, Centroid selection, SOM-cluster, SKAP and Kmeans-cuckoo algorithms. To compare the performance of the aforementioned algorithms, we measure MAE and we present the results computed for MAE of each algorithms in Figure 3 and Figure 4.
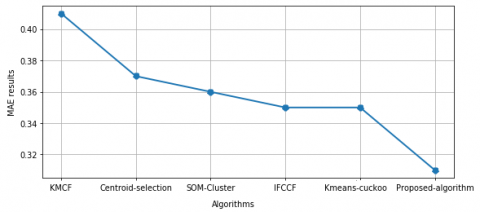
Figure 3 depicts the detailed results on Movielens dataset. The results show that the MAE of our algorithm and SKAP proposed by Li et al. [1] outperforms all algorithms, whereas K-means-cuckoo algorithm comes in second. These prove that Centroid selection and SOM-cluster have the same behaviors as MAE value at 0.75 and KMCF [13] at 0.82 worse than other algorithms. The results over lastFM dataset in Figure 4 show that our algorithm performs the best. Moreover, it can be seen that all algorithms generate better results than KMCF, while behavior of Centroid selection algorithm, SOM-cluster, IFCCF and Kmeans-cuckoo algorithms has been relatively stable with MEA values of 0.37, 0.36 and 0.35 respectively.
Figure 3. Performance of the seven different algorithms by measuring MAE on Movielens dataset
Figure 4. Performance of the six different algorithms by measuring MAE on LastFM dataset
Therefore, the proposed recommendation model has proven the enhancement of recommendations by employing an item clustering method in the first step and a fuzzy C-means method in the second step in order to provide different degrees of membership for every user that belongs to different clusters. Then, predictions on unseen items were done based on calculating fuzzy similarity degree between users in the third step. This improvement resulted in proposed algorithm due to its major advantage on achievements of lesser computational complexity of the search of the similar users within the clusters of items that have a high degree of similarity. Our algorithm has successfully reduced the sparsity and cold start problem in CF with grouping the similar items into same cluster and then, computing the similar behavioral patterns among users.
4.2 Comparative evaluation in terms of RMSE and recommendation coverage
To further validate our algorithm, we have compared it with KMCF, IFCCF, and SOM-cluster algorithms in terms of RMSE, recommendation coverage and time needed for suggestions to be computed. We compared aforementioned algorithms with benchmark dataset called Movielens. We did not select the LastFM dataset for this analysis due to the lack of RMSE values offered by aforementioned algorithms on LastFM dataset. Comparable performance of algorithms is shown in Table 3. It is clear that there is statistical difference between different algorithms when Movielens dataset at varying training size is adopted. Table 3 refers to the average RMSE at varying a set of neighbors of users and the average coverage of 5 different runs (in each run, the ratings per user are randomly selected in training set).
As shown in Table 3, the tests applied to MovieLens have proven that our algorithm provides better results than other algorithms in all of the cases. Our algorithm has shown the high coverage without a negative effect on the quality of recommendation while requiring lesser computational time. If we compare KMCF (user-based) with SOM-cluster algorithm, KMCF provides more suggestions to users within a shorter time, but the recommendation accuracy decreases. This is because SOM-cluster defines a mapping from a higher-dimensional input space to a lower dimensional map space which in this case reduces the number of neighbors considered in order to make a recommendation. We can notice that IFCCF algorithm outperforms KMCF in a sparse dataset even if recommendations to users need more computational time.
Table 3. Recommendation performance of five algorithms on Movielens dataset
|
Algorithms |
RMSE |
Coverage |
Time (s) |
|
KMCF (item-based) |
1.42 |
95.11 |
160.94 |
|
IFCCF |
1.01 |
95.11 |
2557.02 |
|
KMCF (user-based) |
1.03 |
100 |
173.38 |
|
SOM-cluster |
0.95 |
97 |
181.45 |
|
Proposed algorithm |
0.91 |
100 |
157.42 |
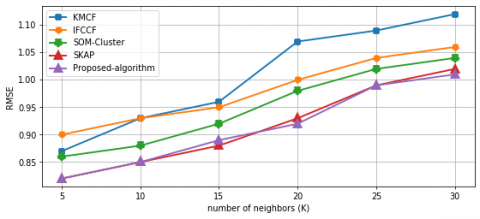
Figure 5. Performance comparisons of four algorithms by measuring RMSE on Movielens dataset
The comparison graphs of RMSE values are presented in Figure 5. In Figure 5, the quality of recommendation of all algorithms decreases when the number of neighbors increases. As seen in the values of RMSE, our algorithm outperforms the best with respect to the comparison with KMCF, IFCCF, and SOM-cluster algorithms, when MovieLens dataset was taken into account. Figure 5 shows the behavior of our algorithm is very close to SKAP algorithm because this algorithm also integrates the item type information into recommender systems.
To overcome the problems of CF and clustering algorithms, we have combined K-means clustering to group similar items and fuzzy C-means to find similar users. Instead of using users' rating, the interest pattern which is similar among users is computed. Several research works have provided us with the proof that single algorithm is not able to overcome the disadvantages of CF and improve the accuracy of recommendations made. Hence, we have proposed an algorithm to improve the performance of recommendations. Our algorithm is proposed by employing K-means clustering to reduce the size of data and the computational time; and by using the membership degree of users to different clusters by means of fuzzy C-means in a similarity metric to calculate the similarity between users. By doing this, we are proposing an innovative and efficient similarity measurement to find neighbor users and provide more suggestions to users.
The importance of our similarity measurement is the combination of the numerical similarity information between the two users and non-numerical information of similarity between them. The findings have shown that how our algorithm increases the recommendation coverage without negatively affecting the recommendation quality. We have compared the proposed algorithm with state-of the-art recommendation algorithms on two benchmark datasets: MovieLens and LastFM datasets to prove the increased recommendation accuracy. The results have demonstrated that our algorithm achieves the better performance when compared to other recommendation algorithms in terms of MAE, RMSE and recommendation coverage. This improvement is due to its major advantage on achievements of lesser computational complexity of the search of the similar users within the clusters of items that have a high degree of similarity. In addition, our algorithm reduces the sparsity and cold start problem in CF by grouping the similar items into same cluster and then, computing the similar behavioral patterns between users. For future work, we intent to develop a statistical method to overcome the limitations of k-means algorithm in predefining k number of clusters and initial centroid selection. Hereby, the better initial centroid selection and computing the value of k will improve the quality of clusters which provide better recommendation.
This work is supported under the Fundamental Research Grant Scheme (600-IRMI/FRGS 5/3 (370/2019). We thank the Ministry of Higher Education, Malaysia and IRMI (Institute of Research, Management and Innovation), UiTM in Malaysia for their continuous support. The authors would also like to thank the Research Management Center of UTAR University through UTARRF Grant Scheme project IPSR/RMC/UTARRF/2020-C1/M01.
[1] Li, W., Jiang, S., Jin, Q. (2018). Overlap community detection using spectral algorithm based on node convergence degree. Future Generation Computer Systems, 79(Part 1): 408-416. https://doi.org/10.1016/j.future.2017.08.028
[2] Li, M., Wen, L., Chen, F. (2021). A novel Collaborative Filtering recommendation approach based on Soft Co-Clustering. Physica A: Statistical Mechanics and its Applications, 561: 125140. https://doi.org/10.1016/j.physa.2020.125140
[3] Tarus, J.K., Niu, Z., Yousif, A. (2017). A hybrid knowledge-based recommender system for e-learning based on ontology and sequential pattern mining. Future Generation Computer Systems, 72: 37-48. https://doi.org/10.1016/j.future.2017.02.049
[4] Ericson, K., Pallickara, S. (2013). On the performance of high dimensional data clustering and classification algorithms. Future Generation Computer Systems, 29(4): 1024-1034. https://doi.org/10.1016/j.future.2012.05.026
[5] Lv, G., Hu, C., Chen, S. (2016). Research on recommender system based on ontology and genetic algorithm. Neurocomputing, 187: 92-97. https://doi.org/10.1016/j.neucom.2015.09.113
[6] Zahra, S., Ghazanfar, M.A., Khalid, A., Azam, M.A., Naeem, U., Prugel-Bennett, A. (2015). Novel centroid selection approaches for K-Means-clustering based recommender systems. Information Sciences, 320: 156-189. https://doi.org/10.1016/j.ins.2015.03.062
[7] Ha, T., Lee, S. (2017). Item-network-based collaborative filtering: A personalized recommendation method based on a user's item network. Information Processing & Management, 53(5): 1171-1184. https://doi.org/10.1016/j.ipm.2017.05.003
[8] Nakatsuji, M., Toda, H., Sawada, H., Zheng, J.G., Hendler, J.A. (2016). Semantic sensitive tensor factorization. Artificial Intelligence, 230: 224-245. https://doi.org/10.1016/j.artint.2015.09.001
[9] Najafabadi, M.K., Mahrin, M.N.R., Chuprat, S., Sarkan, H.M. (2017). Improving the accuracy of collaborative filtering recommendations using clustering and association rules mining on implicit data. Computers in Human Behavior, 67: 113-128. https://doi.org/10.1016/j.chb.2016.11.010
[10] Najafabadi, M.K., Mahrin, M.N.R. (2016). A systematic literature review on the state of research and practice of collaborative filtering technique and implicit feedback. Artificial Intelligence Review, 45(2): 167-201. https://doi.org/10.1007/s10462-015-9443-9
[11] Mohamed, A., Najafabadi, M.K., Wah, Y.B., Zaman, E.A.K., Maskat, R. (2020). The state of the art and taxonomy of big data analytics: view from new big data framework. Artificial Intelligence Review, 53(2): 989-1037. https://doi.org/10.1007/s10462-019-09685-9
[12] Najafabadi, M.K., Mohamed, A., Onn, C.W. (2019). An impact of time and item influencer in collaborative filtering recommendations using graph-based model. Information Processing & Management, 56(3): 526-540. https://doi.org/10.1016/j.ipm.2018.12.007
[13] Cheng, L.C., Wang, H.A. (2014). A fuzzy recommender system based on the integration of subjective preferences and objective information. Applied Soft Computing, 18: 290-301. https://doi.org/10.1016/j.asoc.2013.09.004
[14] Koohi, H., Kiani, K. (2016). User based Collaborative Filtering using fuzzy C-means. Measurement, 91: 134-139. https://doi.org/10.1016/j.measurement.2016.05.058
[15] Yera, R., Castro, J., Martínez, L. (2016). A fuzzy model for managing natural noise in recommender systems. Applied Soft Computing, 40: 187-198. https://doi.org/10.1016/j.asoc.2015.10.060
[16] Bobadilla, J., Ortega, F., Hernando, A., Glez-de-Rivera, G. (2013). A similarity metric designed to speed up, using hardware, the recommender systems k-nearest neighbors algorithm. Knowledge-Based Systems, 51: 27-34. https://doi.org/10.1016/j.knosys.2013.06.010
[17] Camacho, L.A.G., Alves-Souza, S.N. (2018). Social network data to alleviate cold-start in recommender system: A systematic review. Information Processing & Management, 54(4): 529-544. https://doi.org/10.1016/j.ipm.2018.03.004
[18] Da Costa, A.F., Manzato, M.G. (2016). Exploiting multimodal interactions in recommender systems with ensemble algorithms. Information Systems, 56: 120-132. https://doi.org/10.1016/j.is.2015.09.007
[19] Damiani, E., Ceravolo, P., Frati, F., Bellandi, V., Maier, R., Seeber, I., Waldhart, G. (2015). Applying recommender systems in collaboration environments. Computers in Human Behavior, 51: 1124-1133. https://doi.org/10.1016/j.chb.2015.02.045.
[20] Htun, N.N., Halvey, M., Baillie, L. (2018). Beyond traditional collaborative search: Understanding the effect of awareness on multi-level collaborative information retrieval. Information Processing & Management, 54(1): 60-87. https://doi.org/10.1016/j.ipm.2017.09.003.
[21] Moreno, M.N., Segrera, S., López, V.F., Muñoz, M.D., Sánchez, Á.L. (2016). Web mining based framework for solving usual problems in recommender systems. A case study for movies׳ recommendation. Neurocomputing, 176: 72-80. https://doi.org/10.1016/j.neucom.2014.10.097
[22] Musto, C., Basile, P., Lops, P., de Gemmis, M., Semeraro, G. (2017). Introducing linked open data in graph-based recommender systems. Information Processing & Management, 53(2): 405-435. https://doi.org/10.1016/j.ipm.2016.12.003
[23] Nilashi, M., Ibrahim, O., Bagherifard, K. (2018). A recommender system based on collaborative filtering using ontology and dimensionality reduction techniques. Expert Systems with Applications, 92: 507-520. https://doi.org/10.1016/j.eswa.2017.09.058
[24] Najafabadi, M.K., Mohamed, A.H., Mahrin, M.N.R. (2017). A survey on data mining techniques in recommender systems. Soft Computing, 1-28. https://doi.org/10.1007/s00500-017-2918-7
[25] Najafabadi, M.K., Nair, M.B., Mohamed, A. (2021). Tag recommendation model using feature learning via word embedding. In 2021 IEEE 19th World Symposium on Applied Machine Intelligence and Informatics (SAMI), pp. 000305-000310. https://doi.org/10.1109/SAMI50585.2021.9378621
[26] Nguyen, T., Bhatti, A., Khosravi, A., Haggag, S., Creighton, D., Nahavandi, S. (2015). Automatic spike sorting by unsupervised clustering with diffusion maps and silhouettes. Neurocomputing, 153: 199-210. https://doi.org/10.1016/j.neucom.2014.11.036
[27] Peng, F.R., Lu, J.F., Wang, Y.L., Xu, Y.D.R., Ma, C., Yang, J.Y. (2016). N-dimensional Markov random field prior for cold-start recommendation. Neurocomputing, 191: 187-199. https://doi.org/10.1016/j.neucom.2015.12.099
[28] Ochirbat, A., Shih, T.K., Chootong, C., Sommool, W., Gunarathne, W.K.T.M., Wang, H.H., Ma, Z.H. (2018). Hybrid occupation recommendation for adolescents on interest, profile, and behavior. Telematics and Informatics, 35(3): 534-550. https://doi.org/10.1016/j.tele.2017.02.002
[29] Salah, A., Rogovschi, N., Nadif, M. (2016). A dynamic collaborative filtering system via a weighted clustering approach. Neurocomputing, 175: 206-215. https://doi.org/10.1016/j.neucom.2015.10.050
[30] Son, L.H. (2016). Dealing with the new user cold-start problem in recommender systems: A comparative review. Information Systems, 58: 87-104. https://doi.org/10.1016/j.is.2014.10.001
[31] Zhao, W., Guan, Z., Liu, Z. (2015). Ranking on heterogeneous manifolds for tag recommendation in social tagging services. Neurocomputing, 148: 521-534. https://doi.org/10.1016/j.neucom.2014.07.011
[32] Zhang, D., Hsu, C.H., Chen, M., Chen, Q., Xiong, N., Lloret, J. (2014). Cold-start recommendation using bi-clustering and fusion for large-scale social recommender systems. IEEE Transactions on Emerging Topics in Computing, 2(2): 239-250. https://doi.org/10.1109/TETC.2013.2283233