Jia Wen | Xiaochong Wei* | Tao He | Shangshang Zhang
© 2020 IIETA. This article is published by IIETA and is licensed under the CC BY 4.0 license (http://creativecommons.org/licenses/by/4.0/).
OPEN ACCESS
With the proliferation of the fifth generation (5G) communication technology, another boom of online education will come, and reshape our traditional learning model. Inspired by the literature on online education platform, this paper establishes a model for the factors affecting the acceptance of online education platform among college students based on the theory of planned behavior (TPB), and put forward several hypotheses on the influence of multiple factors over the acceptance. Then, a scientific questionnaire was designed and distributed online to college students. The survey data were subject to descriptive analysis and correlation analysis. The results show that college students have considered online education platforms an important learning tool; the acceptance of online education platform among college students is positively affected by such factors as personal value, course satisfaction, teacher quality, social influence, and self-efficacy. The research results provide a good reference for the development of online education in China.
online education platform, regression analysis, acceptance, college students
Online education is not a new thing. As early as 1961, Dr. Douglas highlighted the possibility of computer-assisted learning. In 1969, Britain founded the earliest open university to realize long-distance teaching. This is the origin of online open courses [1]. In the Internet era, online education is booming in many countries. Taking China for instance, the government has attached great importance to this emerging model of education. Drawing on the relevant literature [2], the online education in China can be summarized as follows:
Online education in China can be traced back to 1998, when online academic education was piloted. As of 2014, the 68 pilot colleges had admitted a cumulative total of 18.42 million online learners [3]. Online education bridges up each learner with other learners, education resources, and teachers. Through these connections, the learners can acquire knowledge in different fields from various courses [4].
The most representative online education platform in China is Baidu Chuanke, which was merged from Duxuetang and Chuanke.com. Targeting primary and middle school students, the platform, in association with various education and training institutions, provides lots of K12 education resources, and offers unique modules that help with homework and learning notes. Baidu Chuanke fully integrates the strengths of Baidu in online search, question and answer (Q&A), encyclopedia, and online documents, marking an important breakthrough in online education. But the systematism and resource quantity of the platform are yet to be improved.
So far, Chinese scholars have evaluated the development of China’s online education in each stage, and predicted the future trend of online education in China. As stated by Zhang Yantong, the Internet Plus Education is a perfect integration between the Internet and education. The Internet makes education resources truly open to the public. Technology is merely the carrier of online education. The focus of online education is still education. In other words, the development of online education hinges on education, rather than technology. The quality of online education only reflects the quality of the education model [5]. However, the domestic research stops at theoretical analysis, lacking empirical evidence.
Compared with China, many foreign countries, especially the United States (US), Britain, and Canada, are early starters in online education. In these countries, online education systems are relatively mature, resulting in fruitful research results. For example, Aldowah, Al-Samarraie, Ghazal [6] investigated the personal reasons, attitudes, as well as institutional and social challenges behind the teachers’ reluctance to use online platforms. Zhang [7] held that the design of a sustainable online learning environment must consider learning content, curriculum design, and technical platform, and that the complex system of online education encompasses indispensable elements like teaching evaluation, teacher-student interaction, and student-course interaction, the most important of which is the connections established on online teaching platform.
In the US, all public and private colleges and community colleges provide online teacher training programs. As of the autumn semester 2015, more than 2.1 million (12%) undergraduates and about 770,000 master candidates (26%) had participated in online teacher training programs [8]. These students learn autonomously on online education platforms. Therefore, the foreign researchers on online learning not only focus on theoretical analysis, but also design and optimize new online education models through practice. Besides the popularity of online education, many foreign countries have formulated the degree evaluation standards for online education [9].
In 2020, most colleges in China were forced to postpone new semesters amidst the Coronavirus Disease 2019 (COVID-19). The college students switched to online education platforms of their schools or even public online education platforms to learn knowledge [10]. This remote learning model transcends the limitations of time and space. The school online education platforms were established to facilitate the autonomous learning and diversify the learning pathways of college students. However, many colleges in China are inexperienced in the platform construction, for online education has been treated as auxiliary means of classroom education. As a result, many platforms are unable to meet the growing learning needs of college students, dampening their enthusiasm about online learning.
To solve the problem, this paper explores the influencing factors on the acceptance of online education platform among college students through questionnaire survey and literature analysis, mines out the defects of existing online education platforms in China, and provides suggestions on stimulating the interest of college students in online education platforms. The research results provide theoretical support to the development of online education in China [11, 12].
The research direction, i.e. exploring the factors affecting the acceptance of online education platform among college students, was determined after reviewing the existing studies on online education platform. To identify these factors, a scientific questionnaire was designed, and used to survey the opinions of college students on online education platform.
In 1980, Martin Fishbein and Icek Ajzen proposed the theory of reasoned action (TRA), which holds that individual behaviors are affected by behavioral intention, which depends on attitude and subjective norm [13]. However, the TRA assumes that most behaviors are under volitional control, failing to consider the effect of personal decisions (e.g. morality, ethics, and view of control).
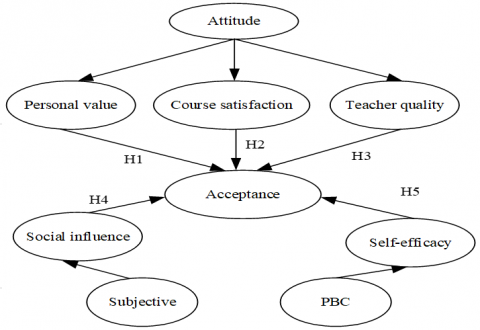
Figure 1. The model for the influencing factors of the acceptance of online education platform among college students
In 1988, Icek Ajzen introduced perceived behavioral control (PBC) into the TRA, giving birth to the theory of planned behavior (TPB). In 1991, Icek Ajzen added behavioral belies, normative beliefs, and control beliefs in front of attitude, subjective norm, and PBC, respectively, and shaped the current theoretical model of the TPB [14]. Inspired by Icek Ajzen’s TPB, this paper establishes a model for the influencing factors of the acceptance of online education platform among college students (Figure 1).
According to the TPB, the influencing factors are determined by acceptance, which in turn depends on attitude, subjective norm, and PBC [15]. Specifically, attitude is mainly affected by personal value, course satisfaction, and teacher quality; subjective norm is mainly affected by social influence; PBC is mainly affected by self-efficacy.
Based on the variables in the model, the following hypotheses were presented:
H1. Personal value has a positive impact on acceptance.
H2. Course satisfaction has a positive impact on acceptance.
H3. Teacher quality has a positive impact on acceptance.
H4. Social influence has a positive impact on acceptance.
H5. Self-efficacy has a positive impact on acceptance.
To verify the above hypotheses, a questionnaire was designed based on the proposed model. The questionnaire comprises of two parts: The first part is about personal information like gender and grade; the second part is the questions designed under the dimensions of attitude, subjective norm, and PBC, using the Likert 5-point scale [16].
A total of 210 electronic questionnaires were issued to college students via online platforms like QQ, WeChat, Weibo, Zhihu, and various forums. After removing the self-contradictory and incomplete responses, 180 (94%) valid responses were obtained for regression analysis [17].
3.1 Descriptive analysis
The gender distribution of the respondents is illustrated in Table 1. It can be seen that the respondents include 93 males, and 87 females. The respondents are distributed relatively evenly in the two genders [18].
Table 2 presents the grade distribution of the respondents. Obviously, most respondents are juniors and seniors. Thus, the grade variable should be combined with other data for analysis.
Table 3 shows the distribution of the respondents in terms of the use of online education platforms. It can be seen that 81.11% of the respondents have used online education platforms, while18.89% have not.
Table 4 shows the distribution of the respondents in terms of the usage time of online education platforms. It can be seen that 50% of the respondents spend 45-60min on online education platforms; 25% spend 60-90min. Hence, 75% of college students spend 45-90min on online education platforms, indicating the importance of these platforms to their learning.
Table 5 lists the online education platforms used by the respondents, and the purposes of using such platforms.
Table 6 displays the proportions of the respondents affected by attitude, subjective norm, and PBC. The data indicate that the college students are indeed influenced by these three factors in their use of online education platforms.
Table 1. The gender distribution of the respondents
|
Variable |
Type |
Number |
Proportion |
|
Gender |
Male |
93 |
51.7% |
|
Female |
87 |
48.33% |
Table 2. The grade distribution of the respondents
|
Variable |
Type |
Number |
Proportion |
|
Grade |
Freshman |
17 |
9.44% |
|
Sophomore |
38 |
21.11% |
|
|
Junior |
55 |
30.56% |
|
|
Senior |
61 |
33.89% |
|
|
Master candidate |
9 |
5% |
Table 3. The use distribution of the respondents
|
Use condition |
Number |
Proportion |
|
Used |
146 |
81.11% |
|
Not used |
34 |
18.89% |
Table 4. The usage time distribution of the respondents
|
Variable |
Type |
Number |
Proportion |
|
Usage time |
<45min 45-60min 60-90min >90min |
31 90 45 14 |
17.22% 50% 25% 7.78% |
Table 5. The online education platforms used by the respondents
|
Platform/purpose |
Platform/purpose |
Proportion |
|
|
Ke.qq.com |
37.32% |
|
|
Koolearn.com |
43.89% |
|
Platform |
Zhihuishu.com |
47% |
|
|
Open.163.com |
48% |
|
|
icourse163.org |
46.32% |
|
|
Other platforms |
14.23% |
|
|
Homework |
75% |
|
Purpose |
Autonomous learning |
65.46% |
|
|
Checking online library |
51.56% |
|
|
Locating and making up deficiencies |
26.31% |
Table 6. The proportions of the respondents affected by attitude, subjective norm, and PBC
|
Influencing factor |
Number |
Proportion |
|
Attitude |
150 |
83.33% |
|
Subjective norm |
145 |
80.56% |
|
PBC |
148 |
82.22% |
3.2 Reliability test
Reliability test aims to verify the reliability of the questionnaire, that is, the consistency between the results of the same object measured repeatedly by the same method. The test result demonstrates how much the measuring method reflects the actual situation [19]. The reliability is positively correlated with credibility. In general, the reliability is evaluated by Cronbach’s alpha (α) [20]. Table 7 shows the reliability test result of our questionnaire.
Table 7. The reliability test result of our questionnaire
|
|
Cronbach’s α |
|
Number of items |
|
Attitude |
.837 |
14 |
5 |
|
Subjective norm |
.867 |
15 |
5 |
|
PBC |
.875 |
16 |
4 |
As shown in Table 7, the Cronbach’s α of every variable in the questionnaire was greater than 0.8, falling into the interval of high reliability. Thus, our questionnaire is highly reliable, and the survey data are suitable for further analysis.
3.3 Validity test
Validity measures how much the measuring method can accurately measure the target features. It can be divided into content validity and construct validity. Content validity means the content of the scale is suitable and representative, and the items are reasonably distributed and capable of reflecting the features of the corresponding index. The content validity of our questionnaire was guaranteed by referring to relevant literature and careful modifications [21].
Construct validity needs to be measured through factor analysis and Bartlett’s test. For the Kaiser-Meyer-Olkin (KMO) measure, it is generally agreed that the construct is not valid unless the value is above 0.7; the factor analysis is supported if the value is between 0.7 and 0.8, applicable if the value is between 0.8 and 0.9 (a sign of good construct validity), and very suitable if the value is greater than 0.9. For Bartlett’s test, the variables have good construct validity if the Sig is smaller than 0.05 [22].
Through factor analysis, the validities of attitude, subjective norm, and PBC in our model are summed up as Tables 8-10, respectively.
As shown in Tables 8-10, the KMO values of the three variables were all greater than 0.7, indicating the suitability of factor analysis. Besides, the df values of Bartlett’s test equaled 0.000, smaller than 0.001. This also testifies the suitability of factor analysis.
Table 8. The validity of attitude
|
KMO and Bartlett’s test |
||
|
KMO measure of sampling adequacy |
.832 |
|
|
Bartlett’s test of sphericity |
Approx. Chi-Square |
356.513 |
|
Df |
10 |
|
|
Sig. |
.000 |
|
Table 9. The validity of subjective norm
|
KMO and Bartlett’s test |
||
|
KMO measure of sampling adequacy |
.829 |
|
|
Bartlett’s test of sphericity |
Approx. Chi-Square |
364.203 |
|
Df |
10 |
|
|
Sig. |
.000 |
|
Table 10. The validity of PBC
|
KMO and Bartlett’s test |
||
|
KMO measure of sampling adequacy |
.812 |
|
|
Bartlett’s test of sphericity |
Approx. Chi-Square |
325.219 |
|
Df |
8 |
|
|
Sig. |
.000 |
|
4.1 Correlation analysis
Correlation analysis describes the correlation between two or more variables in numbers. Two quantitative indices can be obtained through correlation analysis: correlation coefficient and significance index. The correlation does not exist unless the significance index is smaller than 0.05. In addition, the correlation is positively correlated with the absolute value of the correlation coefficient [23].
The results of correlation analysis between personal value and attitude are recorded in Table 11.
It can be seen that the correlation was significant at the 0.01 level. The correlation coefficient was 0.698, indicating that personal value has a positive impact on acceptance (H1).
Table 11. The results of Pearson correlation analysis between personal value and attitude
|
Variable |
Personal value |
Acceptance |
|
|
Personal value |
Pearson correlation |
1 |
.698** |
|
Sig. (2-tailed) |
|
.000 |
|
|
N |
180 |
180 |
|
|
Acceptance |
Pearson correlation |
.698** |
1 |
|
Sig. (2-tailed) |
.000 |
|
|
|
N |
180 |
180 |
|
|
**. Correlation is significant at the 0.01 level (2-tailed) |
|||
Table 12. The results of Pearson correlation analysis between course satisfaction and attitude
|
Variable |
Course satisfaction |
Acceptance |
|
|
Course satisfaction |
Pearson correlation |
1 |
.783** |
|
Sig. (2-tailed) |
|
.000 |
|
|
N |
180 |
180 |
|
|
Acceptance |
Pearson correlation |
.798** |
1 |
|
Sig. (2-tailed) |
.000 |
|
|
|
N |
180 |
180 |
|
|
**. Correlation is significant at the 0.01 level (2-tailed) |
|||
Table 13. The results of Pearson correlation analysis between teacher quality and attitude
|
Variable |
Teacher quality |
Acceptance |
|
|
Teacher quality |
Pearson correlation |
1 |
.624** |
|
Sig. (2-tailed) |
|
.000 |
|
|
N |
180 |
180 |
|
|
Acceptance |
Pearson correlation |
.624** |
1 |
|
Sig. (2-tailed) |
.000 |
|
|
|
N |
180 |
180 |
|
|
**. Correlation is significant at the 0.01 level (2-tailed) |
|||
Table 14. The results of Pearson correlation analysis between social influence and attitude
|
Variable |
Social influence |
Acceptance |
|
|
Social influence |
Pearson correlation |
1 |
.759** |
|
Sig. (2-tailed) |
|
.000 |
|
|
N |
180 |
180 |
|
|
Acceptance |
Pearson correlation |
.759** |
1 |
|
Sig. (2-tailed) |
.000 |
|
|
|
N |
180 |
180 |
|
|
**. Correlation is significant at the 0.01 level (2-tailed) |
|||
Table 15. The results of Pearson correlation analysis between self-efficacy and attitude
|
Variable |
Self-efficacy |
Acceptance |
|
|
Self-efficacy |
Pearson correlation |
1 |
.763** |
|
Sig. (2-tailed) |
|
.000 |
|
|
N |
180 |
180 |
|
|
Acceptance |
Pearson correlation |
.763** |
1 |
|
Sig. (2-tailed) |
.000 |
|
|
|
N |
180 |
180 |
|
|
**. Correlation is significant at the 0.01 level (2-tailed) |
|||
The results of correlation analysis between course satisfaction and attitude are recorded in Table 12. It can be seen that the correlation was significant at the 0.01 level. The correlation coefficient was 0.783, indicating that course satisfaction has a positive impact on acceptance (H2).
The results of correlation analysis between teacher quality and attitude are recorded in Table 13. It can be seen that the correlation was significant at the 0.01 level. The correlation coefficient was 0.624, indicating that teacher quality has a positive impact on acceptance (H3).
The results of correlation analysis between social influence and attitude are recorded in Table 14. It can be seen that the correlation was significant at the 0.01 level. The correlation coefficient was 0.759, indicating that social influence has a positive impact on acceptance (H4).
The results of correlation analysis between self-efficacy and attitude are recorded in Table 15. It can be seen that the correlation was significant at the 0.01 level. The correlation coefficient was 0.763, indicating that self-efficacy has a positive impact on acceptance (H5) [24].
4.2 Regression analysis
Based on factor and correlation analyses, the total variance was examined to obtain Table 16. As shown in Table 16, the extracted principal components contribute to 83.872% of the variance, and represent 83.872% of the data in the samples, far exceeding the threshold of 50%. Therefore, the research variables are valid.
Based on the above data, a regression analysis was performed with attitude, subjective norm, and PBC as explanatory variables, and acceptance of explained variable [25]. The regression models are summarized in Table 17.
The quality of regression equation depends on R-squared. As shown in Table 17, the R-squared of our regression equation was 0.764, and the DW statistic (1.756) was close to 2. This means the regression equation has high goodness of fit. Then, the analysis of variance (ANOVA) table was exported as Table 18. As shown in Table 18, the F ratio was 189.65>3.84, and the sig. was 0.000<0.05, that is, the regression equation is valid.
Next, the coefficient table was exported as Table 19. As can be seen from Table 19, the VIF values of all coefficients were smaller than 10, which eliminates the collinearity problem. The sig. values were all below 0.05, indicating that attitude, subjective norm, and PBC all have a significant impact on acceptance. The standardized coefficients determine how much the explanatory variables affect the explained variable. It can be seen that attitude, subjective norm, and PBC all promote acceptance. The promoting effect of attitude is smaller than that of subjective norm and PBC [26].
Table 16. The total variance explained
|
Total variance explained |
||||||
|
Component |
Initial eigenvalues |
Extraction sums of squared loadings |
||||
|
Total |
% of variance |
Cumulative % |
Total |
% of variance |
Cumulative % |
|
|
1 |
2.453 |
83.872 |
83.872 |
2.569 |
83.872 |
83.872 |
|
2 |
.356 |
11.980 |
94.652 |
|
|
|
|
3 |
.190 |
6.568 |
100.000 |
|
|
|
|
Extraction method: principal component analysis (PCA) |
||||||
Table 17. The model summary
|
Model |
R |
R-squared |
Adjusted R-squared |
Standard error of regression |
Durbin-Watson (DW) statistic |
|
1 |
.878a |
.764 |
.761 |
.49869582 |
1.682 |
|
a. Explanatory variables: (constant), attitude, subjective norm, PBC |
|||||
|
b. Explained variable: acceptance |
|||||
Table 18. The ANOVA table
|
Model |
Sum of squares |
Degrees of freedom (DOFs) |
Mean square |
F ratio |
Sig. |
|
|
1 |
Regression |
137.248 |
3 |
45.082 |
189.65 |
.000b |
|
Error |
44.643 |
176 |
.249 |
|
|
|
|
Total |
179.000 |
179 |
|
|
|
|
|
a. Explanatory variables: (constant), attitude, subjective norm, PBC |
||||||
|
b. Explained variable: acceptance |
||||||
Table 19. The coefficient table
|
Model |
Unstandardized coefficients |
Standardized coefficient |
t |
Sig. |
Collinearity test |
|||
|
B |
Std. Error |
Beta |
Tol. |
VIF |
||||
|
1 |
(Constant) |
-9.731E-17 |
.039 |
|
.000 |
1.000 |
|
|
|
Attitude, |
.100 |
.078 |
.100 |
1.302 |
7.001 |
.241 |
4.126 |
|
|
Subjective norm |
.375 |
.089 |
.365 |
4.157 |
.000 |
.186 |
5.489 |
|
|
PBC |
.459 |
.086 |
.451 |
5.327 |
.000 |
.195 |
5.298 |
|
|
a. Explained variable: acceptance |
||||||||
Note: Tol. and VIF are tolerance and variance inflation factor, respectively.
The descriptive analysis of the survey data, coupled with literature review, confirms that online education platform has become an important aspect of education. Most college students have used various online education platforms. The daily usage time of such platforms falls between 45 and 90min. The main purposes of using such platforms include supporting the learning of professional courses and academic research, supporting the learning of other courses, acquiring the knowledge in specific fields, and improving knowledge and accomplishment. It is clear that college students have considered online education platforms an important learning tool [27].
The acceptance of online education platform among college students is affected by several factors. Regression analysis shows that the acceptance is influenced by attitude, subjective norm, and PBC. The popularity of online education platform among college students is greatly promoted by the convenience of the platform, which is not limited by time or space. The popularity is also enhanced by the recommendation by teachers and schoolmates, the abundance of course resources, and teacher quality.
Based on the above results, several suggestions were presented to further promote online education platforms among college students: Online education platforms in China should hire professional talents and invest more in platform development; increase publicity and coverage of their platforms; diversify the course resources, and arouse the students’ enthusiasm for autonomous learning; design more interactive functions to enhance the sense of participation; cooperate with colleges and enterprises to share valuable resources.
Of course, this research faces several limitations: First, the questionnaire survey mainly focuses on college students in a region, rather than those across the country. The results might not be representative on the national scale. Second, the questionnaire survey does not consider the difference between online education platforms, and the influencing factors were categorized rather roughly. To promote the online education development in China, the future research will further explore the influence of more factors over the acceptance of different online education platforms among college students from many regions.
[1] Norman, H., Nordin, N., Yunus, M., Ally, M. (2018). Instructional design of blended learning with MOOCs and social network analysis. Advanced Science Letters, 24(11): 7952-7955. https://doi.org/10.1166/asl.2018.12464
[2] Sun, Y., Chai, R.Q. (2020). An early-warning model for online learners based on user portrait. Ingénierie des Systèmes d’Information, 25(4): 535-541. https://doi.org/10.18280/isi.250418
[3] Ting, S.R., Smith, A.C., Gomez, E. (2018). E-Learning in China: Progress, Challenges, and Research Issues, Digital Transformation and Innovation in Chinese Education, 17. https://doi.org/10.4018/978-1-5225-2924-8.ch001
[4] Bruns, A. (2019). After the ‘APIcalypse’: Social media platforms and their fight against critical scholarly research. Journal of Information, Communication & Society, 22: 1544-1566. https://doi.org/10.1080/1369118X.2019.1637447
[5] Picciano, A.G. (2017). Theories and frameworks for online education: Seeking an integrated model. Online Learning, 21(3): 166-190.
[6] Aldowah, H., Al-Samarraie, H., Ghazal, S. (2019). How course, contextual, and technological challenges are associated with instructors’ individual challenges to successfully implement e-learning: A developing country perspective. IEEE Access, 7: 48792-48806. https://doi.org/10.1109/ACCESS.2019.2910148
[7] Zhang, Y.S. (2014). Discussion on the curriculum design and implementation of Data Structure based on MOOC platform. Modern Computer (Pro), 17: 8-10, 17. https://doi.org/10.3969/j.issn.1007-1423(z).2014.17.002
[8] Chen, B., Peng, S.Y. (2018). Comparative Study on Online Education teaching between Chinese and American higher Education in the Era of Cloud Learning. Academic Journal of Education, 8: 96-103. https://doi.org/CNKI:SUN:YANG.0.2018-08-013
[9] Kebritchi, M., Lipschuetz, A., Santiague, L. (2017). Issues and challenges for teaching successful online courses in higher education: A literature review. Journal of Educational Technology Systems. https://doi.org/10.1177/0047239516661713
[10] Ohanu, I.B., Chukwuone, C.A. (2018). Constraints to the use of online platform for teaching and learning technical education in developing countries. Education and Information Technologies, 23(6). https://doi.org/10.1007/s10639-018-9757-8
[11] Chen, T.G., Peng, L.J., Yin, X.H., Rong, J.T., Yang, J.J., Cong, G.D. (2020). Analysis of user satisfaction with online education platforms in china during the COVID-19 pandemic. MDPI, Healthcare, 8(3): 200. https://doi.org/10.3390/healthcare8030200
[12] Bacos, C., Grove, K. (2019). Using online education to improve traditional classroom instruction: A blended learning approach. Society for Information Technology & Teacher Education International Conference, Las Vegas, NV, United States, 374-379. https://www.learntechlib.org/primary/p/207667/
[13] Azjen, I. (1991). The theory of planned behavior. Organizational Behavior and Human Decision Processes, 50(2): 176-211.
[14] Ajzen, I. (1985). From Intentions to Actions: A Theory of Planned Behavior. Action Control. Berlin, Heidelberg: Springer Berlin Heidelberg, 11–39. https://doi.org/10.1007/978-3-642-69746-3_2
[15] Guo, Q.K., Zhou, J. (2004). Validity of different IRT models in Likert scale analysis. New Insights in Psychology, 2004(3): 67-70.
[16] Tsai, H.L., Lu, C.Y., Hsieh, J.S., Wu, D.C., Jan, C.M., Chai, C.Y., Chu, K.S., Chan, H.M., Wang, J.Y. (2007). The prognostic significance of total lymph node harvest in patients with T2–4N0M0 colorectal cancer. Journal of Gastrointestinal Surgery, 11: 660-665. https://doi.org/10.1007/s11605-007-0119-x
[17] Wang, N., Sun, L.M. (2018). Investigation and analysis of college students' informal learning in the context of mobile internet. Think Tank Age, 48: 67+69. https://doi.org/CNKI:SUN:ZKSD.0.2018-48-044
[18] Chuang, K.C., Pillsbury, M.S., Walters, M.R., Hayward, R.A. (1998). Reliability and validity testing of the Michigan Hand Outcomes Questionnaire. The Journal of Hand Surgery, 23(4): 569-771. https://doi.org/10.1016/S0363-5023(98)80042-7
[19] Ibnugraha, P.D., Nugroho, L.E., Santosa, P.I. (2020). Reliability analysis of risk model metrics based on business approach in information security. Ingénierie des Systèmes d’Information, 25(4): 475-480. https://doi.org/10.18280/isi.250410
[20] Qi, Y.Z., Liang, K.X., Liu, Z.J. (2020). Impact of multichannel integration service quality on retailer brand equity: The mediating role of brand trust. International Journal of Sustainable Development and Planning, 15(4): 585-592. https://doi.org/10.18280/ijsdp.150419
[21] Yang, T. (2017). Research on behavioral model of WeChat public platform users in university library. Qufu Normal University, 2: 95-103.
[22] Sasaki, N., Watanabe, K., Kawakami, N. (2020). Personal values in adolescence and their associations with metabolic biomarkers in adulthood: A Japanese population-based study. Research Square, 14(1). https://doi.org/10.1186/s13030-020-00197-5
[23] Trafimow, D. (2019). A frequentist alternative to significance testing, p-Values, and confidence intervals. Econometrics, 7(2): 26. https://doi.org/10.3390/econometrics7020026
[24] Zhong, Y.Q., Huang, Z.H., Wu, L.H. (2016). Analysis of differences in farmers' willingness and behaviors to join cooperatives. Journal of Northwest A&F University (social science edition), 16(6): 66-74. https://doi.org/10.13968/j.cnki.1009-9107.2016.06.10
[25] Human Aspects of IT for the Aged Population (2015). Design for Everyday Life. First International Conference, ITAP 2015, Held as Part of HCI International 2015, Los Angeles, CA, USA, August 2-7, 2015. Proceedings, Part I. https://doi.org/10.1007/978-3-319-20892-3
[26] Jiang, F.Y., Wang, H.W., Lan, X.M. (2019). Higher vocational colleges using e-class network platform to promote the construction of style of study. Higher Education Forum, 7: 103-106, 124.
[27] Zhu, M., Gen, M., Hajiyev, A., Cooke, F.L. (2018). Proceedings of the eleventh international conference on management science and engineering management. Springer Science and Business Media LLC. https://doi.org/10.1007/978-3-319-59280-0