Zhongqiu Cao
© 2020 IIETA. This article is published by IIETA and is licensed under the CC BY 4.0 license (http://creativecommons.org/licenses/by/4.0/).
OPEN ACCESS
This paper mainly explores the classification of text digital teaching resources. Considering the features of the educational field, the weight calculation method of term frequency-inverse document frequency (TF-IDF) algorithm and the k- nearest neighbor (KNN) algorithm were separately improved, and combined into a novel classification method for digital teaching resources. In the improved TF-IDF algorithm, the intra-class or inter-class distribution of the occurrence frequency of feature terms is determined, making the weight calculation more accurate. By contrast, the classification accuracy of traditional TF-IDF algorithm is limited, because the algorithm only considers term frequency (TF) and inverse document frequency (IDF). The improved KNN algorithm is grounded on density cutting of intra-class and boundary regions, thereby solving the defects of the traditional KNN facing the uneven distribution of sample density of digital teaching resources. The density cutting ensures the uniform distribution of samples and reduce the time required for classification. Experimental results show that the KNN-based digital teaching resource classification method is feasible and effective.
data mining, k-nearest neighbor (KNN) algorithm, term frequency-inverse document frequency (TF-IDF) algorithm, digital teaching resources, density cutting
The popularization of digital education has enriched various kinds of digital teaching resources. The vast amount of digital teaching resources is extremely complex, lacking effective organization and management. Text resources are the most common type of digital teaching resources. In the past, text resources are usually classified manually. The manual classification is quite accurate facing a small amount of resources. However, with the growing scale of resources, this classification method is no longer efficient and more and more inaccurate with the elapse of time. As a result, it is an urgent task to effectively classify digital teaching resources.
As a machine learning (ML) technology, automatic text classification [1] can effectively organize and manage text information. During the classification, the target text is calculated by the given classifier under certain rules, and then automatically divided into the corresponding classes. Owing to its fast speed and high precision, automatic text classification is widely regarded as the primary method for classifying digital teaching resources. However, digital teaching resources are currently classified by the general classification algorithm, which does not consider the features of the education field. Therefore, the classification effect needs to be further improved.
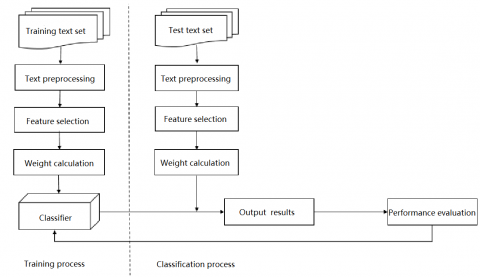
Figure 1. The workflow of text classification
As shown in Figure 1, text classification mainly includes a training process and a classification process. The former involves text preprocessing, feature selection, weight calculation, classifier selection, and classifier training. The latter covers new text classification, result output, and performance evaluation.
Considering the features of text digital teaching resources, this paper improves the traditional weighting method of term frequency-inverse document frequency (TF-IDF) algorithm and the k-nearest neighbor (KNN) algorithm, and successfully applied the improved methods to classify text digital teaching resources in an effective manner.
The research of text classification can be divided into three stages: theoretical research, experimental exploration, and practical application. With the maturity of relevant technologies, many practical applications of text classification have emerged, such as the email classification system developed by Massachusetts Institute of Technology (MIT), and the SWITH system for automatic classification of web search results.
The main classification algorithms in the practical research are: support vector machine (SVM) [2], KNN [3], Naive Bayes [4], decision tree (DT) [5] and artificial neural network (ANN) [6]. These algorithms have been improved repeatedly in accuracy and speed. According to the statistical features of the Chinese language, Guo et al. [7] proposed a Chinese text classification method through case mapping and text representation using the word frequency vector. Parimala and Palanisamy [8] studied the feature selection method based on evaluation function, and calculated weight function by replacing IDF function with evaluation function. Yin and Xi [9] classified text resources with the maximum entropy model. Zhou and El-Gohary [10] improved the rule extraction method of text classification, drawing on the features of information entropy and genetic algorithm (GA). Based on clustering and weight allocation, Luo et al. [11] improved the KNN algorithm to solve the negative impact of unbalanced datasets. Sun and Bin [12] presented an efficient classification method based on latent semantic index and the ANN of self-organizing map (SOM).
The most important difference between Chinese text classification and English text classification is word segmentation. Space character, which can effectively cut English text, is not suitable for Chinese text. Special rules are needed to segment Chinese text. There are roughly three kinds of Chinese text classification methods, namely, string matching-based methods [13], understanding-based methods [14], and statistics-based methods [15]. Trigano et al. [16] proposed a Chinese text classification strategy based on chaotic owl search algorithm (COSA), which outperforms the classification algorithm based on Euclidean distance. Considering the features of high data dimension and sparse data space, Adenis et al. [17] developed a text classification algorithm based on semantic inner product space model.
TF weight calculation aims to measure the importance of feature items by their frequency in the text. The core concept of TF-IDF is that a feature contributes more to classification if it appears more frequently in a text than in other texts. The weight calculation can effectively improve the accuracy of text classification.
3.1 TF-IDF weight calculation
The calculation of TF-IDF can be defined as:
$\operatorname{TFIDF}\left(D_{i}, T_{k}\right)=W_{i k}=T F_{i k} \times I D F_{k}$ (1)
where, Wik is the weight of feature item Tk in text Di; TFik is the frequency that feature item Tk appears in text Di.
The core concept of IDF is that the distinguishability of feature term Tk is negatively correlated with the number of texts containing this term.
The TFik can be defined as:
$T F_{i k}=S_{i k} / \sum_{j=1}^{n} S_{i j}$ (2)
where, Sik is the number of times that feature Tk appears in text Di.
The value of TFik increases with the frequency of occurrence of feature term Tk. The IDFk can be defined as:
$I D F_{k}=\log N / N_{k}$ (3)
where, N is the total number of texts in the training set; Nk is the number of texts containing feature term Tk in the training set.
When the number of N is fixed, the importance of the feature is positively correlated with $N_{k}$ and negatively with IDF.
Then, formula (1) can be redefined as follows:
$W_{i k}=T F_{i k} \times I D F_{k}=S_{i k} / \sum_{j=1}^{n} S_{i j} \times \log N / N_{k}$ (4)
where, Sik and Nk are the main factors determining the value of Wik. Sik is proportional to Wik, and Nk is inversely proportional to Wik.
Despite its superiority over other weight calculation methods, TF-DIF fails to consider the distribution of texts containing feature term Tk among different classes, that is, whether the texts with feature items is concentrated in a text class or evenly distributed across text classes.
3.2 Improved TF-IDF method
This section improves the traditional TF-IDF algorithm as follows: Firstly, the frequency distribution of feature term Tk in one text class Ci and other classes was measured; Then, the proportion of text with feature term Tk in class Ci was considered; Finally, whether the frequency distribution of feature term Tk is balanced in Ci text with feature term Tk was evaluated. The specific steps of the improvement are explained below.
Step 1. Determine whether the frequency of feature term Tk in the training set is concentrated in a class Ci or evenly distributed across different classes. If the term appears in class Ci, the feature must have a strong distinguishability in that class, and should be given a high weight. In this case, parameter TDik can be introduced as the metric:
$T D_{i k}=T F_{i k} / T F_{k}$ (5)
where, TFik is the occurrence frequency of feature term Tk in class Ci; TFk is the occurrence frequency of feature term Tk in the whole training set. The greater the TFik, the higher the proportion of the frequency distribution of feature items in class Ci. The greater the TDik, the stronger the distinguishability of feature term Tk for Ci.
Step 2. Determine whether the frequency distribution of feature term Tk in class Ci is included in most texts of class Ci or concentrated in a few texts. In class Ci, the higher the proportion of texts containing feature term Tk is, the stronger the distinguishability of feature item for class Ci, and the higher weight to be assigned to the feature item. In this case, parameter CDik can be introduced as the metric:
$C D_{i k}=N P_{i k} / N P_{i}$ (6)
where, NPik is the number of texts containing the feature term Tk in class Ci; NPi is the total number of texts in class Ci. When TDik remains unchanged, a large NPikmeans feature Tk is contained in many texts of class Ci, and the CDik has a large value. This means the higher the proportion of the texts containing the feature item in class Ci, the stronger the distinguishability of the feature item for class Ci.
Step 3. Judge whether the frequency distribution of feature term is uniform in every text with feature term Tk in class Ci. If the distribution is uniform, the feature item must be highly distinguishable, and should be assigned a high weight. In this case, parameter MFik can be introduced as the metric:
$M F_{i k}=\sum_{j=1}^{N P_{i k}}\left(T F_{i k}-\overline{T F}_{i}\right)^{2} / N P_{i k}$ (7)
where, $\overline{T F}_{i}$ is the average occurrence frequency of Tk in texts containing feature term Tk in class Ci. The deviation degree of feature term Tk in class Ci can be derived from variance.
Setting parameter MTC to $M F_{i k} * T D_{i k} * C D_{i k}$ , the improved weight calculation formula can be derived from formulas (5)-(7) as:
$\begin{aligned}
W_{i k}=T F_{i k} \times I D F_{k} & \times M T C \\
&=S_{i k} / \sum_{j=1}^{n} S_{i j} \times \log N / N_{k} \\
& \times T F_{i k} / T F_{k} \times N P_{i k} / N P_{i} \\
& \times \sum_{j=1}^{N P_{i k}}\left(T F_{i k}-\overline{T F}_{i}\right)^{2} / N P_{i k}
\end{aligned}$ (8)
The KNN algorithm, as one of the best classifiers, is excellent in solving multi-class problem. The core idea is that, in the feature space, if the K samples closest to the target samples belong to a class, then the target samples must also belong to this class.
Text similarity is used to measure the distance between two texts. Euclidean distance method [18] and angle cosine method are commonly used to calculate the similarity. In this paper, the angle cosine method, which is more suitable for KNN, is adopted:
$\begin{array}{l}
\operatorname{sim}\left(d_{i}, d_{j}\right) \\
=\sum_{k=1}^{n} w_{i k} \times w_{j k} / \sqrt{\left(\sum_{k=1}^{n} w_{i k}^{2}\right)\left(\sum_{k=1}^{n} w_{j k}^{2}\right)}
\end{array}$ (9)
where, di and dj are any two texts i and j in the training set; n is the total dimension of the eigenvector; Wik and Wjk are the weight of feature item in the text vector of texts di and dj, respectively.
The greater the cosine value Sim(di, dj), the smaller the angle between the vectors of the two texts, and the higher the similarity between the two vectors.
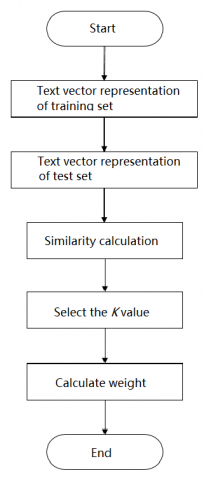
Figure 2. The workflow of the KNN algorithm
As shown in Figure 2, the KNN algorithm can be implemented in the following steps:
Step 1. Represent each text in the training set by vector space model, and take the weight of each dimension feature as the result of improved TF-IDF method.
Step 2. Represent each text in the test set by vector space model, and take the weight of each dimension feature as the result of improved TF-IDF method.
Step 3. Calculate the spatial distance, that is, the text similarity Sim(X, Dj), between the target text in the test set and each text in the training set.
Step 4. Sort the calculated Sim(X, Dj) values in descending order, and select the K training set texts with the highest similarity to target text X.
Step 5. Count the distribution of the selected K texts in each class, and allocate the target texts into the class of the most texts.
During the classification of digital teaching resources, it is common to have the same number of texts in several classes. In this situation, the weight of the target text in each class should be calculated according to the classes of the K most similar texts.
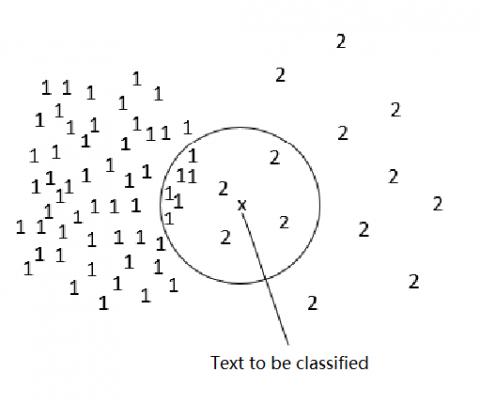
Faced with digital teaching resources, the traditional KNN algorithm has two defects: a high computing load is incurred if there are many texts in the training set; misclassification may arise as the samples are unevenly distributed across different classes. The uneven distribution of samples is shown in Figure 3.
Figure 3. An example of the uneven distribution of samples
In the example of Figure 3, the target text ought to be classified into class 2. However, when K = 10, class 1 contains 6 most similar texts, far denser than class 2, which contains 4 most similar texts. In this case, the target text is classified incorrectly to class 1.
The computing load of the KNN algorithm can be reduced in two ways: (1) optimizing the search efficiency of the nearest neighbors of the target text; (2) reducing the size of the training set by selecting the most representative samples from the original training set, forming a new training set, or deleting some samples from the sample set and taking the remaining ones as the new training set.
Following the second approach, this paper improves the KNN algorithm based on density cutting, aiming to lower the time complexity and avoid the incorrect classification induced by the uneven distribution of samples in training set.
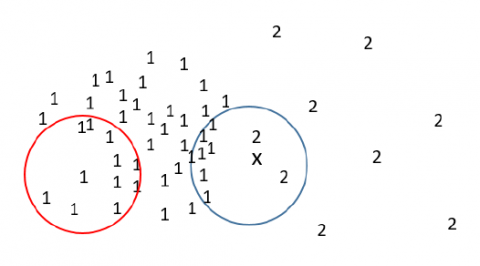
Figure 4. The sketch map of intra-class region and boundary region
As shown in Figure 4, high density areas were divided into an intra-class region (red circle), and a boundary region (blue circle). The high-density cutting strategies for the two regions are explained separately.
In the intra-class region, for text y in the high-density region, the number of texts was reduced in the high-density region in the ε-neighborhood of y, making the density of y and the nearby texts more uniform.
In the boundary region, it is judged whether any other text falls within the high-density region in the ε-neighborhood of x; if yes, the text was cut.
The overall workflow of our density cutting scheme is illustrated in Figure 5.
Figure 5. The workflow of density cutting scheme
From the above process, it can be seen that the time complexity of the sample cutting is O(2n), while the time complexity of traditional KNN algorithm is O(n2). Besides, the time complexity of the improved algorithm will decrease, because n decreases with the cutting process of training set.
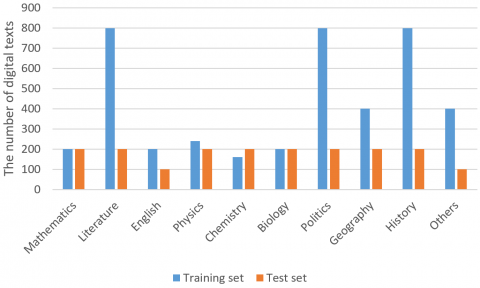
The experimental dataset contains 6,000 digital texts evenly distributed in 10 classes: mathematics, literature, English, physics, chemistry, biology, politics, geography, history, and others. The dataset was divided into a training set of 4,200 texts, and a test set of 1,800 texts. The distribution of the digital texts is shown in Figure 6.
Figure 6. The distribution of the digital texts
With the feature dimension of 500 and K value of 15, the classification effects of traditional TF-IDF and improved TF-IDF were compared (Table 1).
Table 1. The classification effects of traditional TF-IDF and improved TF-IDF
|
Category |
TF-IDF |
Improved TF-IDF |
||||
|
|
Recall |
Precision |
F1-statistic |
Recall |
Precision |
F1-statistic |
|
Mathematics |
77% |
83.72% |
80.78% |
81% |
85.61% |
82.17% |
|
Literature |
81% |
79.19% |
80.65% |
87% |
84.72% |
85.82% |
|
English |
76% |
96.87% |
86.31% |
76% |
97.82% |
86.78% |
|
Physics |
74% |
88.26% |
80.02% |
75% |
88.38% |
81.72% |
|
Chemistry |
75% |
85.61% |
78.90% |
79% |
86.72% |
82.81% |
|
Biology |
72% |
82.58% |
76.91% |
75% |
85.19% |
79.05% |
|
Politics |
76% |
80.18% |
78.28% |
74% |
83.42% |
78.92% |
|
Geography |
71% |
85.39% |
76.39% |
73% |
85.92% |
77.59% |
|
History |
81% |
79.05% |
80.18% |
80% |
81.09% |
81.39% |
|
Others |
62% |
73.38% |
71.35 |
69% |
74.28% |
73.81% |
As shown in Table 1, the improved TF-IDF achieved better precision and recall in most classes, except for the slightly lower recalls in politics and history and the comparable recall in English. In addition, the improved TF-IDF had much better F1-statistic, a comprehensive evaluation index, in various classes. The results show that the improved TF-IDF outshines the traditional TF-IDF in weight allocation and classification.
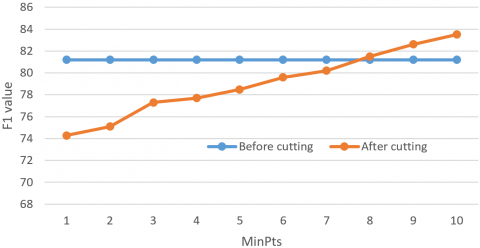
Next, the classification effect and time before and after the density cutting were compared. The minimum number of samples (MinPts) was changed from 1 to 11, and the training set was processed by our density cutting scheme. The variation of cutting ratio with MinPts is presented in Table 2. The corresponding effect of cutting ratio is shown in Figure 7. Figure 8 compares the F1-statistics after classification using the training sets before and after density cutting.
It can be seen from Figure 7 that the cutting ratio decreased with the increase of MinPts. From Figure 8, it is observed that, when MinPts fell between 8 and 11, better F1-statistc was obtained using the improved KNN algorithm based on density cutting. Therefore, the proposed method achieves desirable classification results.
Table 2. The variation of cutting ratio with MinPts
|
MinPts |
The cutting number |
The cutting ratio |
|
1 |
1,025 |
48.80% |
|
2 |
881 |
41.95% |
|
3 |
741 |
35.28% |
|
4 |
667 |
31.76% |
|
5 |
614 |
29.24% |
|
6 |
568 |
27.05% |
|
7 |
517 |
24.62% |
|
8 |
481 |
22.90% |
|
9 |
447 |
21.29% |
|
10 |
421 |
20.05% |
|
11 |
403 |
19.19% |
Figure 7. The corresponding effect of cutting ratio
Figure 8. The comparison of F1-statistics before and after cutting
Considering the features of text digital teaching resources, this paper optimizes the text preprocessing process by improving the traditional TF-IDF algorithm. In the improved algorithm, the intra-class or inter-class distribution of the occurrence frequency of feature terms is determined, making the weight calculation more accurate. In addition, the traditional KNN algorithm was improved based on density cutting to solve the problems of the traditional algorithm in the classification of digital teaching resources. Experimental results show that the KNN-based digital teaching resource classification method is feasible and effective.
Supported by the Fund for Humanities and Social Sciences of Henan Province (Grant No.: SKJYB2019-02), China.
[1] Agnihotri, D., Verma, K., Tripathi, P. (2018). An automatic classification of text documents based on correlative association of words. Journal of Intelligent Information Systems, 50(3): 549-572. https://doi.org/10.1007/s10844-017-0482-3
[2] Thanh Noi, P., Kappas, M. (2018). Comparison of random forest, k-nearest neighbor, and support vector machine classifiers for land cover classification using Sentinel-2 imagery. Sensors, 18(1): 18. https://doi.org/10.3390/s18010018
[3] Gallego, A.J., Calvo-Zaragoza, J., Valero-Mas, J.J., Rico-Juan, J.R. (2018). Clustering-based k-nearest neighbor classification for large-scale data with neural codes representation. Pattern Recognition, 74: 531-543. https://doi.org/10.1016/j.patcog.2017.09.038
[4] Kim, S.B., Han, K.S., Rim, H.C., Myaeng, S.H. (2006). Some effective techniques for naive bayes text classification. IEEE Transactions on Knowledge and Data Engineering, 18(11): 1457-1466. https://doi.org/10.1109/TKDE.2006.180
[5] Bilal, M., Israr, H., Shahid, M., Khan, A. (2016). Sentiment classification of Roman-Urdu opinions using Naïve Bayesian, Decision Tree and KNN classification techniques. Journal of King Saud University-Computer and Information Sciences, 28(3): 330-344. https://doi.org/10.1016/j.jksuci.2015.11.003
[6] Alanis, A.Y. (2018). Electricity prices forecasting using artificial neural networks. IEEE Latin America Transactions, 16(1): 105-111. https://doi.org/10.1109/TLA.2018.8291461
[7] Guo, X., Sun, H., Zhou, T., Wang, L., Qu, Z., Zang, J. (2015). SAW Classification Algorithm for Chinese Text Classification. Sustainability, 7(3): 2338-2352. https://doi.org/10.3390/su7032338
[8] Parimala, K., Palanisamy, V. (2012). Enhanced Performance of Search Engine with Multi-Type Feature Co-Selection for Clustering Algorithm. International Journal of Computer Applications, 53(7): 6-9. https://doi.org/10.5120/8431-2203
[9] Yin, C., Xi, J. (2017). Maximum entropy model for mobile text classification in cloud computing using improved information gain algorithm. Multimedia Tools and Applications, 76(16): 16875-16891. https://doi.org/10.1007/s11042-016-3545-5
[10] Zhou, P., El-Gohary, N. (2016). Domain-specific hierarchical text classification for supporting automated environmental compliance checking. Journal of Computing in Civil Engineering, 30(4): 04015057. https://doi.org/10.1061/(ASCE)CP.1943-5487.0000513
[11] Luo, Y., Wang, M., Le, Z., Zhang, H. (2012). An improved kNN text categorization algorithm based on cluster distribution. Journal of Computational Information Systems, 8(3): 1255-1263.
[12] Sun, G., Bin, S. (2019). Research on Public Opinion Propagation Model in Social Network Based on Blockchain. CMC-Computers, Materials & Continua, 60(3): 1015-1027.
[13] Islam, A., Inkpen, D., Kiringa, I. (2008). Applications of corpus-based semantic similarity and word segmentation to database schema matching. The VLDB Journal, 17(5): 1293-1320. https://doi.org/10.1007/s00778-007-0067-9
[14] Cohen, J.D. (1998). An n‐gram hash and skip algorithm for finding large numbers of keywords in continuous text streams. Software: Practice and Experience, 28(15): 1605-1635. https://doi.org/10.1002/(SICI)1097-024X(19981225)28:15<1605::AID-SPE217>3.0.CO;2-C
[15] Deng, X.Y., Wang, C. (2018). A hybrid collaborative filtering model with context and folksonomy for social recommendation. Ingénierie des Systèmes d’Information, 23(5): 139-157. https://doi.org/10.3166/ ISI.23.5.139-157
[16] Trigano, T., Shevtsov, I., Luengo, D. (2017). CoSA: An accelerated ISTA algorithm for dictionaries based on translated waveforms. Signal Processing, 139: 131-135. https://doi.org/10.1016/j.sigpro.2017.04.004
[17] Adenis, P., Wen, Y., Ray, A. (2012). An inner product space on irreducible and synchronizable probabilistic finite state automata. Mathematics of Control, Signals, and Systems, 23(4): 281-310. https://doi.org/10.1007/s00498-012-0075-1
[18] Lu, X.M., Wu, Q., Zhou, Y., Ma, Y., Song, C.C., Ma, C. (2019). A dynamic swarm firefly algorithm based on chaos theory and Max-Min distance algorithm. Traitement du Signal, 36(3): 227-231. https://doi.org/10.18280/ts.360304