Mohamed Ksantini | Nesrine Kadri | Ameni Ellouze* | Sameh Hbaieb Turki
© 2020 IIETA. This article is published by IIETA and is licensed under the CC BY 4.0 license (http://creativecommons.org/licenses/by/4.0/).
OPEN ACCESS
Since the COVID-19 pandemic surges around the world and officially entered a dangerous new phase, one of the important concerns is when to take aggressive public health measures to slow the spread of COVID-19 and to know impact of the use of protection tools. Many studies have dealt with the prediction of the evolution of cases affected by the COVID-19 virus. Given the unreliability of the data collected about the number of new cases and the uncertainties in values, the results found cannot be accurate and present a bias. In this paper, we will present a study using artificial intelligence algorithms more precisely machine and deep learning algorithms to predict the evolution of cases reached by COVID-19 in the future given the application of confinement and the use of protection tools. To improve the accuracy of the results and to take into account the uncertain aspect of the data we will apply the theory of belief functions. Among objectives of this theory is the fusion of different sources of information, given by artificial intelligence algorithms in our case, in order to obtain a global knowledge in the form of a more precise and reinforced belief function. Results shows that applying the home isolation and the use of protection tools with the rate over of 80% can reduce considerably the number of cases.
artificial intelligence, machine learning, deep learning, COVID-19, belief functions, pandemic, home isolation, Dempster-Shafer theory
In December 2019, Wuhan, Hubei province, China, became the centre of an outbreak of pneumonia of unknown cause, which raised intense attention not only within China but internationally [1]. On 12 March, it rapidly declared a pandemic by the World Health Organization followed by an increasing number of confirmed cases in the European regions (more than 20,000 confirmed cases and nearly 1,000 deaths).
The outbreak of COVID-19 is likely to cause a wide range of diseases. In humans, these diseases range from a common cold to a severe pulmonary infection, responsible for acute respiratory distress.
The Coronavirus Study Group of the International Committee on Taxonomy of Viruses has proposed that this virus be designated severe acute respiratory syndrome coronavirus 2 (SARS-CoV-2) [2].
Studies have shown that this virus is transmitted from one person to another through respiratory secretions when an infected person coughs, sneezes or talks. One of the most important transmission factors is contact of the hands with infected surfaces and then touches his or her eyes, nose, or mouth. Depending on temperature and humidity, the virus can survive a few hours or even a few days on various surfaces if they are not disinfected.
Despite the efforts made by medical research laboratories, there is no specific treatment of COVID-19. However, protective measures present the main strategy stream that most countries have adopted to stop the infection spread of the pandemic such as physical distancing measures to reduce person-to-person contact and the minimize the frequency of contacts in different age groups and locations (schools, workplaces, households, and others) [3].
During the study of epidemics, one of the most significant and challenging problem is to forecast the future trends, like how many individuals might be infected each day. For solving this problem, model the evolution and spread of the epidemic is considered a powerful tool for investigating human infectious diseases, providing useful predictions about the potential transmission of the virus and the effectiveness of possible control measures, which can provide valuable information for public health policy makers. In the COVID-19 cases, epidemiological models are ideal for predicting the number of new cases or for identifying the best measures to reduce transmission.
There are various classifications of epidemiological models [4-7]. We focus in this paper on prediction models which based on Artificial Intelligence algorithms [8, 9].
Predictive Modeling brings together a set of methods for collecting and analyzing defined data, to interpret it to deduce forecasts for future trends, future events or the behavior of consumers in the future. The plausibility of the results of the prognostic models must be reported statistically. Their probability is then conceivable depending on the size of all the data studied. Thus, the greater the number of data analyzed, the more the results of the prognosis models can be considered as foreseeable and precise results. However, there is no guarantee that the actual output data will occur [10].
Our goal is to define a predictive model that provide a dynamic view of evolution of diseases cases given by artificial intelligence algorithms according to the various features such as security measures in order to obtain a global knowledge in the form of a more precise and reinforced belief function.
Machine and Deep learning are two disciplines of Artificial Intelligence used to classify and predict phenomena in large scale of fields. The performance of algorithms used in machine and deep learning depends on the nature and the origin of data. They will be applied to determine the best accuracy based on the considered data.
In our case, we will use data from World Health Organization (WHO) to predict the evolution of cases affected by the COVID-19 in the future given the application of confinement and prevention tools.
2.1 Machine learning
In the field of the artificial intelligence in medicine, many methods can be used in machine learning like Random Forest and Xgboost [11-14]. Hence, Li et al. [11] proposed an orthopedic auxiliary classification prediction model based on XGBoost algorithm. The experimental data were obtained from the clinical case information of femoral neck patients in Department of Bone and Soft Tissue Tumor Surgery, Cancer Hospital of China Medical University, Liaoning Cancer Hospital & Institute. The XGBoost algorithm classification prediction model has higher accuracy, faster calculation speed, and more applicability in orthopedic clinical data. It can cope with complex and diverse medical data, and can better meet the requirements of timeliness and accuracy of auxiliary diagnosis.
2.2 Deep learning
The LSTM is an artificial recurrent neural network (RNN) architecture used in the deep learning. It is developed to deal with the gradient problem. It can not only process single data points but also entire sequences of data.
LSTM networks have been used to classify, process and predict based on time series data, since there can be lags of unknown duration between important events in a time series.
Bidirectional LSTMs (BiLSTMs) are an extension of traditional LSTMs that can improve model performance on sequence classification problems where the authors proposed a deep network with four convolutional layers followed by two LSTM layers [15, 16].
The Dempster-Shafer (DS) theory of belief functions represents the formalism for making decisions with uncertainty [17-19]. This theory has been applied to pattern recognition and especially to supervise classification. The outputs of classifiers have been expressed as belief functions and have been combined with the Dempster’s rule in the case of classifier fusion [20-24]. The approach was the conversion of the decisions obtained from classifiers such as the conversion of the SVM into belief functions [25, 26].
The basics of DS theory:
-Representation of the information: Mass functions
-Correction of the information
-Fusion of the information: Rule of Dempster
-Decision making
In the case of representation of the information, the mass function m represents an element of evidence X with value in Ω and m (A) quantifies the belief allocated to the proposition. It is defined by:
$\mathrm{m}: 2^{\Omega} \rightarrow[0,1]$ with $\Sigma_{\mathrm{A} \subseteq \Omega} \mathrm{m}(\mathrm{A})=1$ (1)
In the case of correction of information, we have the mass function m and the belief degree in the reliability of the source $\mu$. The new mass function of the weakening operation is:
$\mu_{m}(A)=\mu * m(A) ; \forall A \neq \Omega$ (2)
In the case of information fusion, we have the mass function m1 obtained from the source S1 and the mass function m2 obtained from the source S2. The new mass function after the use of Dempster’ rule is defined by:
$(\mathrm{m} 1 \oplus \mathrm{m} 2)(\mathrm{C})=\Sigma_{\mathrm{A}, \mathrm{B}: \mathrm{C}=\mathrm{A} \cap \mathrm{B}} \mathrm{m} 1(\mathrm{A}) * \mathrm{m} 2(\mathrm{B})$ (3)
In the case of decision making, we need a pignistic transformation which represents the probability distribution obtained from the fusion result. This transformation is defined by:
$\operatorname{Betp}(\mathrm{w})=\Sigma_{\{\mathrm{A} \subseteq \Omega, \mathrm{w} \in \mathrm{A}\}}(\mathrm{m}(\mathrm{A}) /(1-\mathrm{m}(\emptyset)|\mathrm{A}|$ (4)
The decision will be made by choosing the element x with the greatest probability from pignistic transformation:
$\operatorname{Rp}(\mathrm{x})=\underset{\mathrm{X} \in \Omega}{\operatorname{argmax}} \operatorname{Betp}(\mathrm{w})(\mathrm{x})$ (5)
As mentioned previously, the goal of this paper is to predict the case of the COVID-19 virus evolution in order to curb its spread. In the case, our approach is based on a fourth-step method:
-First, we have studied the data processing. In this case, we have chosen countries where the pandemic started early such as France, Italy, Spain and USA and counties when the pandemic started later such as Tunisia, Algeria, Morocco and Belgium.
-Second, we have used machine and deep learning algorithms to classify the confirmed cases.
-Third, the fusion of the classifiers has been studied based on the theory of belief functions.
-Finally, we have computed the new weekly predicted cases of COVID-19 pandemic based on the confinement and the protection tools factors.
4.1 Data processing
The data used for our approach is provided from WHO by collecting the daily number of confirmed cases and death cases for some countries as indicated previously (France, Italy, Spain, USA, Tunisia, Algeria, Morocco and Belgium) [27]. The data were organized in a matrix with the rows representing the countries and the columns representing the confirmed cases for each week starting on 22 January 2020.
We have regrouped the confirmed number of cases into 4 classes:
For the data processing, we have splitted the dataset into train set with 80% and test set with 20%.
In this work, we have added two attributes to the previously data that are the confinement and the protection tools.
In fact, these two parameters are uncertain we couldn’t evaluate their degrees of unreliability, we tried to use a predictive modelling based on the learning algorithms. Indeed, we tried to assign percentages values for these two factors and estimate, each time, the trajectory of epidemic related to their impact.
4.2 Classification of confirmed cases with machine and deep learning algorithms
We have used the Random Forest and Xgboost classifiers for the machine learning algorithms. Also the Bidirecional LSTM (BiLSTM) with 2000 epochs and a batch size of 70 samples as a deep learning model have been used with a bidirectional layer followed by a dropout layer to read and extract its own features before a final mapping to an activity was made. To optimize the deep neural network, the efficient Adam version of stochastic gradient descent will be used also, the categorical cross entropy loss function.
4.3 Fusion of classifiers
Given the mass function for every classifier of the DS theory, we have a data fusion between Random Forest, Xgboost and BiLSTM classifiers. Based on the DS rules of fusion, we have the mass function m1 obtained from the classifier C1 of Random Forest,the mass function m2 obtained from the classifier C2 of Xgboost and the mass function m3 obtained from the classifier C3 of BiLSTM the new mass function after the fusion will be defined by: m1 ⊕ m2 ⊕m3 as being shown in the Eq. (3). The pignistic transformation of the obtained masses helps us to make a decision about the obtained algorithms after fusion.
4.4 Computation of the new weekly predicted cases
Based on the daily predicted cases obtained from BiLSTM, the phase of computation has been done by per week of pandemic for every country. In fact, we compute the new weekly predicted cases with the distribution of confinement and protection percentages. Then, we compare the new cases obtained with the actual cases to show the importance of these two factors in the decrease of the number of cases in the future.
In our experiments, we have used Python (version 3.6.5) with Anaconda distribution on Ubuntu 16.04.6 LTS (Xenial Xerus), Keras (version 2.1.6) and Tensorflow (version 1.7.0) as backend of Keras.
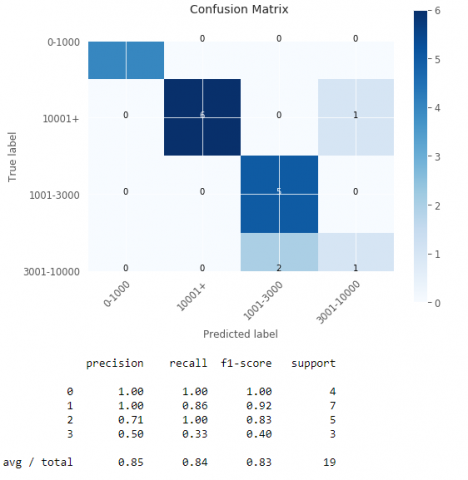
The following values can be obtained from the confusion matrix in a classification problem:
-True Positives (TP): The number of positive instances that were classified as positive.
-True Negatives (TN): The number of negative instances that were classified as negative.
-False Positives (FP): The number of negative instances that were classified as positive.
-False Negatives (FN): The number of positive instances that were classified as negative.
The metrics of the confusion matrix were:
Precision, often referred to as positive predictive value, is the ratio of correctly classified positive instances to the total number of instances classified as positive:
Precision = TP / (TP+FP) (6)
Recall, also called sensitivity or true positive rate, is the ratio of correctly classified positive instances to the total number of positive instances:
Recall = TP / (TP+FN) (7)
F1 combines precision and recall as single value:
F1 = 2* Precision *Recall / (Precision+Recall) (8)
Figure 1. Confusion matrix by Random Forest
Figure 2. Confusion matrix by Xgboost
Figure 3. Confusion matrix by BiLSTM
Table 1. Precision of confirmed cases using machine and deep learning algorithms
|
|
C1 |
C2 |
C3 |
|
0-1000 |
100% |
100% |
100% |
|
1001-3000 |
100% |
100% |
100% |
|
3001-10000 |
75% |
71% |
80% |
|
10000+ |
50% |
50% |
60% |
Table 2. Fusion of machine and deep learning algorithms
|
|
C1 |
C2 |
C3 |
Fusion of C1, C2 and C3 |
|
Error rate |
0.21 |
0.16 |
0.16 |
0.08 |
At the beginning, let us know where Random Forest, Xgboost and the BiLSTM algorithms wrongly predicted the labels using a confusion matrix. In fact, as shown in (Figure 1, Figure 2 and Figure 3). From these figures, the three algorithms present different values of the predicted precision of the confirmed cases given by the following table (Table 1).
As shown in Table 1, the deep learning BiLSTM algorithm can predict the class of 3001-10000 with 80% and the class of 10000+ with 60%. These results are better than those of Random Forest and Xgboost.
To improve the accuracy of these results and to take into account the uncertain aspect of the data, we have used the theory of belief functions and Dempster-Shafer rule, which its goal is the fusion of different sources of information presented by these three classifiers (Table 2).
As shown in Table 2, the fusion gives the least error rate, which is 8%. This result means that the accuracy of the fusion is 92% and it is better than the accuracy of each classifier alone: C1 (79%), C2 (84%) and C3 (84%).
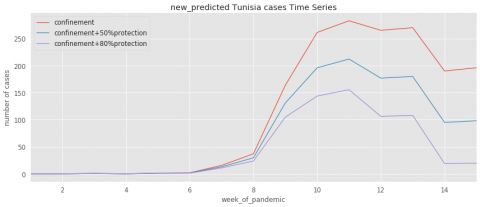
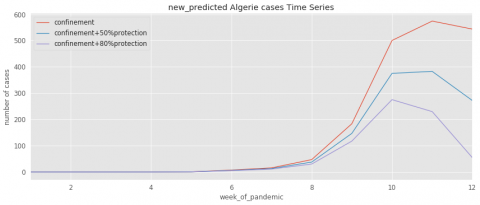
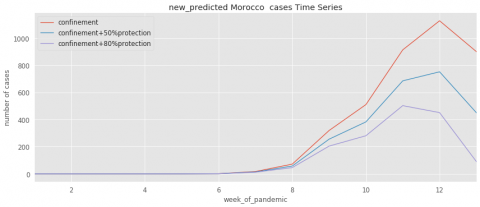
Based on these two parameters, let us show the per week evolution of the predicted cases for every country.
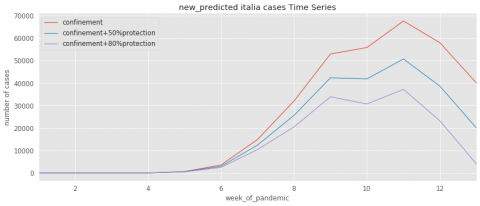
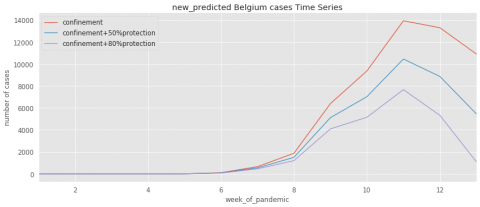
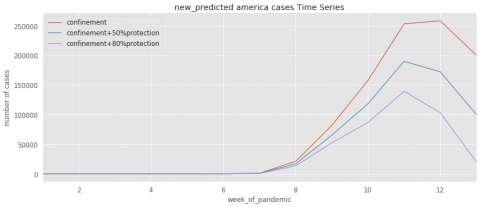
As can be seen in Figures 4~11 below, the COVID-19 evolution is rather similar for all countries. Most countries (France, Italy, Spain, Belgium, USA) have been reached the exponential phase of pandemic spread (the red curves). However, we can remark that the exponential phase begins to decreases if applying the confinement (from the 11th week).
Figure 4. Evolution of predicted cases for Tunisia
Figure 5. Evolution of predicted cases for Algeria
Figure 6. Evolution of predicted cases for Morocco
Figure 7. Evolution of predicted cases for France
Figure 8. Evolution of predicted cases for Italia
Figure 9. Evolution of predicted cases for Belgium
Figure 10. Evolution of predicted cases for Spain
Figure 11. Evolution of predicted cases for USA
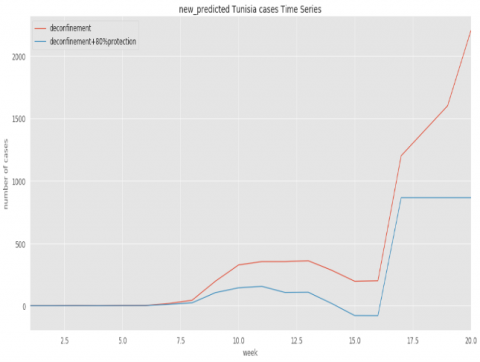
Figure 12. Evolution of predicted cases for Tunisia based on deconfinement parameter
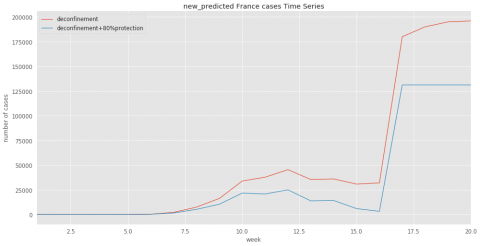
Figure 13. Evolution of predicted cases for France based on deconfinement parameter 3
To further illustrate the impact of the confinement and protection tools on the spread of COVID-19, the Figures 4~11 contain three curves that obtained from the learning algorithms. The first curve indicates the pandemic evolution without using the protection tools. The second curve shows its evolution in the case where the protection has been estimated with a percentage of 50%. The last curve demonstrates the epidemic evolution by predicting more protection around 80%.
As results, we conclude if the confinement has been respected with the 50% of protection, the number of cases decrease faster than without any protection. Moreover, respecting the confinement with the 80% of protection, the number of cases decrease faster than following 50% of protection.
Taking the Tunisia case (Figure 4), which started the confinement earlier in comparison with other countries like France (Figure 7) which already reached the exponential phase of spread of the pandemic. On the contrary, the Belgium country (Figure 9) presents an exponential curve although it announced its first confirmed case simultaneously with Tunisia as well as its date of the confinement. This result can be explained by the degree of respect for the preventive measures that allowed Tunisia so far to curb the infection distribution.
However, as shown in Figure 12, if the Tunisian population respected better the confinement and took all the means of protection, the number of confirmed cases has been much reduced as indicated in the second curve of the.
In this concept and as shown in Figure 12 (more precisely the first curve), if the confinement parameter will be removed, gradually, from the 16th week, the pandemic evolution continues to spread without the use of the protections means. However, we estimate better results if the Tunisian people will respect the protection tools with a rate over than 80%. In this case, the number of infected cases will be stable and closed to the current numbers (as indicated in the second curve of the Figure 12).
Similar results can be obtained for the others country such as the France (Figure 13).
As the COVID-19 pandemic spreads worldwide, several questions arise about the number of cases worldwide at its peak, the time it takes for the pandemic to recede, and the effect of public health interventions to stop the significant spread of COVID-19.
Given the random and highly dependent nature of several parameters of the COVID-19 data, methods for collecting and analyzing defined data, to interpret it to deduce prognoses for future trends can be considered as results conceivable and precise. The objective of this study is to develop methods inspired by artificial intelligence (AI) for forecasting and evaluating intervention strategies to slow the spread of COVID-19 worldwide.
Using the Random Forest and Xgboost classifiers of machine learning algorithms and the Bidirecional LSTM (BiLSTM) of deep learning, we obtain in the best cases an accuracy of 84%.
A fusion of classifiers and a combination of different ways of applying the belief functions theory improved accuracy by 92%. This result has direct repercussions on the prediction of COVID-19 cases.
We show that protective measures are essential to minimize the spread and keep a flattened curve of cases reached by COVID-19 virus. The application of home isolation and the use of protection tools with the rate over of 80% can reduce considerably the number of cases.
[1] Wang, C., Horby, P.W., Hayden, F.G., Gao, G.F. (2020). A novel coronavirus outbreak of global health concern. The Lancet, 395(10223): 470-473. https://doi.org/10.1016/S0140-6736(20)30185-9
[2] Gorbalenya, A.E., Baker, S.C., Baric, R., Groot, R.J.D., Drosten, C., Gulyaeva, A.A., Haagmans, B.L., Lauber, C., Leontovich, A.M., Neuman, B.W., Penzar, D., Perlman, S., Poon, L., Samborskiy, D., Sidorov, I.A., Solá Gurpegui, I., Ziebuhr, J. (2020). Severe acute respiratory syndrome-related coronavirus: The species and its viruses – a statement of the Coronavirus Study Group. https://doi.org/10.1101/2020.02.07.937862
[3] Prem, K., Liu, Y., Russell, T.W., Kucharski, A.J., Eggo, R.M., Davies, N., Jit, M., Klepac, P. (2020). The effect of control strategies to reduce social mixing on outcomes of the COVID-19 epidemic in Wuhan, China: A modelling study. The Lancet Public Health. Elsevier, 5(5): E261-E270. https://doi.org/10.1016/S2468-2667(20)30073-6
[4] Li, Y.C., Wang, B.W., Peng, R.Y., Zhou, C., Zhan, Y.L., Liu, Z.X., Jiang, X., Zhao, B. (2020). Mathematical modeling and epidemic prediction of COVID-19 and its significance to epidemic prevention and control measures. Ann Infect Dis Epidemiol, 5(1): 1052.
[5] Bhatnagar, M. (2020). COVID-19: Mathematical modeling and predictions. https://doi.org/10.13140/RG.2.2.29541.96488
[6] Ivorra, B., Ferrández, M.R., Vela, M., Ramos, A.M. (2020). Mathematical modeling of the spread of the coronavirus disease 2019 (COVID-19) taking into account the undetected infections. The case of China. Preprint, 1-28. https://doi.org/10.13140/RG.2.2.21543.29604
[7] Nesteruk, I. (2020). Statistics-based predictions of coronavirus epidemic spreading in mainland China. Preprint. https://doi.org/10.1101/2020.02.12.20021931
[8] Hu, Z.X., Ge, Q.Y., Jin, L., Xiong, M.M. (2020). Artificial intelligence forecasting of COVID-19 in China. Preprint, 1-20.
[9] Punn, N.S., Sonbhadra, S.K., Agarwal, S. (2020). COVID-19 epidemic analysis using machine learning and deep learning algorithms. Preprint. https://doi.org/10.1101/2020.04.08.20057679
[10] Wynants, L., Calster, B.V., Bonten, M.M.J., Collins, G.S., Debray, T.P.A., Vos, M.D., et al. (2020). Prediction models for diagnosis and prognosis of COVID-19 infection: systematic review and critical appraisal. BMJ. British Medical Journal Publishing Group, 369: m1328. https://doi.org/10.1136/bmj.m1328
[11] Li, S.L., Zhang, X.J. (2019). Research on orthopedic auxiliary classification and prediction model based on XGBoost algorithm. Neural Computing and Applications, 32: 1971-1979. https://doi.org/10.1007/s00521-019-04378-4
[12] Chang, W.B., Liu, Y.L., Xiao, Y.Y., Yuan, X.L., Xu, X.X., Zhang, S.Y., Zhou, S.H. (2019). A machine-learning-based prediction method for hypertension outcomes based on medical data. Diagnostics, 9(4): 178. https://doi.org/10.3390/diagnostics9040178
[13] Zhu, Y., Xu, W., Luo, G., Wang, H., Yang, J., Lu, W. (2020). Random forest enhancement using improved Artificial Fish Swarm for the medial knee contact force prediction. Artificial Intelligence in Medicine, 103: 101811. https://doi.org/10.1016/j.artmed.2020.101811
[14] Du, Y.D., Almajalid, R., Shan, J., Zhang, M. (2018). A novel method to predict knee osteoarthritis progression on MRI using machine learning methods. IEEE Transactions on NanoBioscience, 17(3): 228-236. https://doi.org/10.1109/TNB.2018.2840082
[15] Siami-Namini, S., Tavakoli, N., Namin, A.S. (2020). The performance of LSTM and BiLSTM in forecasting time series. 2019 IEEE International Conference on Big Data (Big Data), Los Angeles, CA, USA. https://doi.org/10.1109/BigData47090.2019.9005997
[16] Brownlee, J. (2017). Forecasting Multivariate Time-Series Data Using LSTM and Mini-Batches. In: Bohlouli M., Sadeghi Bigham B., Narimani Z., Vasighi M., Ansari E. (eds) Data Science: From Research to Application. CiDaS 2019. Lecture Notes on Data Engineering and Communications Technologies, vol 45. Springer, Cham. https://doi.org/10.1007/978-3-030-37309-2_10 ·
[17] Trabelsi, D., Mohammed, S., Chamroukhi, F., Oukhellou, L., Amirat, Y. (2012). Supervised and unsupervised classification approaches for human activity recognition using body-mounted sensor machine learning. The 20th European Symposium on Artificial Neural Networks, Computational Intelligence and Machine Learning – Proceedings, Bruges, Belgium. http://www.i6doc.com/en/livre/?GCOI=28001100967420
[18] He, Z.Y., Jin, L.W. (2008). Activity recognition from acceleration data using AR model representation and SVM. Machine Learning and Cybernetics. International Conference, Kunming, China, pp. 2245-2250. https://doi.org/10.1109/ICMLC.2008.4620779
[19] Preece, S.J., Goulermas, J.Y., Kenney, L.P., Howard, D. (2009). A comparison of feature extraction methods for the classification of dynamic activities from accelerometer data. IEEE Transactions on Biomedical Engineering, 56(3): 871-879. https://doi.org/10.1109/TBME.2008.2006190
[20] Liu, L.P., Yager, R.R. (2008). Classic Works of the Dempster-Shafer Theory of Belief Functions: An Introduction. In: Yager R.R., Liu L. (eds) Classic Works of the Dempster-Shafer Theory of Belief Functions. Studies in Fuzziness and Soft Computing, vol 219. Springer, Berlin, Heidelberg. https://doi.org/10.1007/978-3-540-44792-4_1
[21] Bi, Y.X., Guan, J.W., Bell, D. (2008). The combination of multiple classifiers using an evidential reasoning approach. Artificial Intelligence, 172(15): 1731-1751. https://doi.org/10.1016/j.artint.2008.06.002
[22] Quost, B., Masson, M.H., Denœux, T. (2011). Classifier fusion in the Dempster-Shafer framework using optimized t-norm based combination rules. International Journal of Approximate Reasoning, 52(3): 353-374. https://doi.org/10.1016/j.ijar.2010.11.008
[23] Bi, Y. (2012). The impact of diversity on the accuracy of evidential classifier ensembles. International Journal of Approximate Reasoning, 53(4): 584-60. https://doi.org/10.1016/j.ijar.2011.12.011
[24] Liu, Z., Pan, Q., Dezert, J., Han, J.W. (2018). Classifier fusion with contextual reliability evaluation. IEEE Transactions on Cybernetics, 48(5): 1605-1618. https://doi.org/10.1109/TCYB.2017.2710205
[25] Xu, P., Davoine, F., Zha, H., Denœux, T. (2016). Evidential calibration of binary SVM classifiers. International Journal of Approximate Reasoning, 72: 55-70. https://doi.org/10.1016/j.ijar.2015.05.002
[26] Minary, P., Pichon, F., Mercier, D., Lefevre, E., Droit, B. (2017). Face pixel detection using evidential calibration and fusion. International Journal of Approximate Reasoning, 91: 202-215. https://doi.org/10.1016/j.ijar.2017.09.002
[27] WHO. COVID-19 situation reports. https://www.who.int/emergencies/diseases/novel-coronavirus-2019/situation-reports, accessed on Mar. 3, 2020.