Chippada Nagamani* | Suneetha Chittineni
OPEN ACCESS
Anomaly recognition has been utilized to recognize the exception and remove anomalies from different sorts of information and networks. It has imperative applications in the field of failure recognition, network strength examination, Medical Outlier Detection, Industrial Damage recognition. Detecting few anomalies from a network of information perceptions is a continually testing method. The primary commitment of this work is to build up a technique that can register the neighborhood density based anomalies proficiently in high dimensional information. In this paper, we have demonstrated that the dataset is divided into multiple subsets and checked for exceptions which make the task of outlier detection easy. The exceptions are then consolidated from various subsets. In this way, the neighborhood density based anomalies can be figured effectively. In this paper Density Based Outlier Detection (DBOD) method is proposed which divides the network into sub networks and identifies outliers on them.
anomaly detection, network, semi-network, density based, outliers, high dimensional data
The information mining applications are utilized to find the practices of the gathered perceptions, which could have not been discovered physically. The organizations use this information to pick up an upper hand by having the capacity to foresee the market and client practices all the more precisely. The administration utilizes information mining techniques to recognize deceitful exercises [1].
Research establishments apply information mining techniques to more readily comprehend the connections in the dataset that may prompt logical disclosure. For the most part, information mining is utilized to deduce the normal examples in an informational collection. The regular procedures are affiliation mining, grouping and characterization [2]. Be that as it may, alongside design recognition, the information mining network is demonstrating generous enthusiasm for identifying exceptions in datasets. An exception, or abnormality, is a perception that veers off from others so enormously that it brings doubt up in the dataset [3]. Therefore, exception identification has a few essential applications.
Exceptions can give fascinating knowledge about the dataset. For instance, the system exercises that is shockingly high as for its network may show a blunder or a network assault in the framework [4]. The presence of an anomaly may show another pattern in the process that creates the information or an unfamiliar blunder in the framework. At times, exception identification is the main procedure that can be utilized to find noxious exercises that may have not been found by some other means [5].
Exception or abnormality discovery can be isolated into various classifications relying upon the idea of the dataset. The main classification is abnormality recognition in successive information. Consecutive information is just network succession of information [6]. In database evaluating, a strange network of information access may show a noxious unapproved access in the database. Another classification is fault recognition in network information [7].
Another class is exception identification in forbidden information. In this classification, a component choice method is utilized to choose highlights speaking to the qualities of the dataset [8]. At that point, the information is changed into an arrangement of records regarding the list of capabilities. An exception in this class is a record that veers off from the rest in the changed dataset [9].
Generally, anomalies have been considered broadly in measurements [10]. Despite the sort of measurable test, the accurate techniques play out the theory test against an accepted dissemination of the basic procedure that creates the dataset [11]. Much of the time, the circulations are obscure. Additionally, the accurate tests are summed up to multivariate tests for datasets with in excess of one trait, the multivariate measurable strategies, in any case, are successful for few qualities. In this way, remove based exception recognition is for all intents and purposes favored for multi-dimensional information by looking at the separation between the focuses in a dataset [12].
A perception that goes astray enormously from its neighbors as for its nearby depth is thought to be an anomaly. The depth is estimated by the length of the k-closest neighbor separations of its neighbors. Despite the fact that a neighborhood anomaly may not veer off from the various perceptions [13]. For instance, a system movement might be considered outstandingly highly relying upon the idea of the system. However, in the estimation of nearby depth based anomalies, the calculation of the k-closest neighbor is exorbitant.
The nearby depth based technique uses multidimensional record trees to accelerate the k-closest neighbor calculation. our commitments in this proposal is to present a technique that can figure the neighborhood depth based anomalies effectively. We watch that when the dataset is divided into numerous subspaces, the nearby exceptions are as yet noticeable in any of these subspaces. This prompts the randomized technique for nearby depth based exception discovery in high dimensional information [14].
Recognizing and describing uncommon examples is an imperative assignment in numerous areas running from extortion discovery, natural exploration, to different human services applications [15]. This issue is regularly alluded to as exception or oddity identification.
In spite of the fact that recognizing a typical subject has been broadly considered in high dimensional information and as of late stretched out to the system setting [16], the issue stays extremely difficult. In the system setting, most existing works center around looking individual hubs [17], or gatherings of connected hubs whose structures or practices are infrequent. Despite the fact that these examinations have given natural ideas about remote examples characterized in this regard of network availability, most outcomes are constrained to the setting of a solitary static network. Other ongoing investigations have stretched out the extent of examination to developing networks, yet the emphasis is on occasion/change recognition where the fleeting measurement is a key factor for characterizing exceptions [18].
In this paper, we address the issue of recognizing odd networks from a database of different network tests while in the meantime examining why a system is uncommon [19]. An anomaly is characterized at the worldwide level of a whole network test yet we utilize nearby semi networks to clarify its exceptionality. In spite of the fact that the outliers of a network can be evaluated by means of the anomaly degree, such a solitary measure just bears constrained logical data [20] since it does not have the capacity of appearing in what information see, i.e. nearby semi-networks, an irregular network is generally outstanding. Although two networks may have comparable exception degrees, the nearby semi networks that make them irregular may be very unique since the uncommon networks themselves are typically not homogeneous [21].
For instance, investigating a database of quality networks for exceptions can prompt the segregation of subjects experiencing bugs. In any case, the quality pathway (neighborhood semi network) that causes the complaint can fluctuate from subject to subject because of the intricacy of the problem [22], or notwithstanding relying upon various phases of the ailment. Recognizing an undesirable subject is for the most part not adequate [23].
Anomaly recognition techniques can be sorted in view of preparing dataset accessibility, conveyance supposition, or information marking. Regarding preparing information, a technique can be managed, semi-regulated, or unsupervised. At the point when there is a preparation dataset for both anomaly and ordinary perceptions, this dataset is utilized to prepare a chosen information model to group future info.
For semi-administered techniques, the preparation information is either accessible for typical perceptions or anomalies yet not both. In this case, the models are found out just for the known classes of perceptions. On the off chance that another perception does not have a place with the known classes, it is announced to be an anomaly. The restriction of directed and semi-regulated strategies is that the preparation dataset must speak to every single conceivable class. On the off chance that there is another class of perceptions, this perception won't be recognized accurately.
Chiang L.H. et.al. [1] the genetic calculation is utilized as a part of request to recognize the exception inside the intricate network. The genetic calculation uses the iterative approach so as to produce ideal outcome. There exist periods of GC, for example, choice, genetic activity, change and hybrid. The genetic calculation arbitrarily fluctuates the populace keeping in mind the end goal to check the hub which does not fulfill the properties of the network. This will give the exception inside the intricate network.
Egan W.J. et al. [2] described the principal KClique related based inner circle permeation technique. The coterie permeation strategy develops the networks from k-inner circles. In this approach, above all else, locate the maximal inner circle of a diagram at that point discover others coterie. At that point make faction covered framework to recognize the covered network and set limit lattice esteem is equivalent to k-1. in this grid, if the incentive in line and section corner to corner is more than k-1 at that point change over into one, generally zero. In inner circle framework, 1 implies covered and 0 implies no covered nodes.
Figure 1. Framework design
The online IDS framework gets and channels the client's useful information, utilizing two particular channels. An ARIMA gauge is evaluated and contrasted with the time arrangement, to identify spike benefit activity. Then again, the time grouping is contrasted with the client compacted profile utilizing a dynamic time distorting (DTD) similitude metric, which is fit for looking at comparative time rescaled shapes. The yields are two exceptions records, with a slower and more pertinent reaction of the DTD one. This design can without much of a stretch be upheld by a distributed computing engineering with regards to network virtualization, because of its completely simultaneous nature.
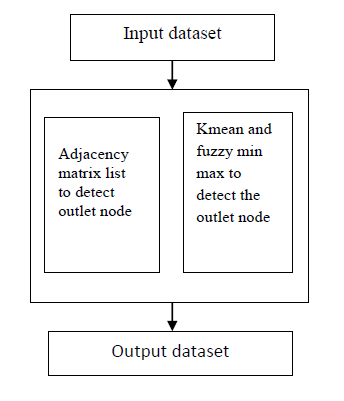
The proposed system utilizes two strategies to distinguish the anomalies, one for taking out outlet hub, another for exception discovery with k-mean bunching and then fuzzy min max neural system. This technique recognizes the outlets hub with ‘k’ inner circle strategy with help of contiguousness network of organizing information. Principle center is around exception recognition with K-mean and neural system strategies and techniques, which are utilized to identify the anomaly from tremendous measure of information.
Figure 2. Flow of detecting outliers
The proposed calculation will take the contiguousness network from the diagram and after that dispose of the hubs having 0 in the comparing line framework.
Algorithm:
Given as info a basic chart G with n vertices checked 1, 2… M, look for an inner circle of size at any rate k.
At each stage, if the inner circle acquired has measure in any event k, and afterward stop.
DBOD (Graph G, Node n)
Step-1 Find Adjacency(A)=Adj(G)
Step-2 Set i=0,m=nodeCount
Step-3 Repeat while i<=m
Step-4 While(m<max(node))
Step-5 Check Adji
Step-6 If(Adji>0)&& Adji<max(network))
Step-7 Accept the node(ACi)=Ni
Step-8 else
Step-9 Reject the hub
End of if
Step-10 Move to the following hub
Step-11 I=i+1 ,m=m+1
Step-12 End of circle
Step-13 Perform K-Means to distinguish particular bunch
Step-14 Calculate ideal qualities utilizing Fuzzy Min Max
The working of the proposed Fuzzy min max algorithm is that from a graph G find the adjacent vertex A from any starting vertex I from available M vertices. Every node is initialized with unique outlier value and every node is checked with all the adjacent nodes and a node is accepted only if Ni outlier value is greater than zero. If the value is zero then simply reject the node. The process is repeated for all the nodes in the network and then the network is divided into sub networks using K-means algorithm.
Method
Figure 3. Outliers in network
Algorithm for outlier identification
OUTLIERIDENTIFICATION(Set D, Niter, NodeCount)
Step-1 for all m=0, I ∈ [1,Niter] do
Step-2 While m > NodeCount
Step-3 Partition(D)
Step-4 End while
Step-5 end for
Step-6 for all I ∈ [1,Niter] do
Step-7 While NodeCount>0
Step-8 COMBINESCORES
Step-9 NodeCount--
Step-10 end while
Step-11 end for
Step-12 end strategy
The proposed algorithm will effectively identify the outliers.Here in the proposed algorithm, Niter value is the outlier causing value of all nodes. Based on the scorevalue every node is checked with its unique Niter value. The process checks all the nodes in network.
Algorithm for semi-network formation
SPLIT((Set D, Set S1, Set S2,NodeCount)
Step-1 p1 ← random(S1)
Step-2 p2 ← random(S2)
Step-3 for all p ∈ D do
Step-4 while NodeCount>0
Step-5 in the event that ||p, p1|| < ||p, p2|| at that point
Step-6 place p into S1
Step-7 else
Step-8 place p into S2
Step-9 end if
Step-10 end while
Step-11 end for
The proposed algorithm splits the network into semi-network accurately based on node count and outliers identification is observed on every semi-network which has high dimensional data. Here D is the maxcount of nodes in a network and then 2 nodes are randomly selected from 2 data sets S1 and S2. Node count holds the current node position. A single network is divided into multiple networks as value of S1 in dataset1 is always less than value of dataset2. Every node value is compared with the remaining values and then the network is split into semi networks which makes easy to identify outliers better than on a single network.
Processing a high dimensional data in a network is a complex task. Processing huge data is also a time consuming process. A network is divided into multiple semi networks and then outliers on those semi-networks is performed which increases the performance level of the system.
A network which has many semi-networks are considered and the proposed algorithm for detecting outliers is applied on the sub networks. The network dataset is considered from UCI machine repository. The proposed DBOD algorithm uses MATLAB with the end goal of information mining. The information mining is utilized to extricate the data from the extensive dataset.
The proposed DBOD algorithm is compared with the traditional spatial outlier algorithm (SOA) and the results show that the performance levels are much better than existing methods.
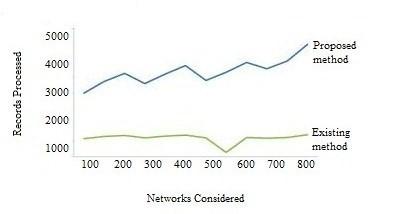
The networks range considered in the proposed method are compared with existing method in terms of data processing.
Figure 4. Data processing levels
The Outlier detection rate is much better and quicker than the traditional methods. The outliers are effectively identified and can be resolved. The outlier detection rate is depicted as below.
Figure 5. Accuracy in detecting outliers
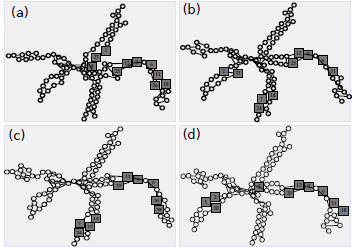
When there are semi-networks in a network then the outlier detection among the semi-networks are identified accurately and displayed. The identified outliers in a semi-network are depicted in below figure.
Figure 6. Outliers identified in semi-networks of a network
We acquainted a randomized technique with figuring the nearby anomaly scores quick with high likelihood without discovering k-closest neighbors for all information focuses by abusing the exception property of neighborhood anomalies. We likewise presented diverse forms for the randomized strategy to enhance its exactness and strength. The parameters can be chosen naturally. We have assessed the execution of our technique on an assortment of genuine datasets. The tests likewise affirm that the randomized strategy is quick and versatile for high dimensional information. A characteristic expansion of this strategy is to build up an incremental rendition of this technique so it can be adjusted to continuous applications where the datasets are progressively refreshed. The proposed framework takes out the exception contemplations by considering just those hubs in the perplexing systems which has high degree. Along these lines anomaly hub is wiped out from the reproduction.
[1] Chiang LH, Pell RJ, Seasholtz MB. (2003). Exploring process data with the use of robust outlier detection algorithms. Journal of Process Control 13(5): 437-449. https://doi.org/10.1016/s0959-1524(02)00068-9
[2] Egan WJ, Morgan SL, Chem A. (1998). Outlier detection in multivariate analytical chemical data. Analytical Chemistry 70(11): 2372-2379. https://doi.org/10.1021/ac970763d
[3] Walczak B, Massart DL. (1995). Robust principal components regression as a detection tool for outliers. Chemometrics & Intelligent Laboratory Systems 27(1): 41-54. https://doi.org/10.1016/0169-7439(95)80006-u
[4] Almutawa J. (2007). Identification of errors-in-variables model with observation outlier based on MCD. Journal of Process Control 19(5): 879-887. https://doi.org/10.1109/IEEEGCC.2006.5686225
[5] Beyene Y, Faloutsos M, Chau DH, Faloutsos C. (2008). The eBay graph: How do online auction users interact? Infocom Workshops 2008: 1–6. https://doi.org/10.1109/INFOCOM.2008.4544649
[6] Bu Y, Chen L, Fu AWC, Liu D. (2009). Efficient anomaly monitoring over moving object trajectory streams. KDD ’09: Proceedings of the 15th ACM SIGKDD International Conference on Knowledge Discovery and Data Mining, New York, NY, USA, pp. 159–168. https://doi.org/10.1145/1557019.1557043
[7] Chandola V, Banerjee A, Kumar V. (2009). Outlier detection: A survey. ACM Computing Surveys, 1–72.
[8] Deng H, King I, Lyu, (2008). Formal Models for Expert Finding on DBLP Bibliography Data, in Data, ICDM ’08. Eighth IEEE International Conference on 15-29. https://doi.org/10.1109/ICDM.2008.29
[9] Gulisano V, Almgren M, Papatriantafilou M. (2015). METIS a two- tier intrusion detection system for advanced metering infrastructures. Cham: Springer International Publishing, 51–68. https://doi.org/10.1145/2602044.2602072
[10] Chandola V, Banerjee A, Kumar V. (2009). Anomaly detection: A survey. ACM Computing Surveys 41(3): 1–58. https://doi.org/10.1145/1541880.1541882
[11] Mijumbi R, Serrat J, Gorricho JL, Bouten N, Turck FD, Boutaba R. (2016). Network function virtualization (2016) State-of-the-art and research challenges. IEEE Communications Surveys Tutorials 18(1): 236–262. https://doi.org/10.1109/COMST.2015.2477041
[12] Li T, Li Q, Zhu S, Ogihara M. (2002). A survey on wavelet applications in data mining. ACM SIGKDD Explorations Newsletter 4(2): 49–68. https://doi.org/10.1145/772862.772870
[13] Shlens J. (2014). A tutorial on principal component analysis. International Journal of Remote Sensing 51(2): 1-12. https://doi.org/10.13140/2.1.1593.1684
[14] Han J, Kamber M, Pei J. (2011). Data mining: Concepts and techniques. 3rd Ed., ser. The Morgan Kaufmann Series in Data Management Systems, Morgan Kaufmann. https://doi.org/10.1128/AAC.04251-14
[15] Keogh E, Ratanamahatana CA. (2005). Exact indexing of dynamic time warping. Knowledge and Information Systems 7(3): 358–386. https://doi.org/10.1007/s10115-004-0154-9
[16] Giorgino T. (2009). Computing and visualizing dynamic time warping alignments in R: The DTW package. Journal of Statistical Software 31(7): 1–24.
[17] Bikku T. (2018). A new weighted based frequent and infrequent pattern mining method on realtime E-commerce. Ingenierie des Systemes d' Information 23(5): 121.
[18] Bikku T, Gopi AP, Prasanna RL. (2019). Swarming the high-dimensional datasets using ensemble classification algorithm. In First International Conference on Artificial Intelligence and Cognitive Computing, pp. 583-591.
[19] Vejendla LN, Bharathi CR. (2018). Effective multi-mode routing mechanism with master-slave technique and reduction of packet droppings using 2-ACK scheme in MANETS. Modelling, Measurement and Control A, 91(2): 73-76. https://doi.org/10.18280/mmc_a.910207
[20] Vejendla LN, Bharathi CR. (2016). Secured key production and circulation in mobile Ad hoc networks using identity based cryptography. International Conference on Engineering and Technology 1: 202-206.
[21] Vejendla LN, Gopi AP. (2017). Visual cryptography for gray scale images with enhanced security mechanisms. Traitement du Signal 35(3-4): 197-208.
[22] Gopi AP, Vejendla LN. (2017). Protected strength approach for image steganography. Traitement du Signal 35(3-4): 175-181.
[23] Gopi A. (2015). Designing an adversarial model against reactive and proactive routing protocols in MANETS: A Comparative performance study. International Journal of Electrical & Computer Engineering 5: 5.