Shraddh R. Khonde * | Ulagamuthalvi Venugopal
OPEN ACCESS
In the field of information security, attack detection and protection of information from intruders become a new area of research now a days. Due to ever changing technologies and modern methodologies intruders use polymorphic mechanism to deception attack. Various attacks like distributed denial of service, goldeneye, user to root, local to user, remote login become the great threat to the network. To take care of information utmost care is taken to provide network security with the help of various Intrusion Detection System (IDS). IDS helps to detect the threats to the network and can provide various strategies to avoid them. Most of the IDS work intelligently to detect the malicious activities or any abnormal behavior in the network. It leads to the detection of attack and prevention actions can be taken to protect information and provide security to the network. This paper presents an intelligent ID which monitors the real time network traffic to observe the behavior of packets. On the basis of observation detection is done for malicious or normal packets. Action is taken by administrator to prevent the network once the attack is detected by IDS. For attack detection ensembling of various classifiers is done such as Support Vector Machine, Naïve Bayes, k Nearest Neighbor, stochastic gradient descent, logistic regression, Random Forest and Decision tree. All classifiers used classification methods to classify packets in malicious and normal category. Preprocessing is done to reduce features for minimizing training time of all classifiers. Variable importance and Gini index techniques are used to reduce features. Reduced features are used by individual classifier to classify packets in proposed hybrid model. Majority algorithm is used to ensemble the results of all individual classifier to give the final class of packet as attack or normal. All the classifiers work in distributed network to classify the attacks. NSL-KDD dataset is used to train the classifiers. Testing of proposed system is done by capturing real time traffic on the network. From results it is observed that ensembling of more classifiers increases the detection accuracy of IDS significantly and reduces the false alarm rate. It also helps in improving the system performance in terms of execution time and detection rate with increased true positive rate.
ensemble, feature selection, naïve Bayes, random forest, intrusion detection, IDS, network security
Intrusion detection can be stated as a process for observing, analyzing and taking decisions for abnormal activities which can be considered as violations of policies of network environment [1]. It mostly supports firewalls to work faster and in more accurate way. Sometimes IDS can detect the abnormal activities which cannot be detected by the firewalls. Denning [2] had provided the framework of IDS to detect the various kinds of attacks on networks, which explains how audit reports can be used to find out abnormal patterns to detect security violations. Different types of attacks or intrusions are mostly used by intruders to interrupt the network traffic for degrading network performance. Sudden change in the network traffic can affect the security of network. According to Yan, et al. [3], by observing pattern of actions intrusions can be find, which tries to compromise confidentiality, integrity or availability (CIA) of information resources; so it’s required to take action against such attempts to reduce security risks in network. Data mining and machine learning techniques can be used to build smart IDS which can minimize risk of intrusion.
One should aim to create a Novel IDS which incorporates the methodologies of Data Mining, Machine Learning and Artificial Intelligence to identify the attacks in the network correctly with very less number of misclassifications which otherwise would go unidentified in traditional Intrusion Detection Systems. The following section highlights the technologies that can be used to achieve better accuracy for detection and reduce false alarm rate.
1.1 Misuse-based IDS
Misuse based detection method is used for detection of known attacks. Definition of attacks is observed as signature in this type of detection. Signatures are represented in format such as change in packet payload, shutting down of process automatically or actions followed by other actions etc. Signature database is created to store all the signatures together to analyze normal and abnormal behavior of traffic or packets. Misuse type of IDS concentrates on matching the signature from database with capture packet rather than analyzing the source of attack generation. Analysis is done to find whether the packet is normal or malicious. Big challenge for this type of IDS is to collect signatures of all types of known attacks. Most of the IDS following signature database shows slow performance in attack detection as the size of database is large which stores signatures of multiple attacks. Due to this most of the attacks which works in distributed fashion can harm network. Signature based IDS shows good performance of all known attacks whose signature is available in database, but shows poor performance for unknown attacks whose signature is not available in database [4].
1.2 Anomaly-based IDS
To eliminate the limitation of signature based IDS which is unable to detect the unknown attacks, anomaly based IDS can be used. Intrusion detection in this IDS is done by observing the abnormal behavior of the network traffic. This method train classifier according to normal behavior of the network such as packets arriving per unit time, packet payload values or behavior of network application and traffic. Packets are classified as normal if it matches to the normal behavior of the network which is checked with the rules of identification, otherwise it is considered as the abnormal behavior and malicious packets which can be analyzed as attacks. Once the attack packet is detected alarm is generated to give indication to administrator about this malicious activity. Challenge in this type of IDS is to decide the normal behavior of network and to set threshold when to generate alarm. In this type of IDS sometimes wrong alarms can be generated by little deviation of network traffic from normal. Wrong alarm leads towards more false alarm generation; which can be responsible for poor performance of system and less detection rate [4].
Several Machine Learning algorithms, neural network [5-6], Support Vector Machine [5-6], Clustering Algorithms [7] with Artificial Intelligence, Random forest [8], Genetic algorithms [9] and ensemble of most classifiers are used by many researchers to improve accuracy of detection and reduce false alarm rate. In depth knowledge of KDD dataset is presented by Hasan, et al. [5] where four types of attacks were used as Basic, Content, Traffic and Host. Detection Rate (DR) and false alarm rate is used as evaluation metrics to check the performance of classifier. Authors create 15 subsets of instances using all attributes into above mentioned 4 classes. Most importance is given for reducing false alarm rate and increasing detection rate by class dominance. Farnaaz, et al. [8] explained various algorithms where a j48 algorithm is compared with random forest classifier. Dataset used is NSL-KDD to train the classifier. After pre-processing dataset is clustered into attack classes. Symmetrical uncertainty measure is used for reducing feature in pre-processing stage. 100 trees are created using random forest classifier to compare results using detection rate and false alarm rate.
Roberto, et al. [10] used ensemble of multiple SVM to create an IDS. 2v-grams technique is used to do analysis of packet payload. Value of v is obtained by a sequence of 2-grams which are extracted from payload at particular interval. Probability of attack in normal traffic is analyzed by varying value of v. Feature reduction clustering algorithm is used for representation of payload in feature space. SVM is modeled with the help of representation of feature space in training phase. Packet detection probability is found by SVM in testing phase. Authors adopt non trainable combiner to combine all probabilities, analyzed upon maximum, minimum, average and product. Model output the final probability of packet being normal. Finally, if value of probability is above threshold it outputs as normal packet.
An ensemble approach by combining SVM, DT, ANN and k-NN is used by Borgi [11] to create IDS. Dataset used to train and test all classifiers is DARPA. All the classifiers are compared to check the detection accuracy and false positive rate. Output is found by applying combination rule, majority voting rule and average rule to each classifier. Belief function is used to find the probability of class assigned to packet. Current IDS does signature based detection [12] which requires large amount of data. To calculate accuracy IDS performance plays important role which depends on data and features used for detection. Performance of IDS can be degraded if inaccurate data and features are given to the classifier as input. To avoid this most of the feature reduction and dimensionality reduction techniques such as data filtering, data clustering or feature selection are used. In this work feature selection technique is developed to reduce number of features use for prediction by classifier.
It is proved that ensemble of classifiers gives better result as compared to single classifier, whereas a novel approach which uses two classifiers SVM and KNN in ensemble approach presented in [13]. Dataset used to train and test classifiers is KDD’99. Combination rule is used to combine predictions of base classifiers. Author used techniques as combination function such as particle swarm optimization (PSO), variant of PSO and weighted majority algorithm. Experimental results show the improved classification accuracy given by ensemble classifiers as compared to base classifier alone.
Jha, et al. [14] explained the system created using an SVM classifier. Combination of Information Gain and k means is used for feature selection, where information gain is used to calculate importance of each feature. Features are selected by Information gain according to gain and then selected using k means algorithm. Authors calculated the accuracy by reducing the features to 23 and 30; which shows the accuracy changes by 0.05 %.
Jungsuk, et al. [15] test the real traffic obtained from Kyoto University. Unsupervised approach is further extended in order to improve the results without any intervention by the users. In this approach users are not setting any parameters in filtering and clustering phases. It is assumed by system. Number of clusters to form and ration of attacks with network traffic is automatically modeled by system in which both the approaches are compared. Automatic approach is found to be superior as compared to user intervention approach.
The analysis done by Choi, et. al. [16] shows that 41 features of KDD dataset are not relevant by using, information gain, Gain ratio and Correlation based features selection. To reduce feature attribute ratio with decision tree is used to find the importance of the feature which is compared with Information Gain and Gain Ratio. Authors proved that accuracy obtained by system is better after reducing 41 features to 22 features. Process of weighted majority algorithm is explained by Littlestone and Warmuth [17], which assigned right to the prediction given by each classifier used for finding final prediction class.
An unsupervised framework based on random forest is presented by Jiong, et al. [18]. The network traffic was captured to create dataset to train random forest algorithm in off-line mode in preprocessing phase. Random forest requires more computational cost if it is used on-line to test the network traffic. Random forest is an ensemble of several trees generated by different bootstrap samples from the dataset. Different bootstrap samples are used to classify packet as normal or attack. Random forest ensemble votes from each class to get the final prediction about the packet.KDD’99 dataset is used to find accuracy and detection rate using random forest. Author proved that the unsupervised framework using random forest gives higher detection rate and low false positive rate.
Hasan et al. [19] implements IDS using SVM and Random Forest classifier. It is observed that SVM and Random Forest provides same accuracy; however Random Forest provides better computational time as compared to SVM. Accuracy of 92.99 % is obtained while testing SVM which use radial basis kernel method. Accuracy for Random Forest for testing is 91.41 %. Processing time required for attack detection is less for Random Forest as compared to SVM. Sindhu, et al. [20] proposed a novel architecture based ensemble of neural networks. KDD’99 dataset is used to train and test classifier. Detection accuracy of model is found using optimal subset method and Genetic algorithm. Model functionality is validated using detection accuracy fitness function. Complexity increases as neural networks classifiers are used for training models. Ada-boost algorithm is used to ensemble the classifiers. C4.5 is used is used to reduce the complexity of neural network. Experimental results show that classifiers decision tree and neural network if used alone is less as compared to ensemble approach if analyzed on parameters such as True positives, False positives, precision, recall and F-measure.
Unsupervised approach is used by many researchers to test various data mining algorithms for IDS system. Jungsuk, et al. [21] elaborates another unsupervised framework based on various data mining techniques. This framework consists mainly three phases i.e., filtering, clustering and modeling. This framework depends on the parameters set by the user in training and testing phase. In training phase the attack packets are filtered and eliminated from the training dataset. Elimination process is accomplished by algorithm working on notion of density, which uses the ration of attacks with respect to network traffic. This parameter is specified by user in training phase. After filtering data clustering is performed on training dataset. Number of clusters to be obtained is decided by user which forms clusters for network traffic. In final phase a one-class SVM is trained for each cluster formed on the dataset. In testing phase, packets are evaluated by ensemble of SVMs obtained in previous phases. Packets are predicted as normal for any of the one-class SVM represents it otherwise consider as malicious packet.
Clustering algorithm BIRCH is used as classifier by Horng et al. [22]. KDD’99 dataset is divided into five parts to process with BIRCH depending on their principal classes. Principal classes are Probe, Dos, U2R, R2L and normal traffic. BRICH generate one clustering tree for each class. Feature tree which is a compact representation of dataset; represents whole dataset as a tree where each leaf node represents cluster. SVM is trained for each cluster representing one attack class. All SVMs are ensemble to get results in terms of accuracy. It is proved that ensemble SVM gives better accuracy as compared to decision tree and k-means. According to work performed by many researchers as discussed above, it is witnessed that, in today’s scenario it is difficult to handle most of the new attacks happening on network. Anyone can handle the attacks if it is known, but if unknown or anomaly type attack happened on system, single classifier fails to handle that attack. Accuracy can be increased by ensembling number to classifier together. It also supports in reducing false positive rate. Accurate attack detection is considered as true positive else false positive if misclassified. Hence the main objective behind the proposed work is use hybrid model to improve the detection accuracy of anonymous attacks by increasing rate of true positive and reducing rate of false positive.
The IDS proposed in this paper is a distributed IDS operating in an enterprise network (Figure 1). NSL KDD Cup dataset is used. To avoid biased output preprocessing is done on dataset for cleaning and to reduce redundancy. Feature selection is done on the basis on impurity of features. Features are selected whose impurity is less to avoid misclassification of data. Average score is used to find the required features used for training and testing. Classifiers are used to train the dataset. The result generated by individual classifier is ensemble together using weighted majority algorithm to obtain the final class. On Detection of an attack, the administrator is alerted using a web interface which is used to decide on what action to be taken. The administrator is provided a facility to block the malicious users IP. After detection administrator will create signature for the same attack and distribute it in the network to reduce further attacks. The administrator can also monitor the network traffic and view different parameters such as the detection rate, true positive rate and false positive rate. As all classifiers are working in distributed environment real time data is extracted for testing the ensemble or hybrid model. Real time packet data was extracted into a. pcap (packet capture) file using tcpdump (it is Linux based command line packet analyzer). The feature extraction for the classifiers is done from the .pcap file using a KDD-Extractor (A C++ code used to extract the features of the KDD dataset from the usual packet data).
2.1 Feature selection
To increase prediction accuracy of classifier, feature selection is the important factor. Larger input data is feed to the classifier if all features were used for classification then it can lead to misclassification of packet as input data can be large and noisy. Maximum number of features used can be reduced up to $\sqrt{A}$ where A represents number of features of the dataset used. Various researchers [23-24] proved that classifier can achieve better accuracy if less number of features are used with reduced processing time. Various feature reduction techniques are used to improve performance of classifiers.
In proposed system feature selection is done using by measuring importance of variable as Importance Index (MI) and Index of Probability (IP). To obtain MI and IP, information gain for each feature is calculated to obtain Gini index (Gindex) of each feature. Gindex is used to find the impurity of each feature. Feature with high importance is selected by summing Gindex of all classifier for each feature.
Figure 1. Flow diagram
${{G}_{index}}\left( {{a}_{i}} \right)=1-\sum\limits_{i=1}^{k}{x_{i}^{2}}$ (1)
where, ai is the ith feature whose Gini index is to be find. k is total number of features for the KDD dataset that is 41. xi is the probability for feature.
In proposed architecture importance of each feature is denoted by importance index (MI) is calculated as average of summation of Gindex for all classifiers as per in Eq. (2).
$MI=1-\sum\limits_{i=1}^{k}{Gindex({{a}_{i}})}$ (2)
where, Gindex(ai) is gini index for feature ai. k is total number of features.
Samples are created using features having less impurity. Features having more impurity can be avoided to create samples for attack detection. The measure of probability (MP) of each sample is calculated using each feature in the sample considering error. The features which does not take part in sample creation are called Out of Sample (OoS) features and used to check accuracy. Random shuffling of features is done to check exact accuracy of samples. Errors are calculated for all samples depend on whether they are taking part in training dataset or not. In each sample less number of features will be consider and error is checked to measure accuracy. The term errorOoSz is used to show error in detection if z sample is considered.
$MP({{z}^{a}})=errorOo{{S}_{z}}-errorOoS_{z}^{a}$ (3)
where, za is the sample having feature a. errorOoSz is the error in detection if sample z consists of feature a is present in training dataset. $errorOoS_{z}^{a}$ is the error in detection if sample z consist of feature a is not in training dataset.
$AMP({{z}^{a}})=\frac{1}{l}\sum\limits_{i=1}^{l}{MP({{z}^{a}})}$ (4)
where, za is the sample having feature a. l is total number of classifiers.
Table 1. AMP score of each feature
|
Feature Number |
Feature Name |
AMP Score |
Feature Number |
Feature Name |
AMP Score |
|
15 |
Su attempted |
0.19 |
29 |
Same srv rate |
0.62 |
|
20 |
Outbound cmds |
0.32 |
30 |
Diff srv rate |
0.63 |
|
9 |
Urgent |
0.32 |
11 |
Failed logins |
0.63 |
|
17 |
File creation |
0.33 |
1 |
Duration |
0.71 |
|
7 |
Land |
0.34 |
13 |
Compromised |
0.71 |
|
26 |
Srv serror rate |
0.35 |
41 |
Dst host srv rerror rate |
0.74 |
|
28 |
Srv rerror rate |
0.37 |
37 |
Dst host srv diff |
0.76 |
|
18 |
Shell |
0.41 |
40 |
Dst host rerror rate |
0.77 |
|
31 |
Srv diff host rate |
0.41 |
22 |
Is guest login |
0.82 |
|
25 |
Serror rate |
0.42 |
14 |
Root shell |
0.84 |
|
16 |
Root |
0.42 |
4 |
Flag |
0.91 |
|
21 |
Is hot login |
0.44 |
24 |
Srv count |
0.91 |
|
33 |
Dst host srv count |
0.46 |
19 |
Access files |
0.92 |
|
25 |
Serror rate |
0.47 |
6 |
Destination bytes |
0.93 |
|
12 |
Logged in |
0.56 |
32 |
Dst host count |
1.01 |
|
34 |
Dst host same srv rate |
0.56 |
23 |
Count |
1.02 |
|
38 |
Dst host serror rate |
0.57 |
2 |
Protocol type |
1.10 |
|
35 |
Dst host diff srv rate |
0.58 |
3 |
Service |
1.2 |
|
27 |
Rerror rate |
0.58 |
5 |
Source bytes |
1.2 |
|
39 |
Dst host srv serror rate |
0.59 |
10 |
Hot |
1.4 |
|
8 |
Wrong Fragment |
0.60 |
36 |
Dst host same src port rate |
1.10 |
Average of measure of probability is calculated for each sample to find feature importance as shown in equation 4. Using equation 4 Average MP score is calculated for each feature as shown in Table 1. According to AMP score some features of high and some features with less score are considered to avoid biased detection and overfitting of data. Out of 41 features only 9 features are selected to create a sample for training and testing. Sample is created with six features of high score and three features of less score.
2.2 Classifier
2.2.1 Support Vector Machine (SVM)
In SVM classifier ‘n’ numbers of hyper planes are created to train it for ‘n’ number of classification. Data preprocessing is required in SVM. SVM's are incapable of processing categorical data as it only process numerical data. In order to train SVM from NSL KDD dataset it is required to convert string data into appropriate numerical data for training the classifier. It is always required to save the process of conversation in order to test the live data because classifier will not work if live data is not converted according to the conversation process of training data. Normalization of data in SVM is required as the value of each feature represented in string and varies a lot. Biased output can be obtained from SVM if it is not normalized.
2.2.2 Naïve Bayes (NB)
Naïve Bayes is a supervised machine learning algorithm that helps classifier to predict the class of a given instance. It works on the assumption that all the features used for prediction are independent of each other. In this each feature participate in finding probability of class like attack or normal. While doing prediction of a class using features finite set is formed as subset of features. This set is used to calculate and predict the actual prediction either attack or normal. It is assumed that there is no correlation between the numbers of features used to form the subset for prediction. The accuracy provided by Naïve Bayes is less as compared to decision tree and random forest. Small numbers of training instances are sufficient to train Naïve Bayes and finding important features used for prediction.
2.2.3 Random Forest (RF)
Random forest algorithm is a classification algorithm of supervised type. This algorithm is used to create number of decision trees rather than depending on single tree. More number of trees give better accuracy. Random forest is an ensemble classifier. It has a higher classification accuracy compared to single decision tree. Training of Random forest is done with different subsets with same or different features. It avoids over fitting as features and data are randomly selected, it also handles missing values from data. Random forest is best algorithm to be used in distributed environment [24].
Training of Random Forest
The goal of Random Forest is to use distributed approach for classification. The features used to train decision trees will be selected using their importance in the NSL KDD-99 dataset. The trained model will be placed on a distributed network to increase real time performance and reliability. The class assigned by the decision trees will be put to a vote and majority class will be assigned to the input data. The number of trees in the forest will depend on the current network traffic and processing capabilities available. Total 50 trees will be trained which will be kept ready in the distributed network for classification on demand and send the results to the ensemble machine. Feature list is created to give all the 41 features in the dataset equal importance while not neglecting the information gain from the individual features. 60% of the features in a tree are of average probability measure score 0.5 or higher which consists of 26 or higher features. All the features from the training dataset is not being used as the data was dependent upon server and access logs at the time of NSL KDD development. Features from 10 to 22 is not being used for the training of the trees. Columns 1 to 9 contains intrinsic features and column 22 to 41 contains derived features which are calculated exactly the same way as NSL KDD 99 dataset. Tcpdump is used to collect the raw packets and derive the data from them.
2.2.4 Logistic regression
Classification problems where we need to classify data into two classes is done with the help of Logistic Regression. This algorithm work in same fashion as linear regression does. So it is names as ‘Logistic Regression’. The method used for classification of instances is logit function which is represented into name of the classifier. This method is used when the input is large and it need to classify into binary classes as one or zero. In our method we can use to class it as attack or normal. Like all regression analyses, the logistic regression is a predictive analysis. Logistic regression is used to describe data and to explain the relationship between one dependent binary variable and one or more nominal, ordinal, interval or ratio-level independent variables.
2.2.5 Stochastic gradient descent
This algorithm is the optimization algorithm used when the large data is used to classification. As the proposed system is working on real time data it is mandatory to handle huge amount of data. This algorithm helps us to find the gradient measure of all instances provided to it. It is used to check the error and deviation in behavior of output as input changes. This measure is basically used to find the error of prediction by making use of all instances iteratively. As data is huge it is not possible to use single instance every time to check the accuracy and minimize error rate. Batches of samples are made and analyze iteratively to check the prediction accuracy where each batch will be represented as single instance. This method is batching the instances is called stochastic gradient search. It is popular optimization algorithm used with various machine learning algorithm to minimize detection error and improve prediction accuracy.
2.2.6 Decision Tree (DT)
A decision tree is a data mining algorithm which is working as a tool for supporting decisions made by user. This tool represents all the nodes in a tree-like graph or model of decisions. A decision is represented with the help of flowchart like structure where each node represents a test on a feature defined, each branch represent the outcome of the test and each leaf node represents the class label. Class labels are defined after performing tests on all attributes. Classification rules are represented with the help of path from root to leaf node. In decision analysis the tree like structure is used to visualize the decision support system to confirm the decision taken. A tree can be "learned" by splitting the source set into subsets based on a feature.
2.2.7 K nearest neighbor
This algorithm gives more accuracy in pattern finding methods. We use this algorithm in our system to find specific patterns for attacks happen on system. This classifier learns by analogy. It tests the input given with the training tuples to find the matching pattern of it. We describe training tuples by n features. In our case it is 41 as per KDD dataset. An n-dimensional space is used to represent each tuple for this classifier. This n dimensional pattern space is used to store information of all training tuples. When any unknown feature set is given as an input, a K nearest neighbor classifier search for the same pattern or combination of features in n-dimension space. Tuples are said to be close to any unknown tuple if it goes beyond the threshold value. If it goes beyond threshold value then it is considered as attack otherwise if it is less than that value it is consider as normal packet.
On completing the modeling of the classifiers, training and testing them, the next step is to deploy them in a distributed network. For this purpose, a distributed architecture needs to be developed depicting how the system will function in the network in a distributed manner. Figure 2 shows the architecture of the system.
As seen in Figure 2, data packets in this system are captured through internal for live data. Most the network has switch/Hub at the entrance which allows the traffic or traffic flow coming from internet to enter into the network. Switch/Hub are the devices which are responsible to route the packets to the intended host. In the proposed system first all the packets where passed through firewall to avoid the malicious activities. The attack packets which are not recognized by firewall is detected using various classifiers installed in distributed manner. Packets entered in the network through the centralize server on which packet feature extraction is done with the help of KDD-Extractor. After extraction of features only some features where selected and passed to the classifiers which are working as individual node for classification. Each of the node use different classifier to predict the type of attack. The data is send to each node where classifier such as SVM, Random Forest, Naïve Bayes, KNN, DT, Logistic Regression and Stochastic Gradient Descent is used to analyze each packet of traffic. Each classifier generates the output and send to ensemble module where majority voting algorithm is used to find the final prediction of packet either attack or normal. For example, if the nodes running Naïve Bayes and random forest predict that the set of packets are malicious and the SVM node predicts it as normal, then a majority voting amongst them would classify the packet as malicious. From this discussion, it can be deduced that if we used only one classifier for prediction, say SVM, the packet would be misclassified which would damage the security of the network. From experimental results it is observed that prediction accuracy increases significantly if we ensemble the output of all classifiers together rather than using single classifier for prediction. The node on which attack is done is responsible for creating signature of the unknown attack and send back signature to center node. Center node save signature in its database and share it to remaining nodes so that it can be used for future attack detection.
Figure 2. Proposed system architecture
4.1 Dataset- NSL KDD
The NSL KDD’99 data set includes three independent sets; “whole KDD”, “10 % KDD”, and “corrected KDD”. Most of researchers have used the “10 % KDD” The training set contains a total of 22 training attack types and one type for normal. The “corrected KDD” testing set includes an additional 17 types of attack and excludes 2 types (spy, warezclient) of attack from training set, so therefore there are 37 attack types which can be classified. The KDD 99 dataset is represented with 41 features which are stored in continuous and symbolic form varying in significant range. All 41 features of KDD used to classify main four types of attacks like DoS, Probing, U2R and L2R. Description of attacks available in KDD is given in Table 2.
4.2 Performance evaluation of classifier
Confusion matrix is used to check the classifier accuracy, false positive rate and false negative rate. To check accuracy of the classifier confusion matrix can be used as a tool. If classifier predict packets correctly it produces positive tuples otherwise negative tuples. Confusion matrix use terms given below,
Table 2. NSL KDD99 dataset class
|
Classification |
Attack Name |
Instances from NSL KDD |
|
Probing |
Port-sweep, IP-sweep, Nmap, Satan |
2421 |
|
DoS |
Neptune, Smurf, Pod, Teardrop, Land, Back |
7458 |
|
U2R |
Buffer-overflow, Load-module, Perl, Rootkit |
200 |
|
R2L |
Guess-password, Ftp-write, Imap, Phf, Multihop, Spy, Warezclient, Warezmaster |
2754 |
|
Normal |
Normal |
9711 |
|
Total |
|
22544 |
True Negatives (TN)-Denote to the negative tuples correctly labeled by the classifier.
False Positives (FP)-Negative tuples that were incorrectly labeled as positive.
False Negatives (FN)-Positive tuples that were mislabeled as negative.
These terms are used in Confusion matrix for checking performance of the classifier. The confusion matrix is a tool to analyze the performance of each classifier in terms of recognizing tuples of different classes as shown in Table 3.
Table 3. Confusion matrix
|
Actual Class |
Predicted Class |
||
|
|
C1 |
¬C1 |
|
|
C1 |
True Positives (TP) |
False Negatives (FN) |
|
|
¬C1 |
False Positives (FP) |
True Negatives (TN) |
|
5.1 Performance evaluation
As shown in Table 3 TP and TN articulate us when the classifier is classifying tuple correctly, while FP and FN tell us when the classifier is misclassifying tuples. To check the performance of proposed system real time traffic consisting of more than 1.5 lakhs packets were captured to develop values in confusion matrix as shown in Table 4. Each packet information is saved in .pcap file for testing using individual and hybrid classifier. This file is tested by classifiers to get the values mentioned in Table 4 as per confusion matrix shown in Table 3.
Observations shown in Table 4 are tested on all classifier in the real time environment. The input packet is taken from the network to test the distributed denial of services attack. Packets used for testing proposed model are more than 1.5 lakhs packets. Preprocessing and normalization is done for each classifier as per the requirement of classifier. Each classifier is train separately with NSL KDD dataset. Each classifier is tested separately to find detection accuracy and false alarm rate. From these observations it is seen that the random forest predicts more amount of packets correctly as compared to support vector machine and other classifiers. Firstly the true positive and false positive packets generated by each classifier are estimated and finally tried to estimate with the proposed hybrid system. From the observations presented in Table 4, it is concluded that proposed hybrid approach gives better rate of correct prediction of attack as compared to any of the single classifier. Less number of packets are misclassified in hybrid model as compared to single classifier which help us to increase detection rate of packets in real time environment.
5.2 Receiver operating characteristics curves
ROC is a tool for comparing two or more classifiers and represents it in the form of curves. ROC curve is a useful visual tool for comparing two or more classification models. ROC curves can represent the trade-off between true positive rate (TPR) and false positive rate (FPR) on y and x axis respectively for a given model. TPR is an amount of positive (C1) tuples which are correctly classified and labeled by model; FPR is an amount of negative ( ) tuples that are misclassified and mislabeled as positive instead of negative as describe in Table 3.
Table 4. Tested values of confusion matrix for all classifiers
|
Classifier |
|
C1 |
¬C1 |
|
Support Vector Machine(SVM) |
C1 |
83884 |
4058 |
|
¬C1 |
10163 |
40436 |
|
|
Gaussian Naïve Bayes (NB) |
C1 |
80809 |
6735 |
|
¬C1 |
17080 |
32590 |
|
|
Random Forest (RF) |
C1 |
85765 |
2266 |
|
¬C1 |
860 |
49650 |
|
|
Logistic Regression |
C1 |
83747 |
4066 |
|
¬C1 |
16794 |
32607 |
|
|
K Nearest Neighbor(KNN) |
C1 |
87105 |
1092 |
|
¬C1 |
408 |
49936 |
|
|
Decision Tree (DT) |
C1 |
84953 |
1309 |
|
¬C1 |
251 |
50498 |
|
|
Stochastic Gradient Descent (SGD) |
C1 |
85055 |
2705 |
|
¬C1 |
17874 |
31580 |
|
|
Hybrid |
C1 |
87186 |
1140 |
|
¬C1 |
264 |
49951 |
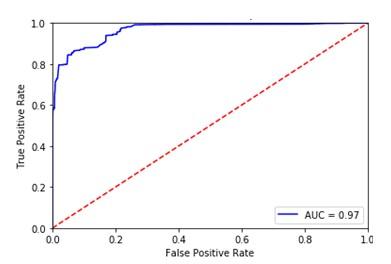
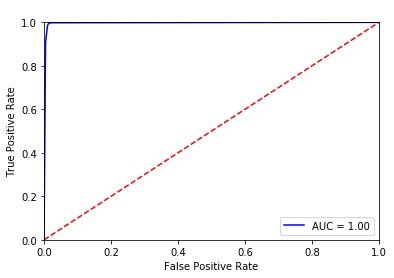
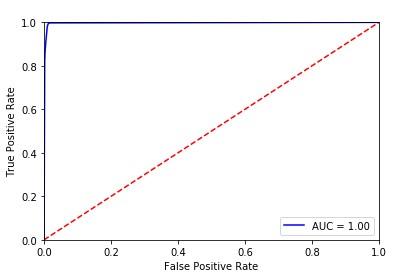
SVM (Figure 3(a)) classifier shows the variation rate of true positive with rate of false positive. As curve is not close to the left hand border, results in less area under curve leads to less accurate outcome. From Figure 3 (b) it is observed that curve for NB is far away from left and right hand border which leads to less accuracy. In RF curve is closer to both the borders but as compared to DT it gives less accuracy as shown if Figure 3(c). Logistic Regression is having less accuracy as shown in ROC curve of Figure 3(d). Figure 3(e) shows the area covered under ROC curve for KNN which is closer to left hand border leads towards more accuracy. Figure 3(f) shows ROC for DT which is much closer to the left hand border and top border tends to more accurate results. From Figure 3(g) we can observe that accuracy reduce drastically for SGD. From Figure 8(h) it is seen that ROC curve for hybrid model covers more area under curve as it is closer to left hand border and on the top border. These curves are used to check the accuracy of each classifier with the help of confusion matrix.
Table 4 present the confusion matrix. Eqns. (5-7) are used to estimate accuracy, true positive rate and false positive rate.
Accuracy=(TP+TN)/TotalObservation (5)
TPR=TP/C1 (6)
$FPR=FP/\overline{{{C}_{1}}}$ (7)
From Figure 3 (a) and Table 5 it is observed that SVM results in misclassification when it comes to unknown attack so it gives only 0.89 accuracy. Biased prediction can be given by SVM as it is a binary classifier. To avoid it proper preprocessing need to carry out for SVM. Naive Bayes classifier shows less accuracy of 0.82 with more false alarm rate of 0.34 with tends to more misclassification of packets. For RF the accuracy is better it is up to 0.97 if the number of trees is more. Detection accuracy increases as more umber of trees used. Time require to train will be more as we increase number of trees which is not feasible with live data. Logistic Regression shows less accuracy as compared to KNN algorithm as both are used to find change in behavior pattern of traffic. For KNN accuracy is up to 0.96, but again it fails to classify unknown attacks by checking behavior. Reduced false alarm rate id observed with help of KNN. For DT classifier its gives accuracy up to 0.97, but most of the time output can be biased as DT cannot handle overfitting of data in the large size of input. As the input is taken from internet lakhs or packets travel through the network in minimum time so to handle overfitting decision tree need to be used with some other classifier to improve classification accuracy. SGD also fails to improve accuracy as compare to remaining classifiers. After observing the results we can conclude that none of the single classifier is able to provide high detection rate with less false alarm rate. A new proposed system is develop called as hybrid system which will remove all the lacunas from mentioned classifiers. In proposed hybrid system the output of all classifiers is ensemble and tested on real time data to check the accuracy. This system obtained accuracy up to 0.98 (98%) with reduced false alarm rate of 0.09. This system is able to analyze known as well as unknown attacks with high accuracy.
a. ROC curve for SVM
b. ROC curve for NB
c. ROC curve for RF
d. ROC curve for LR
e. ROC curve for KNN
f. ROC curve for DT
f. ROC curve for SGD
g. ROC curve for Hybrid
Figure 3. (a-g) Receiver operating characteristics curves
Table 5. Comparison of classifier output with proposed hybrid model
|
Classifier |
SVM |
NB |
RF |
LR |
KNN |
DT |
SGD |
Hybrid |
|
Accuracy |
0.897351 |
0.82643 |
0.977436 |
0.897974 |
0.969172 |
0.97740 |
0.850022 |
0.982665 |
|
True Positive Rate |
0.953 |
0.9230 |
0.97425 |
0.953 |
0.9776 |
0.96740 |
0.9691 |
0.96709 |
|
False Positive Rate |
0.20081 |
0.3438 |
0.08512 |
0.3395 |
0.08112 |
0.09566 |
0.360 |
0.0925 |
Table 6 shows the comparison of other classifiers with proposed system. Aburomman et al. [25] explains various methods to obtain more accuracy with less false alarm rate that is false positive rate by ensembling more classifiers rather than using single classifier. Data mining supervised, unsupervised and semi supervised algorithms can be used to increase accuracy. In [26] authors use k means algorithm with two level hybrid approach to increase the detection accuracy. Multi-level SVM-EML model is used in hybrid manner in [27] to classify known attacks. Authors also try to observe behavior of network for anomaly detection using adaptive SVM model. Accuracy achieved is 95.86 % with using all 41 features of KDD99 dataset. Multi-class SVM is used by authors in [28] to increase accuracy by ensembling multiple SVMs together. Authors explained a hybrid approach [29] by combination of strangeness isolation and l nearest neighbor algorithm which is used for detection of all four types of attacks from KDD dataset. They obtained 95.1 % accuracy with 3.0 false alarm rate. In [31] authors used fuzzy rule-based system for proposing novel framework based on agent based strategy. It also used multi objective technique for improving detection accuracy. In [32] authors make use of three tier architecture for cleaning and preprocessing of data followed by SVM classifier for testing data. Accuracy obtained is 94.71 with 3.8 false alarm rate. Use of various techniques in collaborative and distributed intrusion detection system results in improving accuracy of detection [33]. Authors [34] used KNN algorithm for detection of misuse and anomaly based attack detection and obtained 93.29 % accuracy and 0.78 false alarm rate. From Table 7 and Figure 9 it is proved that single classifiers provide less accuracy of detecting signature and anomaly attack. Less true positive rate and falser positive rate is result of less accuracy. The ensembling assistances in improving the accuracy, true positive rate and reduces false positive rate.
Table 6. Comparison of proposed system with other classifiers
|
Classifiers |
FPR (%) |
Accuracy (%) |
|
Two level Hybrid[26] |
0.78 |
93.29 |
|
SVM-ELM[27] |
2.13 |
95.86 |
|
Multiclass SVM[28] |
0.43 |
92.46 |
|
Three tier IDS[32] |
3.8 |
94.71 |
|
CSI-KNN[33] |
3.0 |
95.1 |
|
MOGFIDS[31] |
1.6 |
93.2 |
|
Hybrid KNN[34] |
0.78 |
93.29 |
|
Proposed hybrid system |
0.09 |
98.2 |
In this a novel approach of ensembling multiple supervised and unsupervised algorithms for classification is proposed. All classifiers are trained using one of the algorithms which supports high detection rate and less false alarm rate in live environment for distributed systems. Classifiers are trained with NSL KDD dataset. Total features of dataset are 41. Required normalization is done for each classifier as per the requirement to clean and reduce noise from dataset. To reduce processing time required to train and test the date a novel feature selection technique is used to reduce features. Features are reducing according to the probability of each feature for detecting attacks. In total 9 features are used for detection of live data by each classifier instead of all features (total 41) of NSL KDD dataset. Reduced features provide benefit in reducing processing time while detection of attack. In proposed system time required to train and test system is less as reduced features are used. The accuracy obtained by hybrid classifier has improved by 8% as compared to single classifier. Results also showed the reduction in false alarm rate by 3% as compared to single classifier. This system is used to detect misuse as well as anomaly attacks with less processing time due to novel feature reduction technique. Less processing time gives advantage in distributed environment for accurate detection, falser true positive rate and less false positive rate.
[1] Scarfone K., Mell P. (2007). Guide to Intrusion Detection and Prevention Systems (IDPS). National Institute of Standards & Technology, Gaithersburg, MD, United States, SP 800-94.
[2] Denning D. (1987) An intrusion-detection model. IEEE Transaction on Software Engineering 13(2): 222-232. https://doi.org/10.1109/TSE.1987.232894
[3] Yan Q, Yu F. (2015). Distributed denial of service attacks in software-defined networking with cloud computing. IEEE Communication Magazine 53(4): 52–59. https://doi.org/10.1109/MCOM.2015.7081075
[4] Depren O, Topallar M, Anarim E, Ciliz M. (2005). An intelligent intrusion detection system (IDS) for anomaly and misuse detection in computer networks. Expert Systems with Applications 29(4): 713–722. https://doi.org/10.1016/j.eswa.2005.05.002
[5] Hasan M, Nasser M, Pal B. (2013). On the kdd’99 dataset: Support vector machine based Intrusion Detection System (IDS) with different kernels. International Journal of Electronics Communication and Computer Engineering 4(4): 1164-1170.
[6] Sung A, and Mukkamala S. (2003). Identifying important features for intrusion detection using support vector machines and neural networks. Proceedings of the International Symposium on Applications and the Internet. IEEE Press, Orlando, Fla, USA, pp. 209-216. https://doi.org/10.1109/SAINT.2003.1183050
[7] Wang Q, Megalooikonomou V. (2005). A clustering algorithm for intrusion detection. Defense and Security, International Society for Optics and Photoics, pp. 31-38. https://doi.org/10.1117/12.603567
[8] Farnaaz N, Jabbar M. (2016). Random forest modeling for intrusion detection system. Elsevier Procedia Computer Science 89: 213-127. https://doi.org/10.1016/j.procs.2016.06.047
[9] Pal B, Hasan M. (2012). Neural network & genetic algorithm based approach to network intrusion detection & comparative analysis of performance. 15th International Conference on Computer and Information Technology (ICCIT), Chittagong, pp. 150-154. https://doi.org/10.1109/ICCITechn.2012.6509809.
[10] Roberto P, Davide A, Prahlad F, Giorgio G, Wenke L. (2009). McPAD: A multiple classifier system for accurate payload-based anomaly detection. Elsevier Computer Network 53(6): 864–81. https://doi.org/10.1016/j.comnet.2008.11.011
[11] Borji A. (2007). Combining heterogeneous classifier for network intrusion detection. Advances in Computer Science. Computer and Network Security, Lecture Notes in Computer Science, Springer, Berlin Heidelberg 4046: 254-260. https://doi.org/10.1007/978-3-540-76929-3_24
[12] Barbara D, Wu NN, Jajodia S. (2001). Detecting novel network intrusions using Bayes. Proceedings of the 1st SIAM International Conference on Data Mining. https://doi.org/10.1137/1.9781611972719.28
[13] Amin A, Reaz M. (2016). A novel SVM-kNN-PSO ensemble method for intrusion detection system. Applied Soft Computing 38: 360–72. https://doi.org/10.1016/j.asoc.2015.10.011
[14] Jha J, Ragha L. (2013). Intrusion detection system using support vector machine. International Journal of Applied Information Systems, Foundation of Computer Science FCS, New York, USA. https://doi.org/10.5120/icwac1342
[15] Jungsuk S, Takakura H, Okabe Y, Nakao K. (2013). Toward a more practical unsupervised anomaly detection system, Elsevier Information Sciences 231: 4–14. https://doi.org/10.1016/j.ins.2011.08.011
[16] Choi S, Chae H, Jo B, Park T. (2013). Feature selection for intrusion detection and NSL-KDD. Recent Advances in Computer Science 184-187.
[17] Littlestone N, Warmuth M. (1994). The weighted majority algorithm. Elsevier Information and Computation 108(2): 212-261. https://doi.org/10.1006/inco.1994.1009
[18] Jiong Z, Zulkernine M, Haque A. (2008). Random-forests based network intrusion detection systems. IEEE Transaction of System, Man, Cybernetics 38(5): 649–659. https://doi.org/10.1109/TSMCC.2008.923876
[19] Hasan M, Nasser M, Pal B, Ahmad S. (2014). Support vector machine and random forest modeling for intrusion detection system. Journal of Intelligent Learning Systems and Applications 6(1): 45-52. https://doi.org/10.4236/jilsa.2014.61005
[20] Sindhu S, Siva S, Geetha S, Kannan. (2012). A decision tree based light weight intrusion detection using a wrapper approach. Elsevier Expert System and Applications 39(1): 129-141. https://doi.org/10.1016/j.eswa.2011.06.013
[21] Jungsuk S, Takakura H, Okabe Y, Yongjin K. (2009). Unsupervised anomaly detection based on clustering and multiple one-class SVM. IEICE Transaction on Communication 92(6): 1981–1990. https://doi.org/10.1587/transcom.E92.B.1981
[22] Horng SJ, Su MY, Chen YH, Kao TW, Chen RJ, Lai JL, Perkasa CD. (2011). A novel intrusion detection system based on hierarchical clustering and support vector machines. Elsevier Expert Systems with Applications 38(1): 306–313. https://doi.org/10.1016/j.eswa.2010.06.066
[23] Chou T, Yen K, Luo J. (2008). Network intrusion detection design using feature selection of soft computing paradigms. International Journal of Computer, Electrical, Automation, Control and Information Engineering 2(11): 3722-3734. https://doi.org/10.5281/zenodo.1331229
[24] Hasan M, Nasser M, Ahmad S, Molla K. (2016). Feature Selection for Intrusion Detection Using Random Forest. Journal of Information Security 7(3): 129-140. https://doi.org/10.4236/jis.2016.73009
[25] Aburomman A, Reaz M. (2016). A survey of intrusion detection systems based on ensemble and hybrid classifiers. Elsevier Computer and Security 65: 135-152. https://doi.org/10.1016/j.cose.2016.11.004
[26] Guo C, Ping CY, Liu N, Luo S. (2016). A two-level hybrid approach for intrusion detection. Neurocomputing 214: 391–400. https://doi.org/10.1016/j.neucom.2016.06.021
[27] Al-Yaseen W, Othman Z, Nazri Z. (2016). Real-time multi-agent system for an adaptive intrusion detection system. Elsevier Pattern Recognition Letters 65: 56-64. https://doi.org/10.1016/j.patrec.2016.11.018
[28] Ambwani T. (2003). Multi class support vector machine implementation to intrusion detection. Proceeding IEEE International Joint Conference on Neural Networks, pp. 2300-2305. https://doi.org/10.1109/IJCNN.2003.1223770
[29] Kuang L, Zulkernine M. (2008). An anomaly intrusion detection method using the CSI-KNN algorithm. ACM Symposium on Applied Computing, pp. 921–926. https://doi.org/10.1145/1363686.1363897
[30] Khonde S, Ulagamuthalvi V. (2019). Ensemble based semi-supervised learning approach for a distributed intrusion detection system. Journal of Cyber Security Technology, Taylor and Francis. Article in press.
[31] Tsang C, Kwong S, Wang H. (2007). Genetic-fuzzy rule mining approach and evaluation of feature selection techniques for anomaly intrusion detection. Pattern Recognition 40: 2373–2391. https://doi.org/10.1016/j.patcog.2006.12.009
[32] Hwang T, Lee T, Lee Y. (2007). A three-tier IDS via data mining approach. Proceedings of Annual ACM Workshop on Mining Network Data, Minenet, pp. 1-6. https://doi.org/10.1145/1269880.1269882
[33] Folino G, Sabatino P. (2016). Ensemble based collaborative and distributed intrusion detection systems: A survey. Elsevier Journal of Network and Computer Applications 66: 1-16. https://doi.org/10.1016/j.jnca.2016.03.011
[34] Guo C, Ping Y, Liu N, Luo S. (2016). A two-level hybrid approach for intrusion detection. Elsevier Neurocomputing 214: 391-400. https://doi.org/10.1016/j.neucom.2016.06.021