Titi Kurniati![]() | Purnawan Purnawan*
| Purnawan Purnawan*![]() | Yosritzal Yosritzal
| Yosritzal Yosritzal![]() | Elsa Eka Putri
| Elsa Eka Putri![]()
© 2025 The authors. This article is published by IIETA and is licensed under the CC BY 4.0 license (http://creativecommons.org/licenses/by/4.0/).
OPEN ACCESS
In Indonesia, two-wheeled vehicles, or motorbikes, make up over 80% of all motorized vehicles. These bikes are popular due to their affordability, fuel efficiency, and ability to navigate through traffic quickly. However, the high volume of motorbikes leads to complicated traffic patterns and poses safety risks. To enhance the safety of motorcyclists, lane separation is the most effective engineering solution. This research aims to develop a design model for an exclusive motorcycle lane (EML) on arterial roads in urban areas through microsimulation. The EML design model is created using traffic simulations conducted with PTV VISSIM 2020. The inputs for the simulation are EML width and motorcycle (MC) volume. The EML width ranges from 3.0 meters to 4.0 meters, while the MC volume varies from 910 MC/hr to 4800 MC/hr. The output of the simulation is analyzed to establish the relationship between EML width, motorcycle volume, and the volume-to-capacity ratio (VCR). The modeling will yield the maximum motorcycle volume for each EML width, as well as the relationships between volume, speed, and VCR. According to the EML design model, the maximum MC volume for an EML width of 3.0 m is 3,889 MC/hr, a 3.25 m width, 4,175 MC/hr, a 3.5 m width, 4,565 MC/hr, a 3.75 m width, 5,000 MC/hr, and a 4.0 m width, 5,140 MC/hr.
exclusive motorcycle lane design, MC volume, operational speed, volume-to-capacity ratio
Motorcycles are the most popular vehicle as a mode of transportation in several Asian countries, especially ASEAN countries [1]. In Indonesia, data from 2024 shows that the number of motorcycles has reached 130 million units, accounting for 84.3% of the total 157 million motorized vehicles [2]. The high ownership of motorcycles is attributed to their affordability compared to other forms of transportation, their ability to provide door-to-door connectivity, and their compact size, which allows for greater maneuverability. In many Indonesian cities, motorcycles make up nearly 90% of the traffic flow [3]. This significant presence of motorcycles leads to complex traffic operations [4] and a decline in safety levels [5]. In many Southeast Asian countries, motorcycle accidents account for nearly 70% of all road traffic crashes [6]. Not only is there a high accident rate among motorcyclists [7], but the operational speed of other vehicles also decreases, contributing to road congestion [8].
Research indicates that lane separation is the most effective engineering solution to enhance the safety of motorcyclists. Creating exclusive motorcycle lanes has proven to be an effective measure in reducing fatalities by 74%, yielding a four-fold benefit-to-cost ratio for the government [9].
Indonesia, Malaysia, the Philippines, Taiwan, Sri Lanka, and India have all implemented motorcycle lanes [5]. However, only Malaysia has established guidelines for designing the geometry of these lanes. Indonesia has specific guidelines for designing special motorbike lanes for toll bridges [10]. The exclusive motorcycle lane (EML) design specifications on urban arterial roads indicate a width of 1.75 meters, intended for one direction with a single lane. It is designed to accommodate a planned capacity of 2,400 Passenger Car Unit (PCU) per day. However, research on urban arterial roads reveals that the volume of motorcycles has surpassed 2,400 PCU per day [11-13]. Therefore, it is necessary to reference this data to effectively design the EML to meet current demand.
This research develops a model for designing motorcycle lanes using simulation. Meanwhile, traffic simulation models have become an essential and popular tool in modeling transportation systems because the process is fast using computers. One of the significant advantages of using such simulation modeling is assessing different alternatives to the scenario before implementation [14].
1.1 Motorcycle lanes
Motorcycle (MC) is a two-wheeled motorized vehicle with or without housing and with or without a side carriage or a three-wheeled motorized vehicle without housing [15]. Typically, motorbikes measure approximately 1.8 to 2.2 meters in length, 0.7 to 0.9 meters in width, and 1.1 to 1.3 meters in height [15].
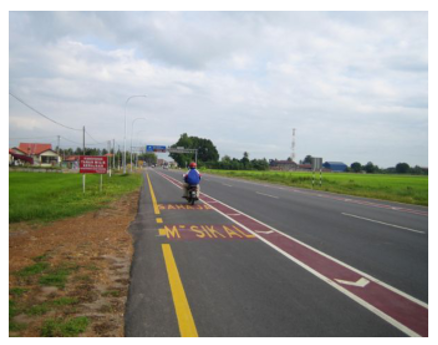
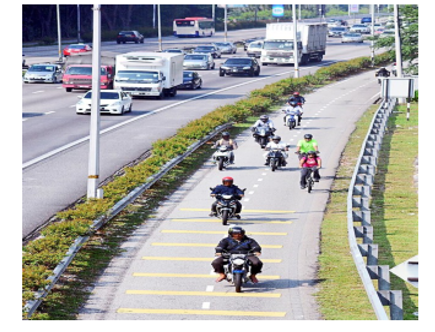
Motorcycle lanes can be categorized into two types: inclusive and exclusive. An inclusive motorcycle lane (non-exclusive motorcycle lane, NEML) is designed to serve motorcyclists by separating motorcycles from other vehicles through the use of traffic signs and road markings (Figure 1) [16]. In contrast, an exclusive motorcycle lane provides a distinct lane for motorcycles, utilizing physical barriers such as road separators or curbs to keep motorcycles separate from other vehicles (Figure 2) [16]. Both types of motorcycle lanes aim to reduce the number of accidents involving motorcycles by ensuring a physical separation from other vehicle types.
Figure 1. Inclusive motorcycle lane [16]
Figure 2. Exclusive motorcycle lane [16]
1.2 Literature review
In Malaysia, guidelines stipulate that the provision of motorbike facilities on non-expressway roads is necessary when specific criteria are met [16]. These criteria include:
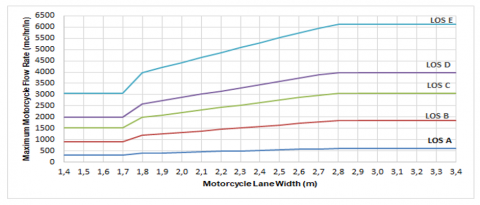
Factors such as the width of the motorbike lane and the level of service (LOS) are considered to determine the maximum motorcycle service flow rates. The LOS value is derived from the headway and space concept, as illustrated in Figure 3.
Figure 3. Maximum motorcycle flow rates for various LOS and lane widths [16]
Hussain et al. [17] estimated the capacity of the EML based on two types of driving patterns: headway patterns and space patterns. The model establishes the relationship between volume and speed according to the headway driving patterns, resulting in a maximum capacity of 3,060 MC per hour per lane. In contrast, considering riding patterns based on space, the maximum capacity is 2,207 MC per hour per meter.
In Thailand, according to research by Mama and Taneerananon [18], the provision of EML is warranted if the following conditions are met:
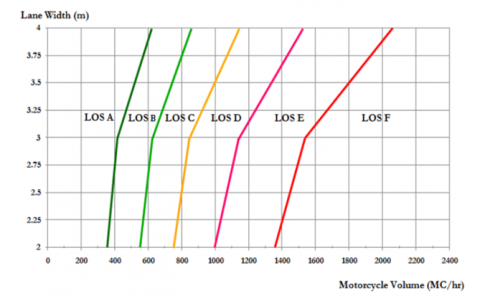
Simulation results using VISSIM 5.4 indicate that at a LOS D, the following capacities can be accommodated based on lane widths [18]:
Figure 4. Relationship between MC volume, lane width and LOS [18]
The requirement for dedicated motorbike lanes in Indonesia is based on operational speed and the annual average daily traffic (AADT), as indicated in Table 1. Motorbikes constitute 40% of the total AADT [15].
Motorcycle lanes are necessary when the volume of motorcycles exceeds 600 per hour per lane. This requirement is based on the observation that there should be a minimum headway of 6 seconds between each motorcycle on urban roads. Consequently, this headway allows for a total of 600 motorcycles to pass in one hour [19].
The minimum and maximum widths for motorbike lanes designed for two motorbikes to travel in parallel are 261 meters and 368 meters, respectively [12].
Table 1. Specifying the type of motorbike lane [15]
|
Type of Facility |
MC AADT (PCU/day) |
Speed (km/hr) |
|
|
1,200-10,000 |
>10,000 |
||
|
NEML |
Yes |
- |
< 40 |
|
EML |
Yes |
Yes |
> 40 |
According to guidelines for designing motorbike lanes on toll bridges, these lanes should be positioned in the leftmost section of the road and must be physically separated from lanes designated for vehicles with four or more wheels (EML type). The width allocated for one motorbike is 2.0 meters, allowing for a capacity of 1,320 motorbikes per hour per lane. For two motorbikes, the required width is 3.3 meters, which enables a capacity of 2,640 motorbikes per hour per lane [11].
Research conducted in Jakarta shows that the implementation of special motorbike lanes significantly improves road performance. The LOS for these lanes increased from F to C. In contrast, the service level for non-motorcycle lanes slightly decreased from B to C [12].
Research conducted in Bali indicates that the implementation of motorcycle lanes positively impacts road traffic. This is evidenced by the volume-to-capacity ratio (VCR) values: roads with motorcycle lane facilities show VCR values of 0.42 and 0.54. In contrast, roads without motorcycle lanes have VCR values of 0.34 and 0.43 [13].
Based on the collected literature, Indonesia currently lacks a reference for designing EML for urban arterial roads that considers the relationship between MC volume and VCR. Researchers aim to address this gap by developing a microsimulation model for EML design.
2.1 Simulation data
The lane type examined in this study is the EML, which restricts access to MC only. The model input parameters are derived from data collected in previous studies, focusing on total traffic volume, motorcycle traffic volume, traffic speed, and motorcycle speed.
The EML design model is generated through traffic simulations using PTV VISSIM 2020. This involves inputting lane configuration and width data and analyzing the modeling results to examine the relationships between MC volume, lane width, and VCR. The input parameters for traffic behavior were determined based on observations from previous studies [3, 20]. The dimensions of the MC were selected to be 2.0 meters in length and 0.85 meters in width, which are considered appropriate for the traffic characteristics in Indonesia.
The methodology for determining the free flow speed of motorcycles involved video recording on a specific road segment. The selection of survey sites was based on observing the speed of vehicles passing through the segment, which includes both constant and unexpected traffic. The length of the road segment used for data collection was 20 meters. The survey was conducted between 6:00 AM and 6:15 AM. Data collected consisted of the number of motorcycles and the travel time for each motorcycle as they passed through the survey location [20].
Table 2. MC free flow speed distribution
|
Speed (km/h) |
Cumulative Frequency |
|
35 |
0.10 |
|
45 |
0.46 |
|
55 |
0.88 |
|
65 |
1.00 |
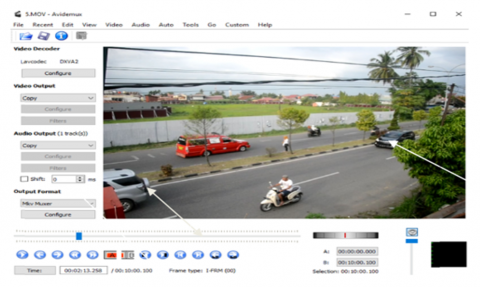
Video footage was analyzed using Avidemux software, which displayed the results on a laptop monitor marked along the 20-meter stretch. The screen recorded the travel time of motorcycles in milliseconds (Figure 5). During the 15-minute survey, 208 motorcycles were counted, and their travel times were measured, providing a sufficient sample size for analysis. The travel time data was then converted into spot speed data, which was organized into a speed distribution (Table 2).
Figure 5. Presentation of recorded results
2.2 Calibration
Calibration in VISSIM involves establishing the appropriate parameter values to replicate real traffic conditions closely. This process can be informed by observed regional driver behavior. In VISSIM, driver behavior characteristics can be adjusted by setting parameters based on three key aspects: car-following behavior, lane-changing behavior, and maintaining appropriate lateral distance between vehicles (lateral behavior) [3].
The car-following model represents how drivers follow the vehicles in front of them. VISSIM utilizes a stochastic traffic flow model that operates in time stages, treating each vehicle as an individual unit. Three car-following models are available to manage driver behavior: No Interaction, Wiedemann 74, and Wiedemann 99.
- The No Interaction model is for vehicles that do not recognize or react to other vehicles.
- The Wiedemann 74 model is suitable for urban traffic and mixed environments.
- The Wiedemann 99 model is ideal for freeways that lack regional merging [3].
In this study, the Wiedemann 74 model is the most appropriate choice for the traffic conditions at the study location. It effectively accounts for how drivers maintain a safe distance both in front of and behind their vehicles.
The parameters selected in the VISSIM calibration process are as follows:
The calibration parameters for driving behavior were sourced from research by Irawan and Putri [3], as shown in Table 3.
Table 3. Driving behaviors calibration parameters
|
|
Calibration Parameter |
Default |
Calibration |
|
Car Following Model |
Average Standstill Distance |
2.00 m |
0.60 m |
|
Additive Part of Safety Distance |
2.00 m |
0.60 m |
|
|
Multiplicative Part of Safety Distance |
3.00 m |
1.00 m |
|
|
Lateral |
Desire Position at Free Flow |
Middle of line |
Any |
|
Lateral Distance Standing |
0.20 m |
0.2 m |
|
|
Lateral Distance Driving |
1.00 m |
0.5 m |
|
|
Overtake on Same Lane |
Off |
On |
2.3 Validation
Validation in VISSIM entails verifying the accuracy of the simulation calibration by comparing observed data with the results generated by the simulation. Various methods can be employed for validation, depending on the specific parameters being assessed. In this research, we utilized two statistical approaches: the Chi-squared formula, specifically the Geoffrey E. Havers (GEH) statistical formula (Eq. (1)) [21], and the Root Mean Square Error (RMSE) [22, 23]. The GEH formula has specific criteria for the resulting error values, as shown in Table 4. RMSE values of 0 indicate a perfect fit.
$G E H=\sqrt{\frac{\left(q_{\text {simulated }}-q_{\text {observed }}\right)^2}{0.5 *\left(q_{\text {simulated }}+q_{\text {observed }}\right)}}$ (1)
where, q = traffic flow volume (vehicles/hour).
RMSE is defined as the square root of the mean of the squares of the sum of the errors in the prediction model (Eq. (2)) [23].
Table 4. Conclusion of GEH value
|
GEH Value |
Conclusion |
|
GEH < 5.0 |
Accepted |
|
5.0 ≤ GEH ≤ 10.0 |
Warning: Possible model error or bad data |
|
GEH > 10.0 |
Rejected |
The validation process focuses on the volume and operational speed of motorbikes. The results obtained from the VISSIM simulation were compared with observational data from research conducted by Hussain et al. [17]. The volume of motorbikes was validated using the GEH statistical formula (Table 5), while the operational speed was validated using the RMSE formula (Table 6). The outcomes from the GEH and RMSE tests indicate that the results are acceptable and accurate, confirming that the model accurately represents the actual conditions in the field.
$R M S E(\%)=\frac{\sqrt{\frac{1}{n} \sum\left(A_t-F_t\right)^2}}{\sum A_t / \mathrm{n}}$ (2)
where,
n = number of data;
At = observation data;
Ft = simulation model data.
Table 5. Validation of MC volume with GEH
|
Observed Volume (veh/hr) |
Simulated Volume (veh/hr) |
% diff |
GEH |
Conclusion |
|
600 |
595 |
0.83 |
0.20 |
<5; acceptable |
|
1,400 |
1,392 |
0.57 |
0,21 |
<5; acceptable |
|
1,800 |
1,783 |
0.94 |
0.40 |
<5; acceptable |
Table 6. Validation of MC speed with RMSE
|
Observed Volume (veh/hr) |
Observed Speed (km/hr) |
Simulated Speed (veh/hr) |
RMSE |
Conclusion |
|
600 |
40.0 50.0 53.0 |
41.36 |
0.011 |
Very good |
|
1,400 |
29.5 32.0 34.0 |
36.76 |
0.010 |
Very good |
|
1,800 |
22.0 24.0 27.0 |
36.26 |
0.032 |
Very good |
2.4 Modelling data
This study models the EML design to accommodate motorcycle volumes exceeding 2400 PCU/day, allowing for the movement of two or more motorcycles in tandem.
The motorcycle volume is simulated to range from 2,407 PCU/day to 12,667 PCU/day. When converted, this corresponds to a motorcycle volume of 910 MC/hr to 4,800 MC/hr. A trial-and-error approach is used with the VISSIM program to determine the maximum volume that the EML width can accommodate.
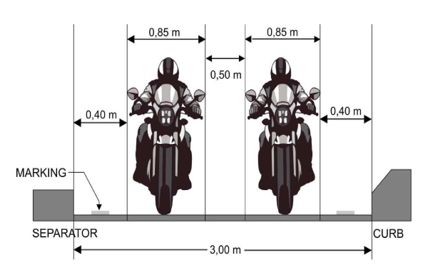
The minimum width requirement for the EML is illustrated in Figure 6, which indicates that the outermost dimensions for a motorbike, when accounting for a separator and a curb, is 0.4 meters. The width of the motorbike itself is 0.85 meters, and the distance between two motorbikes is 0.5 meters. Therefore, the minimum required width for the EML is 3.0 meters. Simulations for modeling the EML were conducted using widths of 3.00 m, 3.25 m, 3.50 m, 3.75 m, and 4.00 m.
Figure 6. EML width
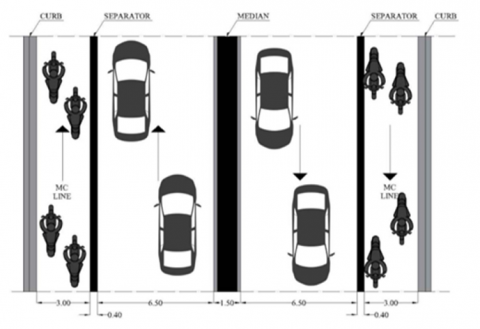
The road types in the EML design pertain to sections within the secondary road network system, classified explicitly as arterial roads. There are two main road types: 6/2-T (6 lanes, 2-way divided) and 4/2-T (4 lanes, 2-way divided). For the 6/2-T road type, each traffic lane measures 10.5 meters wide. According to the design drawings, the construction of the EML does not necessitate widening. The application of EML on arterial roads can be seen in Figure 7.
Figure 7. Traffic lane width
The modeling used MC volume parameters, EML width, and volume-to-capacity ratio. EML capacity is determined based on the 2023 Indonesian Road Capacity Guidelines for urban roads [24]. Capacity is the maximum traffic volume that can be maintained along a particular road segment or intersection for 1 (one) hour under certain conditions covering geometry, environment, and traffic.
Capacity (C) calculation for 4/2-T and 6/2-T divided road types is determined for each direction and each lane. C road segment is calculated using Eq. (3).
C = C0× FCLJ× FCHS× FCUK (3)
C is the observed road segment capacity, PCU/hour (PCU/hr).
C0 is the basic capacity of the ideal road segment condition.
FCLJ is the capacity correction factor due to the difference in lane width from the ideal condition.
FCHS is the capacity correction factor due to the condition of side friction (HS) on roads equipped with shoulders, curbs, or sidewalks.
FCUK is the capacity correction factor due to the size of the city that is different from the ideal city size.
Basic capacity conditions (C0) are roads with straight geometric conditions, a minimum length of 300 m, an average effective lane width of 3.50 m, a covered curb or shoulder, a city size of 1-3 million people, and low side friction. The C0 value is 1,700 PCU/hr.
Environmental conditions are assumed to have low side friction on roads with curbs and the ideal city size. By entering the capacity correction factor value, the EML's capacity value is determined. Table 7 shows the EML capacity values.
Table 7. EML capacity
|
EML Width (m) |
FCLJ |
FCHS |
C (PCU/hr) |
|
3.00 |
0.92 |
0.94 |
1,470 |
|
3.25 |
0.96 |
0.94 |
1,534 |
|
3.50 |
1.00 |
0.94 |
1,598 |
|
3.75 |
1.04 |
0.94 |
1,662 |
|
4.00 |
1.08 |
0.94 |
1,725 |
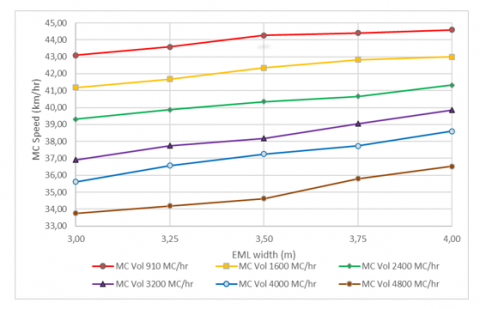
The simulation results in Figure 8 illustrate the relationship between EML width and operational speed. The lowest speed recorded is 33.75 km/hr, when the MC volume is 4,800 motorcycles per hour (MC/hr), and the EML width is 3.0 meters. Conversely, the highest speed recorded is 44.58 km/hr, when the MC volume is 910 MC/hr, and the EML width is 4.0 meters.
Figure 8. MC speed-EML width-MC volume relationship
It can be concluded that a motorcycle's speed is influenced by the width of the EML and the motorcycle's volume. When comparing motorcycles of a certain volume, those traveling on a 4-meter-wide EML tend to achieve higher speeds than those on a 3-meter-wide EML. This difference in speed is attributed to the increased lateral distance available for maneuvering on a wider lane. Based on this information, it is possible to determine an appropriate speed limit for the EML.
A Pearson correlation test was performed to assess the linear relationship between MC Speed, EML width and MC volume. The test results are presented as a correlation coefficient value (r). The r values, which range from 0.96 to 0.99, indicate a strong linear relationship between EML width and MC speed.
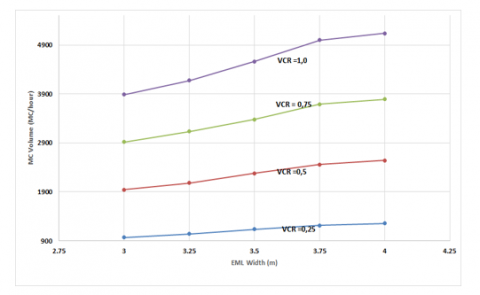
The EML design model generated from the simulation is shown in Figure 9. This model analyzes the relationship between lane width, MC volume, and VCR. From Figure 9, it is evident that at a VCR of 1.0, the maximum volume accommodated by different lane widths is as follows: A lane width of 3.0 m can accommodate 3,889 MC/hr, 3.25 m can accommodate 4,175 MC/hr, 3.5 m can accommodate 4,565 MC/hr, 3.75 m can accommodate 5,000 MC/hr, and a lane width of 4.0 m can accommodate 5,140 MC/hr.
Figure 9. EML design modelling
The simulation results for V/C performance of 0.25, 0.50, 0.75, and 1.00 were subjected to GEH statistical tests. The results showed that the observed and simulation results volume with VISSIM were acceptable.
The width of the EML required to accommodate a specific volume of motorcycles can be calculated using this model. For instance, if the EML is designed to handle a motorcycle volume of 3,500 SM/hr with a VCR of 0.75, the required width of the EML will be 3.75 meters. However, if environmental conditions prevent designing the EML with a width of 3.75 meters, narrowing the width will result in an increased VCR value, which in turn will diminish the performance level of the EML.
The findings of this study indicate that the maximum volume that can be accommodated by an EML width of 3.00 to 4.00 meters in each direction is between 3,889 and 5,140 MC/hr.
The implementation of EML is recommended for roads classified as type 6/2-T (6 lanes, 2-way divided) with a total width of 11.0 meters. This recommendation is based on the fact that an EML with a width of 3.0 to 4.0 meters per direction can be accommodated by slightly reducing the width of the mixed traffic lanes, without the need to add new lanes.
Since the modeling is based on microsimulation, where the simulation results highly depend on validation with observational data, it is necessary to complement the design with the latest field data.
The author gratefully acknowledgment the Department of Civil Engineering, Faculty of Engineering, Universitas Andalas, for their valuable support and funding (contract number: B/35/UN16.09/SPK/PT.01.03/RKAT-UNAND/2025) that made this research possible.
[1] Le, T.Q., Nurhidayati, Z.A. (2016). A study of motorcycle lane design in some Asian countries. Procedia Engineering, 142: 292-298. https://doi.org/10.1016/j.proeng.2016.02.044
[2] Central Statistics Agency. (2022). Jumlah kendaraan bermotor menurut provinsi dan jenis kendaraan (unit), 2022 [in Indonesian]. https://www.bps.go.id/en/statistics-table/3/VjJ3NGRGa3dkRk5MTlU1bVNFOTVVbmQyVURSTVFUMDkjMw==/jumlah-kendaraan-bermotor-menurut-provinsi-dan-jenis-kendaraan--unit---2023.html?year=2022.
[3] Irawan, M.Z., Putri, N.H. (2017). Vissim calibration for microsimulation of mixed traffic flow at signalized intersections (Case study: Tugu Intersection, Yogyakarta), in Bahasa. Jurnal Transportasi Multimoda, 13(3): 97-106. https://doi.org/10.25104/mtm.v13i3.180
[4] Kurniati, T., Putri, E.E. (2020). Evaluation of the implementation of the motorcycle lane based on the riding experience. IOP Conference Series: Materials Science and Engineering, 771(1): 012060. https://doi.org/10.1088/1757-899X/771/1/012060
[5] Saini, H.K., Chouhan, S.S., Kathuria, A. (2022). Exclusive motorcycle lanes: A systematic review. IATSS Research, 46(3): 411-426. https://doi.org/10.1016/j.iatssr.2022.05.004
[6] Phan, V.L. (2016). Crash risk for motorcycle-dominated traffic envirinment of urban road in developing countries. Doctoral dissertation, University of Birmingham, UK. https://etheses.bham.ac.uk/id/eprint/7121/.
[7] Jomkokkruad, C., Sunmud, S., Arreeras, T. (2024). Analyzing traffic and safety violations behavior of motorcyclists in Thailand. International Journal of Transport Development and Integration, 8(4). https://doi.org/10.18280/ijtdi.080409
[8] Minh, C.C., Sano, K., Matsumoto, S. (2005). The speed, flow and headway analyses of motorcycle traffic. Journal of the Eastern Asia Society for Transportation Studies, 6: 1496-1508. https://doi.org/10.11175/easts.6.1496
[9] Manan, M.M.A., Noordin, N.M. (2023). The performance of the exclusive motorcycle lane (EMCL) in reducing fatal crashes among motorcyclists after 20 years of operation. Construction, 3(2): 285-292. https://doi.org/10.15282/construction.v3i2.9838
[10] Mulyadi, A.M. (2015). The relationship between traffic volume, travel speed, degree of saturation, density and traffic flow, on the special motorcycle lane (JKSM) on the Suramadu Bridge [in Indonesian]. Rekayasa Sipil, 4(2): 49-61. https://media.neliti.com/media/publications/270385-hubungan-volume-lalu-lintas-kecepatan-te-2c55809c.pdf.
[11] Idris, M. (2010). Motorcycle lane criteria for secondary arterial roads [in Indonesian]. Jurnal Jalan Jembatan, 27(1): 17. https://binamarga.pu.go.id/jurnal/index.php/jurnaljalanjembatan/article/view/248.
[12] Sari, I.P., Latifa, E.A. (2019). Analysis of the implementation of special motorcycle lanes on road section performance, in Bahasa. Construction and Material Journal, 1(2): 111-122. https://doi.org/10.32722/cmj.v1i2.1473
[13] Mulyadi, A. (2019). Level of service for roads with motorcycle lane or without motorcycle lane in Denpasar. IOP Conference Series: Materials Science and Engineering, 620(1): 012041. https://doi.org/10.1088/1757-899X/620/1/012041
[14] Aghabayk, K., Sarvi, M., Young, W., Kautzsch, L. (2013). A novel methodology for evolutionary calibration of VISSIM by multi-threading. Australasian Transport Research Forum, 36(1): 1-15.
[15] Zukhruf, F., Frazila, R.B., Wibowo, S.S. (2010). Effectiveness of motorcycle lanes on urban roads using a micro-simulation model [in Indonesian]. Jurnal Transportasi, 10(1): 23-32. https://journal.unpar.ac.id/index.php/jurnaltransportasi/article/view/366.
[16] Jabatan Kerja Raya Malaysia. Guideline for Motorcycle Facilities. http://epsmg.jkr.gov.my/images/3/31/NTJ_33-2015_Guidelines_for_Motorcycle_Facilities.pdf.
[17] Hussain, H., Radin Umar, R.S., Ahmad Farhan, M.S. (2011). Establishing speed–flow–density relationships for exclusive motorcycle lanes. Transportation Planning and Technology, 34(3): 245-257. https://doi.org/10.1080/03081060.2011.565175
[18] Mama, S., Taneerananon, P. (2016). Effective motorcycle lane configuration Thailand: A case study of southern Thailand. Engineering Journal, 20(3): 113-121. https://doi.org/10.4186/ej.2016.20.3.113
[19] Mulyadi, A.M., Marpaung, N. (2011). Kriteria Desain Lajur Sepeda Motor (in Indonesian). Bandung: Kementerian Pekerjaan Umum. https://binamarga.pu.go.id/perpustakaan/repositori/kriteria-desain-lajur-sepeda-motor.
[20] Kurniati, T., Purnawan, Yosritzal, Putri, E.E., Fajri, A.N. (2023). The study of motorcycle positions distributions on-road lanes with traffic flow variables. AIP Conference Proceedings, 2599(1): 070015. https://doi.org/10.1063/5.0116817
[21] PTV Group. (2017). Evaluation GEH Statistic (UDA). https://www.scribd.com/document/623432180/GEH-Statistic-ENG.
[22] Chai, T., Draxler, R.R. (2014). Root mean square error (RMSE) or mean absolute error (MAE)? – Arguments against avoiding RMSE in the literature. Geoscientific Model Development, 7(3): 1247-1250. https://doi.org/10.5194/gmd-7-1247-2014
[23] Vandeput, N. (2019). Forecast KPIs: RMSE, MAE, MAPE& Bias. https://www.linkedin.com/pulse/forecast-kpi-rmse-mae-mape-bias-nicolas-vandeput/.
[24] Kementerian Pekerjaan Umum dan Perumahan Rakyat (PUPR). (2023). Indonesian Road Capacity Guidelines, in Bahasa. Report No. 09/P/BM/2023. https://binamarga.pu.go.id/uploads/files/1942/09pbm2023-pedoman-kapasitas-jalan-indonesia-.pdf.