Armando Joseph Suah Meliala*![]() | Prio Utomo
| Prio Utomo![]() | Hally Hanafiah
| Hally Hanafiah![]()
© 2025 The authors. This article is published by IIETA and is licensed under the CC BY 4.0 license (http://creativecommons.org/licenses/by/4.0/).
OPEN ACCESS
Since July 2022, Indonesia's Electronic Customs Declaration (ECD) system has replaced traditional paper-based forms for international arrivals. Although intended to enhance efficiency and user convenience, the system has generated considerable dissatisfaction, with 83.14% of recorded complaints citing technical or usability challenges. This study examines the determinants of passenger satisfaction with the ECD system through an integrated framework that combines the Expectation-Disconfirmation Model (EDM), the Unified Theory of Acceptance and Use of Technology (UTAUT), and the DeLone & McLean Information Systems Success Model. A cross-sectional survey of 207 Indonesian international passengers at Soekarno-Hatta International Airport was analyzed using Partial Least Squares Structural Equation Modeling (PLS-SEM), suitable for evaluating latent constructs and mediation effects in complex models. The results indicate that effort expectancy, drawn from UTAUT, significantly influences perceived system quality and Disconfirmation, both of which serve as critical mediators of user satisfaction. System Quality, based on usability, reliability, and interface design, exerts an indirect effect through Disconfirmation, as conceptualized in EDM and DeLone and McLean's framework. Collectively, the variables explain 86.3% of the variance in satisfaction, with all key paths statistically significant (p < 0.001). These findings underscore the importance of expectation alignment, ease of use, and perceived system quality in shaping satisfaction with digital public services and provide practical insights for user-centered design and implementation of government technologies.
expectation, system quality, disconfirmation, satisfaction, customs airport
The aviation industry makes a significant contribution to economic growth by facilitating the global movement of people and goods. In recent years, the operational priorities of airports have expanded from a primary emphasis on safety and security [1] to include passenger experience and service expectations. This transformation has been driven by the adoption of digital technologies aimed at streamlining airport processes and minimizing inefficiencies [2-4]. These innovations have made airports more competitive by meeting customer needs, enhancing user experience, and shaping traveler expectations toward a more seamless, efficient, and accessible journey [5, 6].
As part of this digital shift, Indonesia introduced the Electronic Customs Declaration (ECD), a platform designed to modernize and replace manual, paper-based customs procedures. From the perspective of customs authorities, the ECD introduces a range of operational advantages: it helps prevent fraudulent activity, strengthens monitoring of transportation flows, reduces wait times, simplifies document verification, alleviates administrative burdens, optimizes resource deployment, and enhances the overall efficiency of anti-fraud mechanisms. By digitizing the customs process, passengers benefit from a more efficient and streamlined clearance experience while ensuring compliance with applicable regulations [7, 8]. Moreover, the integration and standardization of data on a national level enhances the efficiency of customs and excise officers, enabling them to monitor and deliver services, as well as improve administrative efficiency [8]. While from the traveler's perspective, the ECD could also enhance their satisfaction by increasing perceived service quality [9].
At Soekarno-Hatta International Airport, Indonesia's primary international hub, the ECD system was formally implemented in July 2022, aiming to enhance the efficiency and accuracy of customs processing and data handling. Between July and December 2022, SHIA customs received 421 written complaints submitted through multiple formal channels, including social media platforms (Facebook, Twitter, Instagram, and Google Business) and the Internal Compliance and Information Services (ICIS) Division's information desk. A large majority of these complaints, approximately 83.14% (n = 350), centered on difficulties encountered while completing the ECD. An additional 12.83% (n = 54) cited issues with unstable internet connectivity, while only 0.71% (n = 3) raised concerns about inadequate infrastructure. The remaining 3.33% (n = 14) fell into various unspecified categories. This distribution of complaints highlights the prevalence of technical usability challenges in contributing to user dissatisfaction with the ECD system. This pattern of complaints suggests a disconnect between the intended benefits of digitalization and the actual user experience.
These concerns raise a critical question: To what extent do passengers' expectations and system performance shape satisfaction with the ECD systems? Despite the increasing integration of digital systems in the airport customs process, existing studies have offered a limited understanding of how users evaluate these services. Prior studies tend to focus on system performance or regulatory efficiency, often overlooking the subjective, cognitive, and affective processes that drive user satisfaction in public service contexts.
To address this gap, this study employs the Expectation-Disconfirmation Model (EDM), a framework widely used in consumer behavior research. EDM posits that satisfaction results from the comparison between pre-use expectations and post-use perceptions of performance. Its relevance to digital public services lies in its capacity to capture subjective evaluations of system ease, quality, and value. While EDM has been applied in fields such as marketing [10], healthcare [11, 12], tourism [13], and e-governance [14], its extension to airport customs processes offers a novel contribution to both theoretical and practical discussions, particularly in the Indonesian context.
In addition to EDM, this study integrates insights from the Unified Theory of Acceptance and Use of Technology (UTAUT), which identifies effort expectancy and the perceived ease of system use as critical determinants of user acceptance and behavioral intention [15]. Since ECD targets a diverse population including non-tech-savvy users, ease of use is likely to play a substantial role in shaping perceptions of quality and satisfaction.
Furthermore, the research incorporates elements from the DeLone and McLean Information Systems Success Model, particularly System Quality, which is defined by attributes such as reliability, responsiveness, and user interface design, as a key driver of user satisfaction and system use [16]. When combined with EDM’s focus on expectation gaps, this multidimensional approach allows for a comprehensive understanding of how users evaluate digital customs services.
Accordingly, this study examines the factors influencing international passengers' satisfaction with the ECD system at SHIA. It focuses on effort expectancy and system quality as antecedents, and examines the mediating role of perceived Disconfirmation. In doing so, this research addresses a concrete operational challenge in Indonesian customs and contributes to broader scholarly debates on the digitalization of public services and user-centered evaluation frameworks.
The Expectation-Disconfirmation Model (EDM) offers a robust theoretical framework for examining how satisfaction is shaped through the interplay of expectations and perceived service outcomes. According to this framework, satisfaction increases when perceived performance exceeds what users initially anticipated, known as positive Disconfirmation, and declines when outcomes fall short of expectations, resulting in negative disconfirmation [17, 18]. When individuals experience something different from their expectations, they tend to exaggerate the difference, so service performance that exceeds expectations is perceived as exceptionally good. In contrast, service performance that falls below expectations is perceived as extremely poor. When service performance is perceived as exceptionally good (positive Disconfirmation), individuals feel more satisfied compared to when the performance is perceived as very poor (negative Disconfirmation), which leads to dissatisfaction [12].
Although the EDM has been widely applied to assess satisfaction in both public and health service contexts, empirical findings across studies remain inconsistent. For example, Serrano et al. [12] confirmed the whole structure of EDM in a telemedicine setting, showing that both expectations and Disconfirmation significantly influenced patient satisfaction and preferences. Similarly, Morgeson [17] found that EDM effectively explained satisfaction with federal government services, especially when expanded to include trust and ideological factors. Van Ryzin's earlier studies [18, 19], however, noted variability depending on how Disconfirmation was measured—perceived Disconfirmation showed weaker support compared to subtractive measures, raising concerns about the interpretability of the results. Meanwhile, Zhang et al. [20] confirmed the overall validity of EDM in their meta-analysis, but highlighted inconsistencies arising from methodological differences and service contexts. These conflicting findings underscore the need for context-specific analysis. By applying EDM in Indonesia's airport customs environment, this study helps address these empirical gaps and expands the model's application to digital government services.
In addition to the EDM, this study incorporates the UTAUT to enrich the understanding of users' pre-adoption perceptions. UTAUT identifies effort expectancy, the perceived ease of using a system, as a key determinant of behavioral intention to adopt technology [15]. In the context of the ECD system, effort expectancy reflects users’ beliefs about how intuitively and smoothly they can interact with the platform. This perception forms part of their initial expectations, which are later confirmed or disconfirmed after actual system use, aligning with the mechanisms described in EDM. By linking UTAUT to EDM, the study posits that effort expectancy serves as both an antecedent to perceived system quality and a cognitive driver of satisfaction through the process of Disconfirmation. Previous studies in digital public services, such as e-government portals and innovative travel applications, have demonstrated that effort expectancy strongly influences users' evaluations of system performance and satisfaction outcomes [21, 22]. Thus, integrating UTAUT into the EDM framework allows for a more comprehensive examination of how passengers form, experience, and ultimately evaluate their interaction with the ECD system at Soekarno-Hatta International Airport.
Effort expectancy (EE) refers to the degree of ease associated with using a technology or system [15]. In digital public services, ease of use is particularly influential in shaping perceptions of System Quality (SQ). When a system is intuitive, users are more likely to interpret its design, reliability, and overall performance positively. Prior studies on e-services and mobile platforms have consistently shown that high effort expectancy contributes to higher perceived system quality, which in turn leads to greater customer satisfaction [15, 23]. This relationship can also be understood through the EDM, which assumes a correlation between expectations and perceived performance, even though the direction of causality remains undefined. Both constructs are viewed as exogenous, existing prior to the disconfirmation process [19]. According to Morgeson [17], in alignment with the American Customer Satisfaction Index (ACSI) model, expectations are expected to have a positive influence on perceived quality due to limited user engagement or awareness, which restricts objective performance evaluation, or because individuals cognitively align their satisfaction with prior expectations to reduce dissonance [24]. Thus, when systems are perceived as easy to use (high EE), users may interpret this not only as a sign of good usability but also as a fulfillment or even exceedance of their expectations, reinforcing their perception of system quality.
H1: Effort Expectancy has a positive influence on System Quality.
According to the EDM, satisfaction arises when users' perceptions exceed their initial expectations, referred to as positive disconfirmation [17]. EE plays a key role here: when users expect difficulty but instead find a system easy to use, this gap often leads to favorable Disconfirmation.
This result aligns with a previous study on public digital platforms, which supports the notion that systems that exceed usability expectations tend to generate higher perceived disconfirmation [12, 18].
This effect occurs in government services, where users often enter with low or even skeptical expectations due to criticism of public service quality stemming from prior negative experiences [17]. In such cases, even moderately functional systems can exceed expectations, resulting in positive Disconfirmation and increased satisfaction. As Serrano et al. [12] further note, the lower the initial expectations, the greater the likelihood of positive Disconfirmation where services are perceived as "better than expected." Conversely, higher expectations increase the risk of negative Disconfirmation when performance falls short of expectations. Therefore, managing and understanding users' effort expectancy is essential in shaping perceived Disconfirmation and ultimately satisfaction with public digital services.
H2: Effort Expectancy has a positive influence on Perceived Disconfirmation.
Van Ryzin [18] emphasizes that citizens evaluate public services not purely based on objective performance, but through the lens of their subjective expectations. In other words, people assess what they receive by comparing it to what they anticipated. This result explains why objective service quality often does not directly determine satisfaction levels because individuals interpret the same service conditions differently based on their expectations.
Zhang et al. [20] further assert that both perceived performance and prior expectations independently influence satisfaction. Expectations can have a direct positive effect on satisfaction, especially when users are either unaware of or unable to assess actual service performance. In such cases, individuals may adjust their satisfaction ratings to align with their expectations to reduce discomfort or maintain cognitive consistency [19].
Morgeson [17] adds that managing public expectations poses a significant challenge for government institutions. When expectations decline due to internal inefficiencies or external criticisms, these lowered expectations can erode satisfaction and are challenging to reverse. Although the direct effect of expectations on satisfaction is generally small, it remains statistically significant. This result suggests that expectations form part of the evaluative baseline against which satisfaction is judged [17, 24].
In line with this, they suggest that expectations directly shape how citizens perceive service quality and form satisfaction judgments. Ferreira et al. [25] also support this idea, noting that satisfaction tends to occur only after customers complete their decision-making process, at which point their expectations about service quality must be met to ensure loyalty.
Beyond these indirect mechanisms, EE or the perceived ease of using a system can also have a direct influence on Customer Satisfaction. A user-friendly system reduces the effort, time, and mental strain required, thereby contributing to a more positive service experience. Empirical studies in e-government, banking, and healthcare domains consistently affirm this direct relationship [15, 25]. When users find systems accessible and intuitive, they are more likely to report satisfaction, even independent of their prior expectations.
H3: Effort Expectancy has a positive influence on Customer Satisfaction.
The relationship between EE and Customer Satisfaction (CS) is often indirect and operates through the mediating role of Perceived Disconfirmation (PD). Users may not derive satisfaction merely from the ease of use itself, but from the unexpected ease compared to their initial expectations. This result aligns with the EDM, which posits that satisfaction arises when actual performance exceeds what was anticipated in a process referred to as positive disconfirmation [17, 24].
Perceived Disconfirmation has been shown to have a significant and positive influence on satisfaction, especially in the context of public services. Citizens who meet government services often carry preconceived expectations, and when these expectations are exceeded, their satisfaction tends to increase accordingly, supporting the core assumptions of EDM. However, in public sector contexts, Disconfirmation may not always be the dominant determinant of satisfaction. Notes that declining public trust often leads to lowered expectations, which, while potentially setting the stage for positive Disconfirmation, also creates a more challenging environment for sustaining satisfaction over time [17].
Furthermore, Van Ryzin [18] argues that while performance typically assessed through evaluations of service delivery does contribute to public satisfaction, it may not fully explain how citizens form their judgments. Instead, the gap between expectations and experience, particularly in terms of ease of use, plays a crucial role. Thus, both expectations and the disconfirmation process are central mechanisms in shaping citizen satisfaction, especially when evaluating the success of digital government services.
H4: Effort Expectancy has a positive effect on Customer Satisfaction mediated by Perceived Disconfirmation.
System Quality (SQ) refers to the evaluation of an information system's performance, with a particular focus on the interaction between users and the system. It can be measured by its functional attributes, primarily usability [23]. In the context of public digital services, SQ includes aspects such as reliability, ease of use, speed, and visual design, all of which contribute to the user's perception of system effectiveness [16].
Perceived Disconfirmation (PD), as described by Van Ryzin [18], refers to the gap between what users expect and what they experience in terms of service or product quality. It reflects whether the perceived performance meets, exceeds, or falls short of initial expectations. While expectations may have a minimal direct influence on perceived Disconfirmation, the relationship between perceived quality and Disconfirmation is often the strongest among the procedural effects of satisfaction [24]. The result suggests that users may not always confirm or disconfirm their expectations per se, but rather reassess the perceived quality based on their actual interaction with the system.
According to the EDM, when a system performs better than expected, such as being highly responsive, visually appealing, or easy to navigate, users experience positive Disconfirmation, which significantly contributes to their satisfaction [17, 24]. Empirical studies in digital platforms and public service systems affirm that systems delivering smooth, efficient, and reliable interactions lead to strong disconfirmation effects [12]. Thus, the literature provides firm theoretical and empirical grounding for the following hypothesis:
H5: System Quality has a positive influence on Perceived Disconfirmation.
Perceived system quality tends to have a more substantial indirect impact on satisfaction through Perceived Disconfirmation (PD) than a direct relationship. While perceived quality is indeed important in shaping satisfaction, its effect is amplified when mediated by users' evaluation of whether their expectations were met or exceeded [24]. In this sense, users may not immediately express satisfaction based on technical or functional system performance but rather through the recognition that the system outperformed their initial expectations.
Van Ryzin [18] emphasizes that a performance-based disconfirmation mechanism often shapes satisfaction with public services. That is, when users encounter a higher-than-expected level of quality, especially in government services where expectations tend to be modest, they are more likely to experience positive Disconfirmation, which in turn elevates their satisfaction. This shift underscores the significance of structural path coefficients in understanding how citizens form their overall assessments of satisfaction.
Empirical findings confirm that perceived quality has a greater effect on satisfaction indirectly through Disconfirmation rather than through a direct relationship [24]. This relationship has been observed across various digital service platforms, including government portals, mobile applications, and self-service technologies, where users' expectations have been consistently exceeded, resulting in increased satisfaction levels. Thus, the following hypothesis is proposed:
H6: System Quality has a positive effect on Customer Satisfaction mediated by Perceived Disconfirmation.
Researcher Van Ryzin [18, 19] argues that directly measuring citizens' expectations is essential for explaining satisfaction with public services. A key reason why objective service quality does not always align with satisfaction levels is that users interpret objective conditions through their subjective expectations, ultimately judging what they receive based on what they expected to receive. Similarly, Zhang et al. [20] emphasize that both perceived performance and expectations directly influence satisfaction. This direct effect of expectations may occur when users are either unaware of actual service performance or assimilate their satisfaction evaluations to prior expectations to reduce cognitive dissonance [19].
Morgeson [17] highlights the dilemma governments face in managing public expectations. Since expectations are shaped by internal and external factors beyond administrative control, declining expectations can negatively affect satisfaction in ways that are difficult to correct. Nonetheless, expectations have been found to have a positive and significant, albeit modest influence on satisfaction. Berryman [24] also predicts that expectations directly influence satisfaction because they form the evaluative baseline.
This result is supported by Ferreira et al. [25], who state that satisfaction emerges only after service encounters are complete, meaning that meeting expectations about service quality is crucial for ensuring continued loyalty.
System Quality, as a construct, is frequently viewed as a direct antecedent of Customer Satisfaction. High-performing digital systems that are stable, intuitive, and visually appealing reduce user effort and frustration, thereby improving service evaluations. Evidence from mobile banking, e-government, and other public service platforms confirms that reliable and user-friendly systems build user confidence and enhance satisfaction [20, 26].
H7: System Quality has a positive influence on Customer Satisfaction.
The EDM posits that the comparison between initial expectations and actual performance determines satisfaction. When performance surpasses expectations, referred to as positive Disconfirmation, it typically results in higher satisfaction. Conversely, when performance falls short, negative Disconfirmation leads to dissatisfaction. This relationship underscores the dual role of expectations and perceived performance in shaping Disconfirmation, and ultimately, satisfaction [19].
Importantly, research has shown that Disconfirmation serves as a more precise predictor of satisfaction when measured explicitly. Using question formats that ask respondents to rate outcomes on a scale from "much worse than expected" to "much better than expected" provides stronger explanatory power for satisfaction outcomes [18]. Furthermore, comparisons of subtractive and direct measures of Disconfirmation suggest that subtractive Disconfirmation based on the difference between expected and perceived performance has a more substantial effect on satisfaction formation [20].
This condition is particularly evident in public service contexts, where users may have low expectations due to prior inefficiencies. For example, travelers who anticipate complex or slow customs procedures but instead encounter efficient digital processes are more likely to report high levels of satisfaction, driven not only by the service itself but also by the unexpected improvement over their expectations. Thus, we propose the following hypothesis:
H8: Perceived Disconfirmation has a positive influence on Customer Satisfaction.
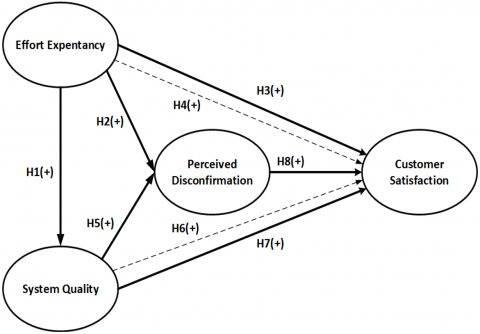
The hypothesized correlation of the constructs is depicted in Figure 1.
Figure 1. Research framework
This study aimed to evaluate the influence of key constructs from the EDM on the satisfaction of international passengers with the implementation of the ECD system at SHIA. Partial Least Squares Structural Equation Modeling (PLS-SEM) was employed to assess the relationships among latent variables and capture the underlying perceptions of ECD users.
The 19 indicators were adapted from validated instruments in prior EDM, technology acceptance, and digital service quality research. Items were selected to capture constructs such as effort expectancy [15], perceived system quality [23, 27], disconfirmation [18-20, 24], and satisfaction [18, 24, 26, 28], ensuring theoretical alignment with the EDM framework.
PLS-SEM was selected due to its suitability for complex models involving both direct and indirect effects, its robustness with non-normal data, and its predictive orientation [29]. While the model includes a moderate number of constructs, the inclusion of indirect paths, specifically mediation through perceived Disconfirmation, adds complexity. PLS-SEM is widely used in customer experience research, including studies on customer satisfaction, loyalty, and technology adoption [15, 30].
A purposive sampling technique was applied to ensure participants had direct experience with the ECD. Respondents were selected using purposive sampling based on the following criteria: (1) status as international passengers arriving at SHIA, (2) minimum age of 18 years to ensure legal consent and mature understanding of survey items, and (3) the ability to comprehend the survey language. This condition ensured that the sample was composed of individuals with direct, recent experience of the ECD system, making it suitable for evaluating satisfaction and expectations.
The sample size was determined using a common heuristic of five observations per indicator, resulting in a minimum of 95 participants for the 19 indicators. The final survey employed a 5-point Likert scale, chosen for its clarity and ease of interpretation.
A pilot test was conducted with 50 international passengers to evaluate the clarity, reliability, and construct validity of the questionnaire. Following this, quantitative data collection and analysis proceeded in three stages: descriptive statistics, measurement model evaluation (outer model), and structural model evaluation (inner model). For the measurement model, indicator reliability, convergent validity (as measured by Average Variance Extracted, AVE), and discriminant validity (as assessed by cross-loadings) were evaluated. Internal consistency was evaluated using Cronbach's alpha and composite reliability. For the structural model, the coefficient of determination (R²) was used to assess the variance explained in the endogenous constructs. Effect size (f²) was calculated to evaluate the relative impact of each exogenous variable. To test the significance of hypothesized relationships, bootstrapping (one-tailed test) was conducted with 5,000 resamples. Reported outputs include mean values, standard deviations, T-statistics, and p-values.
In addition, model fit was assessed using the Standardized Root Mean Square Residual (SRMR), in line with recent best practices in PLS-SEM reporting.
The total sample consisted of 207 respondents, all of whom were passengers arriving from abroad, submitting declarations using the ECD, and holding Indonesian citizenship. The research analyzes respondents' gender, age, latest educational background, frequency, and location of ECD, as shown in Table 1. The descriptive analysis of the survey sample reveals several key characteristics of the respondents. In terms of gender, the majority were male (56.04%), with females comprising 43.96% of the sample. Age-wise, most respondents fell into the younger adult categories, with 39.61% aged between 18 and 30 years and 38.16% in the 31-40 range. Only a small fraction was over the age of 50 (0.48%). Regarding educational background, over half of the participants (54.11%) held a DIV/bachelor's degree, followed by 34.78% with a senior high school qualification. A smaller portion had attained a master's degree (8.70%), while less than 2.5% had either junior high or doctoral education. Experience with the ECD system revealed that 88.52% of respondents were first-time users, indicating that most had limited familiarity with the platform. Only a small segment had completed the ECD multiple times. Additionally, the location where passengers filled out the ECD form was overwhelmingly concentrated at Soekarno-Hatta International Airport (89.86%), with very few completing it at their origin (6.76%) or at transit airports (3.38%).
Table 1. Respondent’s characteristic
|
Desc. |
Criteria |
Frequency (n = 207) |
Percentage (%) |
|
Gender |
Male |
116 |
56.04% |
|
Female |
91 |
43.96% |
|
|
Age |
18-30 |
82 |
39.61% |
|
31-40 |
79 |
38.16% |
|
|
41-50 |
45 |
21.74% |
|
|
> 50 |
1 |
0.48% |
|
|
Education |
Junior High School |
3 |
1.45% |
|
Senior High School |
72 |
34.78% |
|
|
DIV/Bachelor |
112 |
54.11% |
|
|
Master’s degree |
18 |
8.70% |
|
|
Doctoral Degree |
2 |
0.97% |
|
|
Frequency of ECD filling when traveling from abroad |
First time |
184 |
88.52% |
|
2-3 times |
16 |
8.13% |
|
|
4-8 times |
3 |
1.44% |
|
|
> 8 times |
4 |
1.91% |
|
|
Location of ECD filling |
Origin Airport |
14 |
6.76% |
|
Transit Airport |
7 |
3.38% |
|
|
SHIA Airport |
186 |
89.86% |
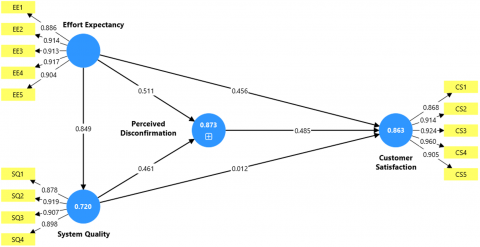
Prior to testing the proposed hypotheses, a two-step approach was employed, following the guidelines of PLS-SEM. The measurement model analysis is followed by structural model analysis. Measurement model analysis results (Figure 2) are a crucial aspect of research in various fields, as they provide a framework for assessing the reliability and validity of the constructs and indicators used in a study. The analysis results indicate that the model exhibits good convergent validity, internal consistency, reliability, and discriminant validity. The measurement model is important because it provides a framework for assessing the reliability and validity of the constructs in the study. It examines the relationships between the latent variables and their respective indicators. The results indicate that the model exhibits good convergent validity, internal consistency, reliability, and discriminant validity, as shown in Table 2. All the latent variable indicators have a factor loading above 0.7, with the construct's Average Variance Extracted above 0.5. The Cronbach's alpha and composite reliability, which represent internal consistency and reliability, respectively, also have values above 0.7. The discriminant validity, as measured by the HTMT, reported that the variables' confidence interval does not include one.
Figure 2. Measurement model analysis result
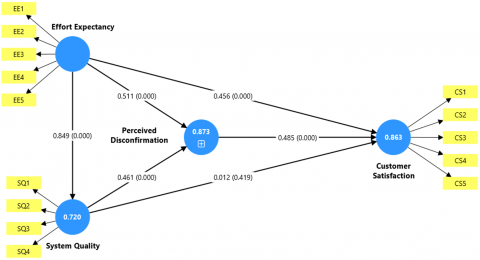
The structural model analysis (Figure 3) is vital in understanding the relationship between the latent variables in the conceptual framework. It evaluated the coefficient of determination (R²), calculated the effect size (f²), and assessed the path coefficient. In evaluating the coefficient of determination, the R² value was used to measure the exogenous effects on the endogenous variable [31]. Following Cohen [32], f² values were interpreted as small (≥ 0.02), medium (≥ 0.15), or large (≥ 0.35).
Figure 3. Structural model analysis result
Table 2. Measurement model analysis result
|
LV/IND |
CV |
ICR |
DV |
||
|
LF |
AVE |
CA |
CR |
HTMT |
|
|
Customer Satisfaction (CS) |
|||||
|
CS1 |
0.868 |
0.837 |
0.951 |
0.962 |
Yes |
|
CS2 |
0.914 |
||||
|
CS3 |
0.924 |
||||
|
CS4 |
0.96 |
||||
|
CS5 |
0.905 |
||||
|
Effort Expectancy (EE) |
|||||
|
EE1 |
0.886 |
0.822 |
0.946 |
0.958 |
Yes |
|
EE2 |
0.914 |
||||
|
EE3 |
0.913 |
||||
|
EE4 |
0.917 |
||||
|
EE5 |
0.904 |
||||
|
Perceived Disconfirmation (PD) |
|||||
|
PD1 |
0.874 |
0.812 |
0.923 |
0.945 |
Yes |
|
PD2 |
0.895 |
||||
|
PD3 |
0.914 |
||||
|
PD4 |
0.92 |
||||
|
System Quality (SQ) |
|||||
|
SQ1 |
0.878 |
0.811 |
0.923 |
0.945 |
Yes |
|
SQ2 |
0.919 |
||||
|
SQ3 |
0.907 |
||||
|
SQ4 |
0.898 |
||||
The coefficient of determination (R²), as depicted in Table 3, shows that effort expectancy (EE), system quality (SQ), and perceived disconfirmation (PD) collectively explain 86.3% of customer satisfaction (CS). These variables can justify PD by 87.3%, while EE explains SQ by 72%. The study analyzed the effect size to determine the exogenous effect on endogenous variables through the resulting f2 value, as depicted in Table 4.
EE and PD have a moderate level of effect on customer satisfaction (CS), with f2 values of 0.269 and 0.218, respectively, indicating a medium effect. Meanwhile, system quality (SQ) has a subdued level of influence on the CS, with an f2 value of 0.002 (indicating a small effect). EE and SQ have a moderate level of influence on PD with an f2 value of 0.575 and 0.467 (significant effect), respectively. SQ influenced EE with an f2 value of 2.571, which also represents a significant effect according to Cohen's criteria. Subsequently, the bootstrap procedure was completed to test the path coefficient and measure the effect of exogenous variables on endogenous variables by evaluating the compiled hypothesis. Mediation testing was conducted by examining the influence of outcomes on variables. This research employs a critical t-value of 1.96 for a 5% significance level and a p-value smaller than 0.05 [31], as shown in Table 5. The SRMR estimated model has a value of 0.054, indicating that it is considered a good fit, with a threshold below 0.08 [33].
Based on the data, every external factor has a positive impact on the respective internal factors. Among the external factors, EE has the most decisive influence on SQ, with a path coefficient value of 0.849. In comparison, the correlation of SQ and CS is the weakest, with a path coefficient value of 0.012. Although some variables do not meet the relationship criteria of a t-value above 1.65 or a p-value of 0.05 or less, the measurement results suggest that the compiled variable relationships are significant, except for the relationship between SQ and CS. Based on the measurement model analysis, all hypotheses are accepted, except H7, which is rejected, as depicted in Table 6.
Table 3. Coefficient of determination (R2) measurement
|
No. |
Variable |
R2 |
|
1 |
Customer Satisfaction (CS) |
0.863 |
|
2 |
Perceived Disconfirmation (PD) |
0.873 |
|
3 |
System Quality (SQ) |
0.720 |
Table 4. Effect size (f2) measurement
|
Variable |
CS |
PD |
SQ |
|
EE |
0.269 |
0.575 |
2.571 |
|
PD |
0.218 |
|
|
|
SQ |
0.002 |
0.467 |
|
Table 5. Path coefficient and measurement analysis
|
Path |
Path Coefficients |
T statistics (|O/STDEV|) |
P Values |
|
EE->CS |
0.456 |
5.976 |
0.000 |
|
EE->PD |
0.511 |
10.607 |
0.000 |
|
EE->SQ |
0.849 |
46.341 |
0.000 |
|
PD->CS |
0.485 |
5.696 |
0.000 |
|
SQ->CS |
0.012 |
0.204 |
0.838 |
|
SQ->PD |
0.461 |
8.667 |
0.000 |
|
EE->PD->CS |
0.248 |
5.512 |
0.000 |
|
SQ->PD->CS |
0.224 |
4.363 |
0.000 |
Table 6. Hypothesis test result
|
|
Hypothesis |
Result |
|
H1 |
Effort expectancy has a positive influence on system quality |
Accepted |
|
H2 |
Effort expectancy has a positive influence on perceived Disconfirmation |
Accepted |
|
H3 |
Effort expectancy has a positive influence on customer satisfaction |
Accepted |
|
H4 |
Effort expectancy has a positive effect on customer satisfaction, which perceived disconfirmation mediates. |
Accepted |
|
H5 |
System quality has a positive influence on perceived Disconfirmation |
Accepted |
|
H6 |
System quality has a positive effect on customer satisfaction mediated by perceived Disconfirmation. |
Accepted |
|
H7 |
System quality has a positive influence on Customer satisfaction |
Rejected |
|
H8 |
Perceived Disconfirmation has a positive influence on customer satisfaction. |
Accepted |
This study provides empirical evidence on the role of EE in shaping both SQ and CS, with PD serving as a critical mediating construct within the EDM framework. The findings offer several insights into how users evaluate the ECD system at SHIA.
The analysis indicates that EE significantly and positively influences SQ, suggesting that users assess system quality not only through technical dimensions (e.g., functionality, reliability) but also through perceived ease of use. The study on healthtech application usage showed that EE had a significant effect on user satisfaction, which is a key determinant of system quality [34]. Similarly, in the study of online learning technology, EE was shown to correlate with System Quality, suggesting that systems perceived as easier to use are also seen as higher quality [35].
In the context of SHIA's ECD system used by a diverse traveler demographic, ease of use becomes central. Many users, particularly first-timers unfamiliar with digital customs processes, interpret a system's quality through its usability. This result is consistent with findings in mobile banking and e-service platforms where ease of navigation and clarity strongly affect perceptions of overall system value [4, 5]. Even minor usability barriers in this setting can significantly downgrade quality perceptions, especially when compared to the simpler, conventional paper-based declaration forms.
EE also demonstrates a significant positive influence on PD, indicating that ease of use not only contributes to functional satisfaction but also shapes the degree to which a system exceeds or falls short of user expectations. For many international travelers, the default expectation may be a cumbersome and bureaucratic process. A system that feels intuitive and efficient, like the ECD, can thus create a positive disconfirmation effect.
This result is reinforced by the fact that many respondents were using the ECD for the first time, as reflected in the descriptive statistics. Their favorable impressions were likely amplified due to low prior expectations, a phenomenon supported by Morgeson [17], who argued that Disconfirmation plays a pivotal role in shaping satisfaction in public service settings.
The findings confirm both a direct and a mediated relationship between EE and CS through PD. Users who found the ECD system easy to use reported higher satisfaction, regardless of whether they consciously compared it to their prior expectations. This dual-path influence reflects earlier work on digital self-service technologies and banking platforms, where usability directly contributed to satisfaction, while also elevating expectations through performance-based surprises [36, 37].
In the SHIA context, passengers appreciated being able to complete their declarations quickly and independently, which contributed to their satisfaction both functionally and emotionally. The results reaffirm that ease of use is both an enabler and amplifier of satisfaction in public digital services.
System Quality also positively and significantly affects Perceived Disconfirmation, confirming that high-quality systems are more likely to exceed expectations. Attributes such as visual appeal, smooth process flow, and absence of errors play a role in reinforcing positive reassessment of expectations. The result supports Berryman's [24] assertion that in public-sector digitization, improving system quality can substantially shift user perceptions, particularly when prior experiences were inefficient or outdated.
Moreover, this finding highlights the importance of ongoing system refinement. While technical issues were initially reported during ECD implementation, subsequent improvements helped recalibrate user expectations, resulting in more favorable disconfirmation outcomes.
Interestingly, the direct effect of System Quality on Customer Satisfaction was not significant, which diverges from some earlier findings [20, 23] but aligns with others that emphasize the indirect nature of quality effects in public services, particularly in terms of perceived value [38, 39]. One explanation is that users may lack the technical expertise to evaluate the quality of digital systems independently. Their satisfaction is therefore derived more from perceived outcomes, such as speed, clarity, and convenience, than from the system design or functionality itself.
The result reinforces the idea that users are less concerned with what the system does and more with how it makes them feel, particularly when it simplifies previously complex or manual procedures. Similar patterns have been observed in studies on digital payments and public information systems, where satisfaction was found to be mediated by experiential factors rather than directly by system quality.
This study examined the impact of effort expectancy and system quality on perceived Disconfirmation and customer satisfaction within the context of Indonesia's ECD system. Findings indicate that effort expectancy significantly influences both perceived Disconfirmation and satisfaction, while system quality indirectly affects satisfaction only through Disconfirmation. These results reinforce the critical role of user-perceived ease of use in digital service adoption, especially when expectations are exceeded.
Notably, system quality—despite its technical importance—was not a direct driver of satisfaction. The result suggests that passengers at Soekarno-Hatta International Airport prioritize usability over backend performance. When passengers encounter friction in navigating the system, it diminishes satisfaction, regardless of the ECD system's sophistication. Thus, effort expectancy emerged as both a cognitive and emotional precursor to satisfaction, mediated by the degree to which expectations were positively disconfirmed.
6.1 Policy and managerial implications
To enhance public satisfaction with digital customs systems, Customs authorities should implement pre-arrival tutorials, multilingual support, and human assistance counters for digital troubleshooting. Airport operators should ensure stable internet access and sufficient kiosk infrastructure to reduce technical complaints. System developers should prioritize intuitive interfaces, regular user testing, and responsive design to accommodate passengers with varying levels of digital literacy. These actionable measures are expected to minimize the usability gap and improve the alignment between user expectations and system performance.
6.2 Limitations and future research
This study's primary limitation is its single-site design, which focuses solely on SHIA and is limited to Indonesian passengers. While this sample reflects the most significant international hub in the country, it may not capture the heterogeneity of user experiences across other Indonesian airports or among foreign passengers. Future studies should extend this research to multiple airports and diverse traveler demographics to increase generalizability.
Furthermore, while this study controlled key structural relationships, it did not account for common method bias or potential measurement error inherent in self-reported data. Future research should consider incorporating objective performance metrics or experimental designs to enhance the accuracy of the findings. Expanding the theoretical scope by integrating constructs such as trust, perceived risk, or loyalty could also deepen the understanding of satisfaction in digital public service contexts.
In summary, this research offers both theoretical and practical insights into the digitalization of public services, demonstrating that managing expectations and simplifying user interaction are crucial levers for enhancing satisfaction with government technologies, such as the ECD.
This work is supported by Universitas Multimedia Nusantara (UMN) through the provision of resources, facilities, and an academic environment essential for the completion of this study.
[1] Adams, N.P.H., Chisnall, R.J., Pickering, C., Schauer, S. (2020). How port security has to evolve to address the cyber-physical security threat: Lessons from the SAURON project. International Journal of Transport Development and Integration, 4(1): 29-41. https://doi.org/10.2495/TDI-V4-N1-29-41
[2] Tahanisaz, S. (2020). Evaluation of passenger satisfaction with service quality: A consecutive method applied to the airline industry. Journal of Air Transport Management, 83: 101764. https://doi.org/10.1016/j.jairtraman.2020.101764
[3] Sun, X., Zheng, C., Wandelt, S., Zhang, A. (2024). Airline competition: A comprehensive review of recent research. Journal of the Air Transport Research Society, 2: 100013. https://doi.org/10.1016/j.jatrs.2024.100013
[4] Batouei, A., Iranmanesh, M., Mustafa, H., Nikbin, D., Ping, T.A. (2020). Components of airport experience and their roles in eliciting passengers' satisfaction and behavioural intentions. Research in Transportation Business & Management, 37: 100585. https://doi.org/10.1016/j.rtbm.2020.100585
[5] Utomo, P., Cham, T.H., Pek, C.K., Mamatkulov, S. (2023). Deep dive into the augmented reality customer experience and adoption research: A bibliometric study. In Current and Future Trends on Intelligent Technology Adoption. Cham: Springer Nature Switzerland, pp. 413-433. https://doi.org/10.1007/978-3-031-48397-4_21
[6] Abdullahi, H.O., Mohamud, I.H., Ali, A.F., Hassan, A.A., Kafi, A. (2024). The transformative impact of information and communication technology on transportation services: A systematic literature review. International Journal of Transport Development and Integration, 8(3): 455-460. https://doi.org/10.18280/ijtdi.080309
[7] Cakoci, K. (2018). New challenges and perspectives in customs law. In Optimization of Organization and Legal Solutions concerning Public Revenues and Expenditures in Public Interest (Conference Proceedings). Temida 2, pp. 615-630. https://doi.org/10.15290/oolscprepi.2018.45
[8] Wardhana, H. (2022). Optimalkan pelayanan, bea cukai berlakukan electronic customs declaration nasional. https://www.beacukai.go.id/berita/optimalkan-pelayanan-bea-cukai-berlakukan-electronic-customs-declaration-nasional.html.
[9] Ramadhan, M.R., Lesmini, L., Harahap, V.N. (2020). Document digitization and quality of service effect to customer’s satisfaction in Soekarno Hatta International Airport. Advances in Transportation and Logistics Research, 3: 321-328. https://doi.org/10.25292/atlr.v3i0.285
[10] Baek, S.K., Nam, S.H., Chang, B.H. (2017). Feedback effect of brand extension in cable networks established by parent newspaper brands: Applying expectation disconfirmation theory. Journal of Media Economics, 30(4): 173-190. https://doi.org/10.1080/08997764.2018.1515766
[11] Hong, Y., Zhao, J., Zhang, Y., Su, Q. (2023). Motivating public health emergency preparedness cooperative behaviors: based on the expectancy disconfirmation model. Journal of Health Organization and Management, 37(6/7): 465-482. https://doi.org/10.1108/JHOM-09-2022-0268
[12] Serrano, C.I., Shah, V., Abràmoff, M.D. (2018). Use of expectation disconfirmation theory to test patient satisfaction with asynchronous telemedicine for diabetic retinopathy detection. International Journal of Telemedicine and Applications, 2018(1): 7015272. https://doi.org/10.1155/2018/7015272
[13] Gurkan, G.C., Özyurt, B., Aylan, K.C. (2025). Evaluation of vegan and vegetarian customers’ reviews within the scope of expectancy-disconfirmation model. Enlightening Tourism. A Pathmaking Journal, 15(1): 1-25. https://doi.org/10.33776/et.v15i1.8252
[14] Chen, W., Dong, B., Hsieh, C.W., Lee, M.J., Liu, N., Walker, R.M., Wang, Y., Wen, B., Wen, W., Wu, P., Wu, X., Zhang, J. (2022). A replication of “an experimental test of the expectancy‐disconfirmation theory of citizen satisfaction”. Public Administration, 100(3): 778-791. https://doi.org/10.1111/padm.12860
[15] Venkatesh, V., Morris, M.G., Davis, G.B., Davis, F.D. (2003). User acceptance of information technology: Toward a unified view. MIS Quarterly, 27(3): 425-478. https://doi.org/10.2307/30036540
[16] DeLone, W.H., McLean, E.R. (2003). The DeLone and McLean model of information systems success: A ten-year update. Journal of Management Information Systems, 19(4): 9-30. https://doi.org/10.1080/07421222.2003.11045748
[17] Morgeson, F.V. (2012). Expectations, Disconfirmation, and citizen satisfaction with the US federal government: Testing and expanding the model. Journal of Public Administration Research and Theory, 23(2): 289-305. https://doi.org/10.1093/jopart/mus012
[18] Van Ryzin, G.G. (2004). Expectations, performance, and citizen satisfaction with urban services. Journal of Policy Analysis and Management, 23(3): 433-448. https://doi.org/10.1002/pam.20020
[19] Van Ryzin, G.G. (2006). Testing the expectancy disconfirmation model of citizen satisfaction with local government. Journal of Public Administration Research and Theory, 16(4): 599-611. https://doi.org/10.1093/jopart/mui058
[20] Zhang, J., Chen, W., Petrovsky, N., Walker, R.M. (2022). The expectancy‐disconfirmation model and citizen satisfaction with public services: A meta‐analysis and an agenda for best practice. Public Administration Review, 82(1): 147-159. https://doi.org/10.1111/puar.13368
[21] Gupta, K.P., Bhaskar, P., Singh, S. (2016). Critical factors influencing e-government adoption in India: An investigation of the citizens' perspectives. Journal of Information Technology Research (JITR), 9(4): 28-44. https://doi.org/10.4018/JITR.2016100103
[22] Yuhefizar, Y., Utami, D., Sudiman, J. (2024). The E-govqual and importance performance analysis (IPA) models analysis: Review a web service quality of E-government. JOIV: International Journal on Informatics Visualization, 8(2): 777-783. https://doi.org/10.62527/joiv.8.2.1196
[23] Aditi, B., Hafizah, H., Hermansyur, H. (2021). The role of e-services, quality system and perceived value on customer satisfaction: An empirical study on Indonesian SMEs. Journal of Industrial Engineering & Management Research, 2(3): 193-205. https://doi.org/10.7777/jiemar.v2i2
[24] Berryman, A. (2015). Modeling public satisfaction with school quality: A test of the American Customer Satisfaction Index model. Dissertation, George State University.
[25] Ferreira, S., Batista, P., Sánchez-Sáez, J.A., Sánchez-Sánchez, J., Carvalho, M.J. (2023). Road racing event management satisfaction: A scoping review of the literature in different populations. Sustainability, 15(3): 2251. https://doi.org/10.3390/su15032251
[26] Annamdevula, S., Bellamkonda, R.S. (2016). The effects of service quality on student loyalty: The mediating role of student satisfaction. Journal of Modelling in Management, 11(2): 446-462. https://doi.org/10.1108/JM2-04-2014-0031
[27] Pham, L., Limbu, Y.B., Bui, T.K., Nguyen, H.T., Pham, H.T. (2019). Does e-learning service quality influence e-learning student satisfaction and loyalty? Evidence from Vietnam. International Journal of Educational Technology in Higher Education, 16(1): 1-26. https://doi.org/10.1186/s41239-019-0136-3
[28] Nugroho, M.A., Setyorini, D., Novitasari, B.T., Nugroho, M.A., Setyorini, D., Novitasari, B.T. (2019). The role of satisfaction on perceived value and e-learning usage continuity relationship. Procedia Computer Science, 161: 82-89. https://doi.org/10.1016/j.procs.2019.11.102
[29] Utomo, P., Kurniasari, F. (2022). The dynamic capability and ambidexterity in the early-stage startups: A hierarchical component model approach. In Eurasia Business and Economics Society Conference. Cham: Springer Nature Switzerland, pp. 49-61. https://doi.org/10.1007/978-3-031-36286-6_3
[30] Sudiyono, K.A., Utomo, P., Severesia, C. (2022). Effect of customer experience and customer value towards customer loyalty and satisfaction on B2B food and beverage sector. Journal of Business and Management Review, 3(9): 627-640. https://doi.org/10.47153/jbmr39.4552022
[31] Hair, J.F., Hult, G.T.M., Ringle, C.M., Sarstedt, M. (2021). A Primer on Partial Least Squares Structural Equation Modeling (PLS-SEM). SAGE Publication, Inc.
[32] Cohen, J. (1988). Statistical Power Analysis for the Behavioral Sciences. L. Erlbaum Associates.
[33] Hu, L.T., Bentler, P.M. (1998). Fit indices in covariance structure modeling: Sensitivity to underparameterized model misspecification. Psychological Methods, 3(4): 424-453. https://doi.org/10.1037/1082-989X.3.4.424
[34] Chow, B., Legowo, N. (2023). Factors influencing user satisfaction of Pedulilindungi app with UTAUT & Delone Mclean models: A case study in Indonesia. Journal of System and Management Sciences, 13(2): 170-184. https://doi.org/10.33168/JSMS.2023.0212
[35] Prasetya, F.H., Widiantoro, A.D., Harnadi, B. (2023). Effects of quality factor and satisfaction on the acceptance of online learning (Adoption learning technology). In 2023 7th International Conference on Information Technology (InCIT), Chiang Rai, Thailand, pp. 98-103. https://doi.org/10.1109/InCIT60207.2023.10412893
[36] Ingale, K., Paliwal, M., Jha, S., Masarrat, G., Kodlekere, S., Shedge, S. (2024). Delighting customers: Evaluating service quality and customer satisfaction of self-checkout users in sports retail. Innovative Marketing, 20(3): 97-109. https://doi.org/10.21511/im.20(3).2024.08
[37] Ur Rashid, M.H., Hossain, M.A., Ahmad, A., Ahmed, Z. (2021). Customers’ intention in internet banking adoption: The moderating effect of demographic characteristics. International Journal of Innovation and Technology Management, 18(7): 2150036. https://doi.org/10.1142/S021987702150036X
[38] Lee, H.S. (2013). Major moderators influencing the relationships of service quality, customer satisfaction and customer loyalty. Asian Social Science, 9(2): 1-11. https://doi.org/10.5539/ass.v9n2p1
[39] Kuo, N.T., Chang, K.C., Cheng, Y.S., Lai, C.H. (2013). How service quality affects customer loyalty in the travel agency: The effects of customer satisfaction, service recovery, and perceived value. Asia Pacific Journal of Tourism Research, 18(7): 803-822. https://doi.org/10.1080/10941665.2012.708352