Hussein Jasim Hussein Almansori*![]() | Abdulkareem Naji Abbood Al-Karimi
| Abdulkareem Naji Abbood Al-Karimi![]() | Laith Shaker Ashoor Al-Zubaidi
| Laith Shaker Ashoor Al-Zubaidi![]() | Alaa Hussein Ali Alobaidi
| Alaa Hussein Ali Alobaidi![]()
© 2024 The authors. This article is published by IIETA and is licensed under the CC BY 4.0 license (http://creativecommons.org/licenses/by/4.0/).
OPEN ACCESS
Pedestrians are one of the essential parts of the transportation system. In order to encourage walking and reduce the use of personal vehicles, pedestrian’s facilities need to be provided in the campus since they are facing many problems. Pedestrian’s level of service (LOS) is the common approach to estimate the quality of pedestrian facilities. The highway capacity manual (HCM) defines six Pedestrians (LOS) namely LOS A, B, C, D, E and F, where A shows high Levels of comfort and capacity, while F represents a poor level of comfort and capacity. Reconnaissance and Field survey measurement was done to collect and study the pedestrians and sidewalks characteristic by using video camera and Measuring tape. Walking speed also was studied to find the speed at which pedestrians appear in term of (15th, 50th, 85th, 98th) percentile speed. The study showed that LOS for study areas ranges between (B) to (E) also it was observed that pedestrians used the roadway in moving which indicate the inefficiency of sidewalk capacity. As the accident in front of university gates increased during crossing, the study suggested (4) alternatives facilities for pedestrians crossing which are: stairways, escalator, ramps and underpasses.
crossing, campus, highway capacity manual, level of service, pedestrians, roadway, sidewalk, walking speed
Walking is considered one of the basic means of transportation and sometimes the only way to reach various destinations. However, it requires the availability of safe routes, as well as the availability of efficient sidewalks suitable for pedestrian movement. Rapid growth showed increasing in population, also increasing in the level of car ownership for different types such as heavy vehicles, passenger cars and busses. Due to increasing in pedestrian congestion and delays, many interference situations and conflict points happens between pedestrians’ movement with other traffic movements on streets and make those streets more difficult for pedestrians to cross. This problem is also can be seen at university campuses [1, 2].
In addition to inefficiency of pedestrian’s sidewalk capacity in term of moving and crossing especially in the morning and evening peak hour (a.m. & p.m.), which make the pedestrians walk in the roadway and expose them to vehicle-pedestrian accident due to the increase in the number of students, teachers and staff at the university [3]. Lack of an efficient transport system for traffic movement in general and pedestrians in particular inside the campus which links the sidewalks and available routes for movement which are suitable for buildings, classrooms, research and service centers that allow the pedestrians to reach their destinations effectively and appropriately [4]. In addition to absence of road furnishing with the necessary traffic signals and signs at the campus, which would allow the suitable time and space to travel through the facilities the university [5].
There has been an interest in the sidewalks and its improvement in order to raise the level of service for movement and crossing of pedestrians inside the campus [6].
Most of the developments that have taken place are directed towards the improvement of the vehicular network but little has been done for the pedestrians especially inside the university campus. This study tries to determine the efficiency and capacity of pedestrian sidewalks using the concept of level of service (LOS). Also focusing on the pedestrian’s speed which consider the most important factor in pedestrian movement because it is related to safety, time, comfort and convenience [7, 8].
The university campus is an important part of the surrounding urban areas and the traffic problem of the city is almost similar to the traffic problems on campus. The good university is an example of a beautiful city [9].
1.1 Literature review
Sarsam and Abdulameer [10] dealt with evaluating pedestrians walking speed and the importance of planning pedestrian facilities to enhance their movement between the facilities designated for them, based on estimating the individual characteristics of pedestrians, including age, gender, and their style of clothing. The results showed that the walking speed of males increases by about 5% of the speed of females with average walking speed of 1.96 (ft/sec.), and it was also shown that age has an effect on the speed of walking, as the elderly shows less movement compared to young people. As for the style of clothing, the study explained that peoples wearing Arabic dress limits their movement compared to casual dress [10].
Hamad et al. [11] tried to understand the pedestrian’s characteristic within the university campus in how they move, whether using vehicles or walking to reach their intended places, the distance and time it takes to reach the destination, as these details help in understanding the problems of transportation to and from the university campus. A comprehensive questionnaire was conducted to collect information for all types of workers, including teachers, students, staff and visitors. The results revealed a number of solutions by trying to provide a comfortable sidewalk for pedestrian movement with planting trees alongside these sidewalks to create a suitable environmental atmosphere and make an attempt to connect these paths with the university’s facilities, in addition to providing public transit to and from the university to reduce the use of personal vehicles, traffic volume and congestion in parking lots. In addition, there are some long-term solutions in trying to increase the capacity of parking lots by creating multi-story parking lots and providing special transit stations for university transportation in the cities [11].
Al-Mukaram and Musa [12] evaluated the walking characteristics of pedestrians on sidewalks as well as the basic flow-velocity-density relationships were studied and analyzed. A video recording method was applied to observe pedestrian characteristics at four survey sites. This data was used to develop mathematical models that determine the nature of the relationship between these variables also the high way capacity method (HCM) was adopted to analyze the study area in details. The results showed that there is an inverse relationship between density and speed of pedestrians, as the density increases, the speed decreases because density works to reduce pedestrian movement. The results also showed that the reason for high density is a lack of clear areas for pedestrian’s sidewalk. After determining walking speed and clear spaces of the sidewalk, they are compared with the standard specification (HCM) to determine the level of service [12].
Dakhil et al. [13] discussed the main problem addressed by this study is the randomness and uncontrolled crossing of pedestrians. so, the study tried to analyze and find the necessary solutions that would reduce or limit the interference of the various traffic activities with pedestrians crossing. Field data on road traffic volume in all study areas were collected using video camera during peak hour volume. The study chose four areas to study pedestrian’s characteristic, which are residential, commercial, and educational areas, as they represent the diversity of land uses, according to the basic design plan. The study attempted to show the condition of the sidewalk. The study also used the questionnaire method (interview survey) to show the suitability of pedestrian bridges for crossing and ground crossing. The study concluded that the study areas have high traffic volumes for pedestrians, as well as lack of traffic Suitability of the sidewalk in terms of their capacity, quality, and the encroachments on them. The crossing is random and unorganized, and the most dangerous thing about this crossing is the sudden crossing which lead to (vehicle/pedestrian) accident. The study area was devoid of providing safe havens for the pedestrians through planning or placing warning signs that provide the pedestrians with the right to cross [13].
Taha and Ali [14] investigated the campus of the University of Mosul. The study also dealt with the geographical location of the university campus and the traffic congestion occurring in front of the campus gates including vehicles traffic and movement of passengers to and from the bus. One of the most important objectives of the study is to try to understand the random congestion that occurs, especially during the morning and evening peak hours, in front of the campus gates and its effect on pedestrians and other moving vehicles on the main roadway. Data was collected through a questionnaire, gathering information, taking measurements of the study area and using video recording techniques to find a suitable solution using HCM method to find the level of service. The study concluded that sidewalks must be provided near the campus gates to facilitate pedestrian movement and increase safety during entry and exit. In addition, the study recommended furnishing the roads with bumps and signs, especially pedestrian crossing areas to reduce the speed of vehicles and thus prevent accidents [14].
Kushchenko et al. [15] analyzed traffic accidents. As a result of the development of the road network, the increase in the number of car owners, and non-compliance with traffic rules, the rate of accidents involving pedestrians when crossing has increased. The aim of the study was trying to understand the methods and measures necessary to improve traffic safety by collecting survey data about sidewalks used in the study areas. Most of the sidewalks are not furnished with lighting or traffic signs. After reviewing the results of the survey, one of the most important causes of accidents was irregular crossing. In addition, some pedestrians do not pay attention when crossing and this increases the possibility of accidents. The study recommended avoiding the use of random crossings, one must estimate the distance and speed of incoming cars and ensure that the crossing is safe. The study also indicated the necessity of establishing ground and elevated bridges for pedestrians and pay attention to the signals and traffic rules of the roadway [15].
1.2 Study problem
The difficulties and problems in this study will be summarized as follow:
• Lack of pedestrians sidewalk capacity in term of crossing and movement, especially in the morning and evening peak hour (a.m. & p.m.), which make the pedestrians walking in the roadway and expose them to vehicle-pedestrian accident.
• Lack of an efficient transport system for traffic movement in general and pedestrians in particular at the campus which links the sidewalks and available routes for movement which are suitable for buildings, classrooms, research and service centers that allow the pedestrians to reach their destinations effectively and appropriately.
• Lack of road furnishing with the necessary traffic signals and signs at the campus, which would allow the suitable time and space to travel through the facilities and faculties of the university.
• There are many pedestrians’ traffic accidents at the university gates due to the lack of a safe transit system reach the other side of the main road (Hilla-Najaf), which led to random crossing and lack of factors of safety, efficiency and convenience.
1.3 Importance of the study
The aim of this present study is to investigate about the current situation of pedestrian traffic volumes during peak hours and working to improve the efficiency and capacity of sidewalk using the concept of level of service (LOS). In addition to studying and evaluating pedestrian speed through the conclusion of a statistical model. Speed percentiles are tools used to determine effective and adequate speed limits. This study focused on evaluating pedestrian movement based on the most important characteristic of pedestrians, which is speed, as it is considered one of the most important factors that help determine the efficiency of pedestrian facilities within the university specifically in terms of percentile speed, which is considered one of the basic specifications for determining speed for each percentage of pedestrians and giving a comprehensive idea of speed. Is it within the limits or close to the upper or lower limit. (98th percentile speed) represent the highest speed of the pedestrian, (85th percentile speed) at which 85% of the pedestrian walking at this rate, (50th percentile speed) which represent the median speed and (15th percentile speed) that used for providing typical walking speed for slower group, these types of speed would help to know the efficiency of pedestrian’s sidewalks. It is also important to determine the service provided by the sidewalk through studying the sidewalk width, distance, type of obstacle that help determining the effective sidewalk width (WE) for each study area on the campus. Finally, try to create an efficient and effective transit system for crossing and moving in front of the university gates by providing safe refuge, as well as proposing appropriate solutions to make the crossing more secured.
2.1 Definition of study area
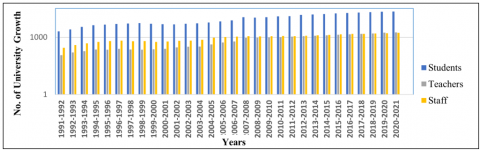
The campus is located in the southern part of Hilla and its located (10) km from the center of the city, surrounded by many agricultural lands and is followed by the Hilla-Najaf highway on the eastern side. The University of Babylon was established in (1991) with three faculties, with (116) teachers and (278) staff, while the number of students was (2047). Due to the expansion and rapid growth of the university in all its faculties, research and consulting centers, campus members have significantly increased through the years as shown in Figure 1.
From Figure 1, the progress of the university at all levels shows how well the university meets the standards and requirements that are compatible with the needs of the community and its goals. It gives us a scientific and statistical index that provides data in estimating the need to design safe and efficient sidewalks.
Figure 1. University of Babylon growth population [16]
2.2 Data collection
The study area was divided into three main zones in order to study the pedestrian’s characteristics and effective sidewalks width as shown in Table 1.
Table 1. Names of the selected study area
|
Zone No. |
Zone Name |
Effective Sidewalk Width (WE) (ft.) |
|
(1) |
University Leadership Sidewalk. College of Low Sidewalk. |
6.9 6.2 |
|
(2) |
Department of Civil Engineering Sidewalk. Student’s Entry Gates Sidewalk. |
3.3 6.6 |
|
(3) |
College of Agriculture Sidewalk. College of Science Sidewalk. |
8.5 9.8 |
The study areas were selected as they are vital areas and links between other campus facilities and also considered the most congested area with pedestrians and vehicles traffic. The evaluation and analysis process of pedestrian characteristics and the sidewalks depends on the collection of data from the site because they provide appropriate scientific and statistical analysis to evaluate those characteristics, which providing a database to let decision makers take the necessary steps required in the development and improvement as well as to find appropriate solutions to reduce traffic problems in general and the problems of pedestrians inside and outside the campus in particular. The process of data collection was done through the following stages:
1. Reconnaissance Study: All sectors in the study area were indicated in the university master plan to understand the characteristics of pedestrians that identify and estimate the morning and evening peak hour (a.m. & p.m.).
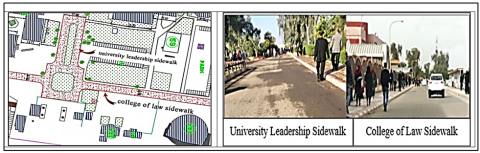
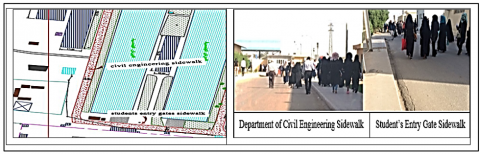
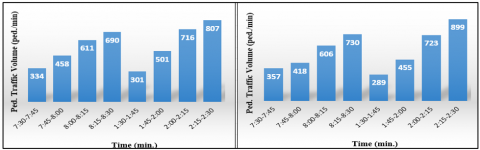
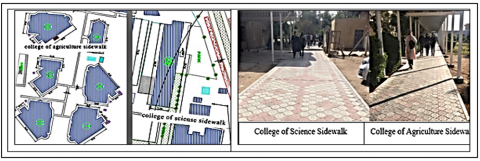
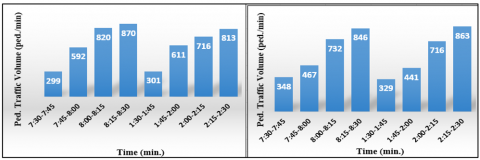
2. Field Survey Measurement: Counting stations and traffic statistic were installed in each section of the study area in order to collect data for pedestrian movement and sidewalks as well as walking speed. A mechanical method was used by a video camera also the manual method by using the counters and stop watch. A section of each sidewalk was selected in the study area with a length of 25 (m) and calculate the pedestrians traffic volume by the number of pedestrians moving through the peak hours (a.m. and p.m.) as shown in Figure 2 (A, B, C, D), Figure 3 (A, B, C, D) and Figure 4 (A, B, C, D) respectively.
(A)&(B)
(C)&(D)
Figure 2. (A). University master plan for zone (1) [16]; (B). Study area at zone (1); (C). University leadership sidwalk zone (1); (D). College of law sidwalk zone (1)
(A)&(B)
(C)&(D)
Figure 3. (A). University master plan for zone (2) [16]; (B). Study area at zone (2); (C). Student’s entry gate sidewalk zone (2); (D). Engineering department sidewalk zone (2)
(A)&(B)
(C)&(D)
Figure 4. (A). University master plan for zone (3) [16]; (B). Study area at zone (3); (C). College of agriculture sidewalk zone (3); (D). College of science sidewalk zone (3)
3.1 Average walking speed at peak hours (a.m. and p.m.)
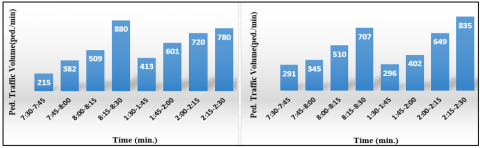
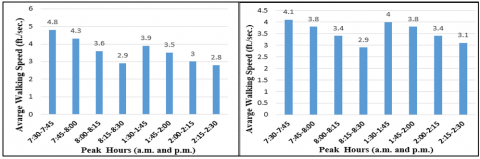
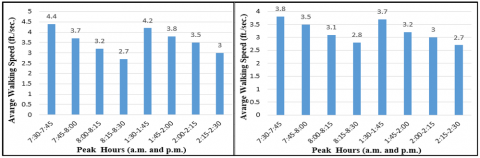
The purpose of studying walking speed is to find the speed at which pedestrians appear in the study area and compare it with the standard walking speed. According to Highway design manual and HCM, the average walking speed range from 2.46 (ft./sec.) to 5.90 (ft./sec.) [2, 10]. Walking speed is obtained by the time of passing through the selected section in (ft./sec.) units, the peak hours was selected from 7:30 to 8:30 (a.m.) and 1:30 to 2:30 (p.m.) as shown in Figure 5 (A, B), Figure 6 (A, B) and Figure 7 (A, B) respectively.
(A)&(B)
Figure 5. (A). Walking speed at university leadership; (B). Walking speed at college of law zone (1)
(A)&(B)
Figure 6. (A). Walking speed at civil engineering department; (B). Walking speed at student’s gate zone (2)
(A)&(B)
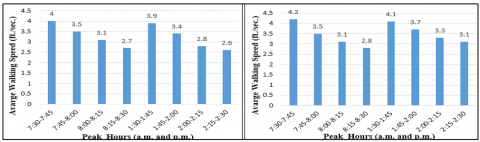
Figure 7. (A). Walking speed at college of agriculture; (B).Walking speed at college of science zone (3)
The study showed that all zones have the same behavior and the walking speed values are variable and within the specification limits, higher walking speed start at the beginning and decrease over time till the end of peak hour (morning and evening) due to the increase in the number of pedestrians and thus it becomes difficult to walk comfortably within the sidewalk , given that most pedestrians are forced to go down to the street and walk parallel to the traffic of vehicles within the university campus streets.
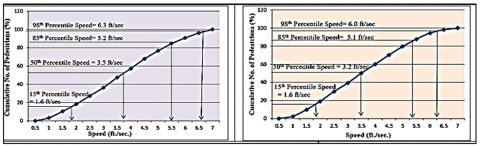
3.2 Walking speed in term of percentile speed
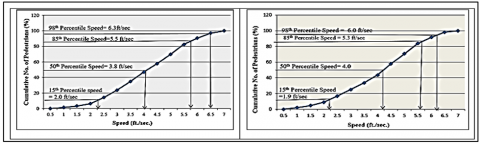
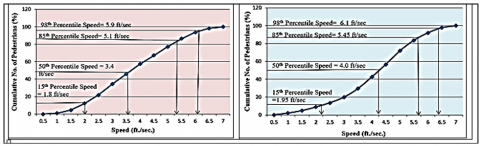
Quantitative analysis in term of 15th, 50th, 85th, 98th percentile speed was taken to evaluate pedestrians walking speed. Then it is modelled for each different locations and conditions to be found and compared with the walking speed specification that range from 2.46 (ft/sec.) to 5.9 (ft/sec.) as shown in Figure 8 (A, B), Figure 9 (A, B) and Figure 10 (A, B) respectively.
The 85th and 15th percentile speed are two parameters that are commonly used in traffic engineering. For example, 85th percentile speed is used to set speed limits and to evaluate the effectiveness of safety, 15th percentile speed is used to establish typical walking speed for traffic signal timing. Based on Figure 8 (A) and 8 (B) for the zone 1, 85% of the total observations walking at this rate or below 5.5 (ft/sec.) and 5.3 (ft/sec.) respectively. 50% is the median speed of the observed data at which half of the observation are below and half of the observation are above which are 3.8 (ft/sec.) and 4 (ft/sec.) respectively, 15% of the observation are walking with typical speed of 2 (ft/sec.) and 1.9 (ft/sec.) respectively. As for the second zone that represented by Figure 9 (A) and 9 (B), 85% of the total observations walking at speed of 5.1 (ft/sec.) and 5.34 (ft/sec.) respectively. 15% of observation walking at rate of (1.8 ft/sec) and (1.95 ft/sec) respectively. As for the final zone which shown in Figure 10 (A) and 10 (B), 85% of the total observations walking at speed of 5.2 (ft/sec.) and 5.1 (ft/sec.) respectively. And for 15% observation walking at speed of 1.6 (ft/sec.) for both study area. The (85th) percentile speed and the average walking speed (50th) are within the speed limitation reaching the upper limit of the specification for all the study area. It can be seen that the pedestrian walking speed varied mainly according to the density, flow and space.
(A)&(B)
Figure 8. (A). Speed at university leadership; (B). Speed at college of law sidewalk zone (1)
(A)&(B)
Figure 9. (A). Speed at Student’s entry gate; (B). Speed at civil engineering department zone (2)
(A)&(B)
Figure 10. (A). Speed at college of agriculture; (B). Speed at college of science zone (3)
3.3 Analyzing level of service (LOS)
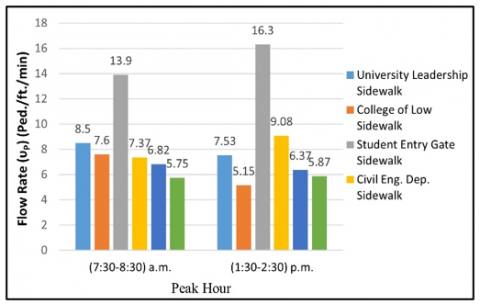
Depending on highway Capacity Manual (HCM) that used to evaluate the quality of operations and sidewalk efficiency by determine the level of service (LOS) in the study area. Flow rate is computed for pedestrians in the selected zones as shown in Figure 11. Evaluation and improvement of sidewalk and pedestrian movement have significant effect on moving, crossing, and sidewalk capacity to provide safe efficient and convenience in the university campus. HCM provide an average flow LOS criteria sidewalks pedestrian’s facility as shown in Table 2 and the computed level of service (LOS) for the study area are shown in Tables 3, 4 and 5.
Figure 11. Flow rate at peak hours
The calculation of pedestrian flow rate (υP) shown in the following Eq. (1):
$v_{\mathrm{P}}=\mathrm{V}_{15} / 15 \mathrm{~W}_{\mathrm{E}}$ (1)
where, V15 = peak 15-min. pedestrian volume (p/15min), υP = pedestrian flow per unit width (p/ft./min), WE = effective sidewalk width (ft).
The results of the study area showed that the level of service is variable during the morning and evening peak hours, as the level of service evaluates the highest traffic volume during the 15 (min.) for each morning and evening peak hours, where there is a direct relationship between level of service and pedestrian flow rate. The condition of pedestrians and their movements and crossing in the study area is require improvement and development to have a better level of service closer to level A.
Table 2. Level of service criteria for sidewalk [17]
|
LOS |
Flow Rate (p/min/ft.) |
Average Space (ft2/p) |
Average Speed (ft./s) |
v/c Ratio |
|
A |
≤5 |
>60 |
>4.25 |
≤0.21 |
|
B |
>5-7 |
>40-60 |
>4.17-4.25 |
>0.21-0.31 |
|
C |
>7-10 |
>24-40 |
>4.00-4.17 |
>0.31-0.44 |
|
D |
>10-15 |
>15-24 |
>3.75-4.00 |
>0.44-0.65 |
|
E |
>15-23 |
>8-15 |
>2.50-3.75 |
>0.65-1.00 |
|
F |
Variable |
≤8 |
≤2.50 |
variable |
Table 3. LOS for pedestrian sidewalk at zone (1)
|
Study Area |
Peak Hour Volume (PHV) |
Effective Sidewalk Width (WE) (ft) |
Peak 15-min Volume (V15) |
Flow Rate (υP) (Ped./ft./min) |
LOS |
|
University Leadership Sidewalk |
(7:30-8:30) (a.m.) (1:30-2:30) (p.m.) |
6.9 |
880 780 |
8.50 7.53 |
C C |
|
College of Low Sidewalk |
(7:30-8:30) (a.m.) (1:30-2:30) (p.m.) |
6.2 |
707 835 |
7.6 5.15 |
C C |
Table 4. LOS for pedestrian sidewalk at zone (2)
|
Study Area |
Peak Hour Volume (PHV) |
Effective Sidewalk Width (WE) (ft) |
Peak 15-min. Volume (V15) |
Flow Rate (υP) (Ped./ft./min) |
LOS |
|
Student Entry Gate Sidewalk |
(7:30-8:30) (a.m.) (1:30-2:30) (p.m.) |
3.3 |
690 807 |
13.9 16.3 |
E E |
|
Civil Eng. Dep. Sidewalk |
(7:30-8:30) (a.m.) (1:30-2:30) (p.m.) |
6.6 |
730 899 |
7.37 9.08 |
C C |
Table 5. LOS for pedestrian sidewalk at zone (3)
|
Study Area |
Peak Hour Volume (PHV) |
Effective Sidewalk Width (WE) (ft) |
Peak 15-min. Volume (V15) |
Flow Rate (υP) (Ped./ft./min) |
LOS |
|
College of Agriculture Sidewalk |
(7:30-8:30) (a.m.) (1:30-2:30) (p.m.) |
8.5 |
870 813 |
6.82 6.37 |
B B |
|
College of Science Sidewalk |
(7:30-8:30) (a.m.) (1:30-2:30) (p.m.) |
9.8 |
846 863 |
5.75 5.87 |
B B |
3.4 Statistical representation of variables
A regression analysis was done using Microsoft Excel to determine the best fit relationship between pedestrians’ volume and average walking speed in term of coefficient of determination (R2) and coefficient of correlation (r) as shown in Table 6.
The coefficient of determination (R2) measures how well a statistical model predicts an outcome. The lowest possible value of R2 is 0 and the highest possible value is 1 The closer the result is to 1, the better and more logical the result of the mathematical prediction becomes. As for the correlation coefficient (r) is the most common way of measuring a linear correlation. It is a number between -1 and 1 that measures the strength and direction of the relationship between two variables. The equations in Table 6 clarify that both coefficient (R2) and (r) have a higher value closer to 1 range from 0.8 to 0.9 for all study areas.
Table 6. Regression analysis result for each zone
|
Zone No. |
Study Area |
Peak Hour |
Equation |
|
(1) |
University Leadership Sidewalk |
a.m. p.m. |
y = -2E-05x2 + 0.0195x - 0.5339 y = -4E-05x2 + 0.045x - 9.1549 |
|
College of Law Sidewalk |
a.m. p.m. |
y = -4E-05x2 + 0.0353x - 2.6913 y = -1E-05x2 + 0.0082x + 2.8021 |
|
|
(2) |
Student’s Entry Gate Sidewalk |
a.m. p.m. |
y = -7E-06x2 + 0.0063x + 2.7759 y = 3E-06x2 - 0.0021x + 3.1821 |
|
Civil Engineering Department Sidewalk |
a.m. p.m. |
y = 1E-05x2 - 0.0112x + 7.3606 y = 4E-06x2 - 0.0058x + 6.3441 |
|
|
(3) |
College of Agriculture Sidewalk |
a.m. p.m. |
y = -1E-05x2 + 0.0145x - 0.7681 y = 5E-06x2 - 0.0036x + 4.5233 |
|
College of Science Sidewalk |
a.m. p.m. |
y = -2E-06x2 - 0.0003x + 4.6818 y = -8E-06x2 + 0.0038x + 4.3468 |
3.5 Pedestrians crossing
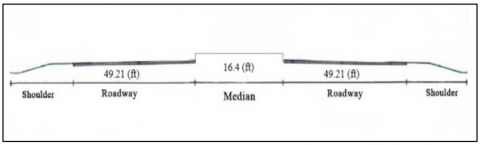
There are 4 main gates lead to Babylon university campus which is considered as access point to the Hilla-Najaf multilane highway. The section of the highway located in front of university gates characterized with (8) lanes, (4) lanes in each direction divided with median 16.4 (ft) width as shown in Figure 12.
Figure 12. Hilla-Najaf highway cross section
From observation and data collection, it was noticed that there is significant pedestrian traffic volume want to cross the roadway to reach the different destination in both directions, due to the roadway width and the high vehicular speed, it was noticed that the average running speed exceeded the design speed of the roadway, while there are no safe refuges for crossing the pedestrian on both sides of the roadway.
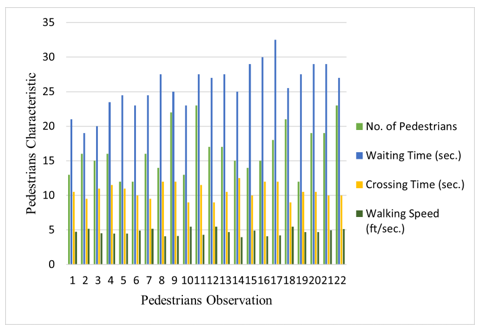
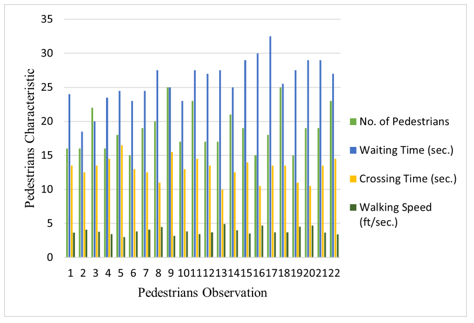
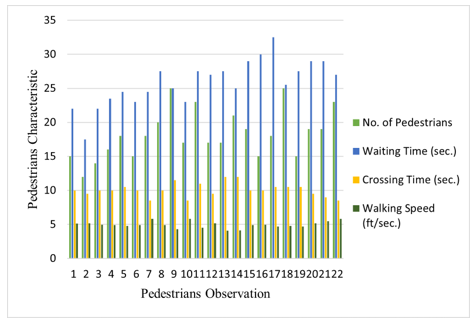
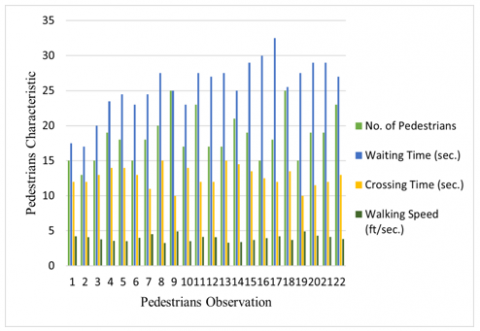
Data at the university gates were conducted during a.m. and p.m. peak hours. The study gives information about pedestrian characteristic such as crossing volumes, crossing time, waiting time and walking speed starting from road shoulder to median then from median to university gates and vice versa as shown in Figure 13, Figure 14, Figure 15 and Figure 16.
Figure 13. Pedestrains characteristic when crossing from shoulder to median at a.m. peak hour
Figure 14. Pedestrains characteristic when crossing from median to university gates at a.m. peak hour
Figure 15. Pedestrains characteristic when crossing from university gates to medium at p.m. peak hour
Figure 16. Pedestrains characteristic when crossing from median to shoulder at p.m. peak hour
It was noticed that the movement of pedestrians and their risk of crossing randomly from shoulder to shoulder on the other side on the highway to reach the university gates, in addition to the passage of vehicles at high speeds. The presence of pedestrians on both sides of the road or at the median, forces the movement of drivers to reduce their speed or stop to allow pedestrians to cross, thus causing Confusion in the movement of vehicles and congestion, Due to the lack of a designated area for crossing and the road not being furnished with important signs, poor traffic management, and planning for pedestrian crossings which leads to a decrease in safety factors for pedestrians that not met the Iraqi standard specification as follow [18]:
• The crossings should be clearly recognizable by drivers.
• The crossing location should not substantially increase the distance pedestrians must walk.
• The crossing should cross the roadway at right angles, whenever possible.
• The crossing must be placed at safe point such as places without restricted visibility and with low running speed.
• The crossing should be provided with protective and control devices such as markings, lighting, refuge islands, barriers of fences, and traffic signals.
3.6 Improvement of pedestrians crossing
From observation and field survey it was found that there is random crossing for pedestrian to the multi-lane highway (Hilla-Najaf) in front of university gates which is not desirable as well as decreases safety factor and resulting in traffic accident so the study seek to develop alternatives taking in consider safety and comfort factors.
3.6.1 Stairways and escalator
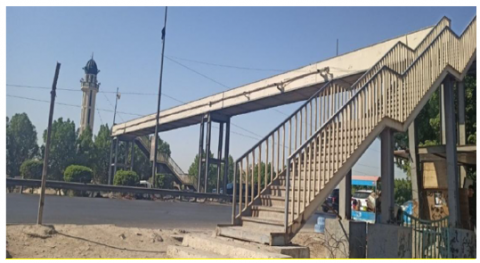
Stairways should be constructed to be with the standard criteria to provide safe and convenient crossing. Comfort, safe stairway and the general appearance will attract the pedestrian in crossing which will increase the level of service and reduce the probability of traffic accidents in front of the university gates as shown in Figure 17.
3.6.2 Ramps
Ramps are generally preferred by users, and are safer however; they take more ground space than stairways as shown in Figure 18.
Bridges and underpass can be alternatives of pedestrian separation. Pedestrian bridges over major roadways can provide direct access to campus areas by completely separating the pedestrians from potential conflict. Devices other than traffic control can also be useful, such as raised medians or pedestrian refuge islands. These serve to separate conflicts by reducing the time of exposure of pedestrians to vehicular traffic.
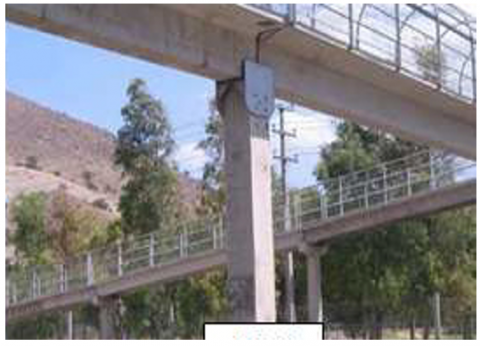
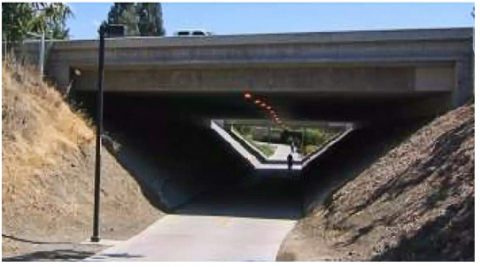
3.6.3 Underpass
Underpasses demand special consideration regarding drainage, lighting and on lengthy underpasses, ventilation. Conditions are often complicated by underground utility ducts, sewer, water mains, etc. Underpasses can provide complete separation of pedestrians and from vehicular traffic. Underpasses also connect off-road trails and paths across major barriers, like freeways, railways, or natural barriers as shown in Figure 19.
Figure 17. Suggested pedestrians’ stairways [19]
Figure 18. Suggested pedestrians ramp [20]
Figure 19. Suggested pedestrians’ underpass [17]
4.1 Conclusions
1. The pedestrians using the roadway in moving and crossing in the study area and this reflected on the level of service performance, which indicates the inefficiency of the sidewalk capacity. Therefore, traffic should be reconsidering to make it more efficient and safer for pedestrians inside university campus such as, reducing the traffic movement in the study area within peak hours.
2. The research observed that the pedestrian speed is an important factors consideration in the pedestrian’s movement and crossing because it is related to safety, time, comfort and convenience, thus Percentile speed was determined for every zone because they represent the standard design specification.
3. The second order equation is the best fit relationship between the pedestrian’s traffic volume and average walking speed. Thus, the equation achieved a higher value of both coefficient of determination (R2) and coefficient of correlation (r).
4.2 Recommendations
1. It is very important to provide roadway furniture inside university campus as well as the multi-lane highway in front of the gates such as marking, sign and signal.
2. Conduct a comprehensive study of pedestrians at the university campus to find appropriate solutions for their movements and crossing in order to reach their destination efficiently and safely.
3. Providing the pedestrians facilities to increase their safety during the movement and crossing.
4. Highway and bridge projects should include clear studies about the pedestrians and their environment to provide factors of safety and convenience in movement and crossing.
5. As the accident type (vehicle/pedestrian) in crossing in front of university gates increased, the research suggested (4) alternatives for pedestrians crossing which are: stairways, escalator, ramps and underpasses.
6. The study suggests a solution for the problem of the pedestrian-vehicle conflict, is to restrict vehicular access to general traffic during certain times of the day. Another solution is to discourage driving through campus by promoting alternative modes of transportation through the use of buses, and walking.
[1] Murwadi, H., Dewancker, B. (2017). Study of quassessment model for campus pedestrian ways, case study: Sidewalk of the University of Lampung. Sustainability, 9(12): 2285. https://doi.org/10.3390/su9122285
[2] Sachelarie, A., Gaiginschi, R. (2020). The investigation of pedestrians’ accident according the place where they are thrown. In IOP Conference Series: Materials Science and Engineering, 997(1): 012131. https://doi.org/10.1088/1757-899X/997/1/012131
[3] Abdulsamad, Q.N., Mohammed, J.A., Abdullah, P.H. (2019). Evaluation of the existing sidewalks in Duhok city. Journal of Duhok University, 22(1): 58-74. https://doi.org/10.26682/sjuod.2019.22.1.9
[4] Zeng, C., Hua, C.Y., Lei, T.Y., Xiao, X.P. (2020). Short-term traffic flow prediction on campus based on modified PSOBP neural network. In Journal of Physics: Conference Series, 1592(1): 012071. https://doi.org/10.1088/1742-6596/1592/1/012071
[5] Hidayat, N., Haryanto, I., Isheka, R.P. (2022). Evaluation of pedestrian facilities performance. In IOP Conference Series: Earth and Environmental Science, 1065(1): 012061. https://doi.org/10.1088/1755-1315/1065/1/012061
[6] Debnath, M., Hasanat-E-Rabbi, S., Hamim, O.F., Hoque, M.S., McIlroy, R.C., Plant, K.L., Stanton, N.A. (2021). An investigation of urban pedestrian behaviour in Bangladesh using the Perceptual Cycle Model. Safety Science, 138: 105214. https://doi.org/10.1016/j.ssci.2021.105214
[7] Jia, X.L., Feliciani, C., Murakami, H., Nagahama, A., Yanagisawa, D., Nishinari, K. (2022). Revisiting the level-of-service framework for pedestrian comfortability: Velocity depicts more accurate perceived congestion than local density. Transportation Research Part F: Traffic Psychology and Behavior, 87: 403-425. https://doi.org/10.1016/j.trf.2022.04.007
[8] Cruz, O.G.D., Padilla, J.A., Victoria, A.N. (2021). Managing road traffic accidents: A review on its contributing factors. In IOP Conference Series: Earth and Environmental Science, 822(1): 012015. https://doi.org/10.1088/1755-1315/822/1/012015
[9] Fadhil, A., Waheeb, R. (2021). A greenway for sustainable transportation of the university campus: Diyala University as a case study. In IOP Conference Series: Earth and Environmental Science, 754(1): 012013. https://doi.org/10.1088/1755-1315/754/1/012013
[10] Sarsam, S.I., Abdulameer, M.W. (2014). Evaluation of pedestrians walking speeds in Baghdad city. Journal of Engineering, 20(9): 1-9. https://doi.org/10.31026/j.eng.2014.09.01
[11] Hamad, K., Htun, P.T.T., Obaid, L. (2021). Characterization of travel behavior at a university campus: A case study of Sharjah University City, UAE. Transportation Research Interdisciplinary Perspectives, 12: 100488. https://doi.org/10.1016/j.trip.2021.100488
[12] Al-Mukaram, N., Musa, S.S. (2020). Determination of pedestrian level of service on sidewalks in samawah city. In IOP Conference Series: Materials Science and Engineering, 928(2): 022077. https://doi.org/10.1088/1757-899X/928/2/022077
[13] Dakhil, A.J., Shaheed, S.M., Alobaidi, D.A. (2019). Studying and evaluating the performance of pedestrian crossing facilities in Babil governorate. Scientific Review Engineering and Environmental Sciences (SREES), 28(3): 417-431. https://doi.org/10.22630/PNIKS.2019.28.3.39
[14] Taha, M.Y., Ali, H.H. (2021). The traffic assessment of the adjacent arterial streets close to gates of the main campus of the University of Mosul, Iraq. In IOP Conference Series: Materials Science and Engineering, 1076(1): 012113. https://doi.org/10.1088/1757-899X/1076/1/012113
[15] Kushchenko, L.E., Kushchenko, S.V., Kravchenko, A.A., Shatova, J.S. (2020). Improving traffic safety and accident prediction at pedestrian crossings. In IOP Conference Series: Materials Science and Engineering, 913(4): 042060. https://doi.org/10.1088/1757-899X/913/4/042060
[16] University Site Plan. (2021). Department of scientific affair, University presidency. University of Babylon, Ministry of Higher Education and Scientific Research, Iraq.
[17] Transportation Research Board. (2010). Highway Capacity Manual (HCM). National Research Council, Washington, D.C. https://www.trb.org/Main/Blurbs/164718.aspx.
[18] Ministry of Housing & Construction. (2005). Highway Design Manual. State Corporation for Roads & Bridges. https://www.scribd.com/document/375181671/Highway-Design-Manual-Second-Edition.
[19] Ismael, Z.A., Mohson, Z.H. (2021). Criteria for designing pedestrian bridges to achieve the aesthetic value in Iraqi cities. Periodicals of Engineering and Natural Sciences, 9(4): 715-728. http://doi.org/10.21533/pen.v9i4.2391
[20] Toro, F.I., Santa María, H., Hube, M.A., Cabrera, T. (2014). Statistical analysis of pedestrian bridges damaged during 2010 Chile earthquake. Frontiers, 10. https://doi.org/10.4231/D3WS8HM6B