Dipanjan Mukherjee*![]() | Abhinay Kumar
| Abhinay Kumar![]()
© 2024 The authors. This article is published by IIETA and is licensed under the CC BY 4.0 license (http://creativecommons.org/licenses/by/4.0/).
OPEN ACCESS
In Indian cities, pedestrian fatalities and injuries have emerged as significant concerns. However, obtaining consistent and reliable crash information poses a significant challenge, particularly in mid-sized Indian cities. In this framework, this study aims to identify and quantify the critical factors influencing pedestrian perceived safety and satisfaction levels in a mid-sized Indian city with respect to diverse land use patterns. A dataset comprising perceptions of 2112 pedestrians regarding 'safety' and 'satisfaction level' has been collected and analyzed across six major intersections characterized by three distinct land use patterns—religious places, commercial areas, and educational hubs—in the central business district area of Patiala city, Punjab, India. With the help of ordered logit models, it has been concluded that the predominant land use pattern, the presence of a pedestrian signal, carriageway width, presence of a curve section at an intersection, vehicular speed, average value of time-to-collision (TTC) at the junction, pedestrian's gender and educational background, and trip purpose significantly affect pedestrians' perceived safety and satisfaction levels. The model outcomes are further constructively utilized to frame suitable policy interventions and recommend remedial measures to enhance pedestrian safety in Indian cities and comparable cities in other low- and middle-income countries (LMICs).
pedestrian safety, satisfaction level, risk factors, countermeasures, low-and-middle-income countries, urban planning, traffic safety
Walking is an essential mode of transportation for a sustainable transportation system since it is suitable for short-distance travel, access to and egress from motorized transit, and recreational purposes. Pedestrianism has a number of advantages, including a decrease in energy use and emissions, improve public health, and create of community- or business-friendly roads. Despite the considerable advantages of pedestrianism, pedestrian fatalities and injuries resulting from road traffic crashes pose significant challenges in Indian cities [1]. Pedestrian deaths account for more than 50% of all traffic fatalities in Indian cities [1]. Therefore, prioritizing pedestrian safety is essential for reducing the fatalities caused by traffic crashes.
Previous studies on pedestrian safety have predominantly focused on the impact of road geometrics and traffic characteristics on crash frequency and severity [2-5]. Additionally, existing literature highlights the importance of built environments in shaping pedestrians' attitudes and crossing behavior [1].
In recent years, several studies conducted in urban India have concentrated on identifying pedestrian risk factors by developing safety performance functions [1, 6-9]. Studies have also employed various proactive tools and techniques to analyze pedestrians' risky crossing behavior in the Indian urban environment [10-14]. Furthermore, several studies have aimed to establish systematic frameworks for evaluating perception-based pedestrian safety assessment and levels of service in the context of Indian urban crosswalks [15-17]. Mukherjee and Mitra [18] conducted a comparative study on pedestrian crossing behavior and risk perception across intersections of varying safety levels in Kolkata city, India. A few studies have examined pedestrian signal violation behavior and its implications for safety in Indian metropolitan areas [8, 19]. In a recent study, Mukherjee and Mitra [14] introduced a framework to identify critical urban intersections through a blend of proactive and reactive approaches. The method outlined in this study combines an analysis of historical crash data, examination of pedestrian-vehicular conflicts (pedestrian-vehicular post-encroachment time), and assessment of pedestrians' risk perception concerning the built environment and traffic parameters. Hussain et al. [20] introduced an integrated VISSIM-SSAM approach to anticipate and alleviate pedestrian collisions and severity at urban crossings in India.
Despite several empirical investigations, a significant knowledge and methodological gap still needs to be addressed to promote pedestrian safety in Indian cities. Firstly, the previous studies in urban India have mostly looked at the major Indian cities. The findings documented from the studies conducted in high-income countries [21-22] and Indian metropolitans [8, 14, 16, 23] may not be directly transferable to a mid-sized Indian city as the road environment is substantially dissimilar along with road users' attitudes, awareness, and behavior [11-14]. Secondly, obtaining reliable and satisfactory crash data is a significant challenge in mid-sized cities [24]. Hence, developing a safety performance function may not be feasible in most mid-sized cities in India. Thirdly, studies that have focused exclusively on identifying pedestrian risk factors in mid-sized Indian cities with respect to different land use patterns are scarce. However, pedestrian activity and risk perception are expected to vary with respect to land use patterns, and this variation will further affect the perceived safety and satisfaction level. Fourthly, prior studies that have simultaneously investigated the effects of road geometrics, traffic parameters, and sociodemographic characteristics on pedestrians' perceived safety and satisfaction levels in a single study are rare in pedestrian safety literature, specifically in the context of urban India. Therefore, it is imperative to examine pedestrian safety and satisfaction levels with respect to different land use patterns under mixed traffic conditions, principally focusing on mid-sized Indian cities.
In this context, the current study aims to identify and estimate the key factors influencing pedestrians' perceived safety and satisfaction levels across various land use patterns in a mid-sized Indian city, employing suitable statistical tools and techniques. To accomplish the research objectives, data on the perceptions of 2112 pedestrians regarding 'safety' and 'satisfaction level' were collected and analyzed across six major intersections with diverse land use patterns located in the central business district (CBD) area of Patiala city, Punjab, India. With the help of ordered logit models, the impact of road geometrics, road infrastructure, land use patterns, traffic exposures, operational parameters, and pedestrians' sociodemographic characteristics on pedestrian perceived safety and satisfaction level has been examined. Afterward, the model results were favorably exploited to formulate a set of policy interventions and endorse suitable countermeasures to improve pedestrian crossing behavior and safety at urban intersections in India and similar cities in other low- and middle-income countries (LMICs).
The present paper contributes significantly to the pedestrian safety literature in five key ways. Firstly, it provides a focused examination of pedestrian safety assessment within the unique context of an Indian mid-sized city. This targeted approach offers valuable insights into the specific challenges and dynamics of pedestrian safety in this urban setting. Secondly, the study evaluates pedestrian safety and satisfaction levels across different land use patterns, recognizing that pedestrian activity and risk perception may vary accordingly. By considering these variations, the study enhances the understanding of the factors influencing pedestrian perceived safety and satisfaction levels. Thirdly, the methodology employed in this study serves as a proactive tool for identifying pedestrian risky zones and understanding the critical factors impacting pedestrian safety and satisfaction levels, especially in scenarios where reliable crash data are unavailable for developing safety performance functions. Fourthly, the study stands out by simultaneously investigating the effects of road geometrics, traffic parameters, and sociodemographic characteristics on pedestrians' perceived safety and satisfaction levels, specifically focusing on the Indian mid-sized city context. This comprehensive approach provides an understanding of the multifaceted factors influencing pedestrian safety. Finally, the conclusions drawn from this study offer actionable insights for engineers, urban planners, policymakers, and designers, providing clear guidance on strategies to enhance pedestrian safety in India and other nations with similar road conditions and pedestrian activities. By addressing these key aspects, the present paper significantly contributes to advancing the knowledge and improving pedestrian safety practices on a global scale.
An individual's knowledge of the risk associated with various traffic situations is referred to as their perception of traffic risk. Road users' risk perception provides important evidence of the possible risk of road traffic crashes, which may be advantageous in detecting the root causes of crashes. Traffic risk perception is also valuable for identifying hazardous locations at the road network level without reliable crash data [18]. In addition, actual crash data only affords crash incidence and severity details. Alternatively, traffic risk perception deals with road users' actual difficulties, challenges, and requirements.
Papadimitriou et al. [25] studied pedestrian attitudes, perceptions, and behavior based on a questionnaire survey conducted in 19 European nations. With the help of Principal Component Analysis, a group of variables reflecting pedestrians' specific attitudes and behavioral aspects was recognized. Based on the risk perception data collected from the five countries, Azik et al. [26] concluded that structural variations in the size and structure of the country, socioeconomic appearances, and road network features significantly impact risk perceptions. Dinh et al. [27] examined associations between attitudes toward road safety, risk perception, and pedestrian behavior in Vietnam and found that road users with higher risk perception engaged in safe crossing behavior.
Several past studies have utilized risk perception techniques to examine the pedestrian level of service (LOS). For example, Kadali and Vedagiri [28] evaluated pedestrian-perceived LOS at unsignalized (unprotected) crosswalks with varying land use patterns under Indian urban mixed traffic conditions. The study concluded that the perceived LOS of pedestrians was considerably influenced by the kind of land use, the number of vehicles they interact with, the median width, and the number of lanes. Further, based on the case study conducted in Ioannina, Greece. Georgiou et al. [29] acknowledged that perceived comfort is an essential determinant in assessing LOS. Nag et al. [30] conveyed a comprehensive approach to evaluating pedestrians' satisfaction levels and ascertaining whether the elements that increase user satisfaction result in a shift in user behavior.
Researchers have recently been motivated to develop safety performance functions to measure pedestrian safety [8, 14, 31]. Avinash et al. [32] utilized the pedestrian safety margin concept to identify the critical factors influencing the possibility of pedestrian-vehicular crashes at urban midblock crossings in Mumbai, Chandigarh, and Ahmedabad cities. Rankavat and Tiwari [33] studied relationships between real and perceived crash risk in Delhi and found a converse correlation between them. Mukherjee and Mitra [16] identified the critical factors influencing pedestrians' perceived crossing difficulty at high crash-prone crossings in Kolkata. The study also found an optimistic relationship between pedestrian crossing difficulty and police-reported crash data.
Even though several past studies investigated pedestrian safety issues in urban India based on safety performance functions [1, 8, 9, 31], pedestrian vehicular conflict analysis [12, 13, 32], and risk perception techniques [16, 33], the studies are primarily restricted to the Indian metropolises. However, pedestrian crossing behavior, attitude, and road safety awareness might be very dissimilar in a mid-sized Indian city. Hence, it is essential to conduct a dedicated study focusing solely on pedestrian safety issues in a typical mid-sized Indian city. Furthermore, previous researchers have not adequately explored the impact of different land use patterns on pedestrian risk perception in the context of mid-sized Indian cities. However, land use patterns play a crucial role in influencing pedestrians' risk-taking attitudes and actual crash occurrences [1, 8, 14]. In this context, the present paper investigates the factors influencing pedestrians' perceived safety and satisfaction levels at six major intersections characterized by three predominant land-use types (i.e., commercial, religious, and educational) under mixed traffic conditions in a typical mid-sized city in India.
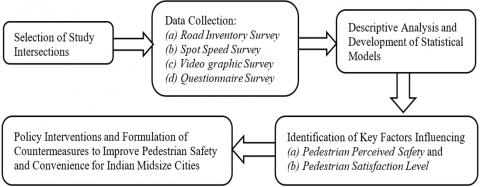
To achieve the research goals of this study, a four-step methodology was followed (Figure 1). The research methodology was simple and easy to follow. The current research entails (a) selection of intersections, (b) survey and data collection (i.e., road inventory survey, spot speed survey, videography survey, and questionnaire survey), (c) descriptive analysis and development of statistical models to identify the significant factors influencing pedestrians' perceived safety and satisfaction levels, (d) formulation of suitable countermeasures and policy interventions to improve pedestrian safety and comfort at urban intersections in the context of Indian mid-size cities. The research methodology was chosen in such a way that it will be able to provide a compressive idea of pedestrian risk factors and factors influencing their satisfaction levels. The methodology employed was straightforward, easily understandable, and readily transferable to the other provinces of urban India. A comparable research methodology was also adopted by past researchers [1, 16].
Figure 1. Study methodology
3.1 Selection of study intersections
To identify the crucial variables influencing pedestrians' perceptions of safety and satisfaction levels, Patiala city in Punjab was selected as a case study. Patiala, situated in southeastern Punjab, northwestern India, holds the distinction of being the fourth-largest city in the state and serves as the administrative capital of Patiala district. Encompassing a total area of 365 square kilometers, Patiala presents a diverse urban landscape ideal for studying pedestrian safety dynamics.
Besides, according to the “Accident Black Spot Identification and Rectification Program on Various Highway/Roads of Punjab: 2021,” a total of 55 black spots exists in Patiala. The presence of this alarming number of black spots underscores the urgent need for focused attention to protect road users and provide a safe road environment in Patiala city [34].
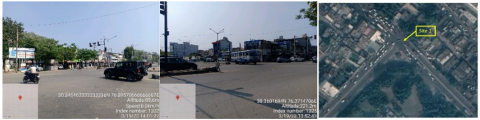
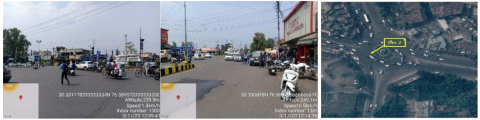
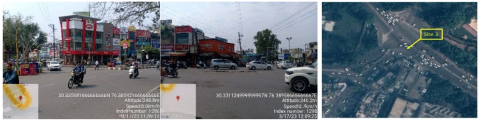
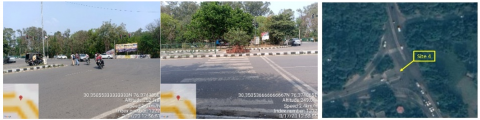
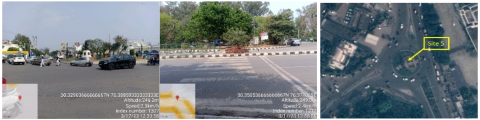
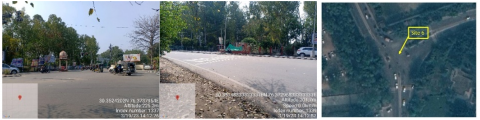
To achieve the present research goal, six major intersections with different land-use types were selected from the CBD area of Patiala city (Figure 2). The selected intersections have diverse land-use types such as (a) commercial zones, (b) religious places, and (c) educational hubs with varied road geometrics and traffic characteristics. However, the land-use patterns are tough to classify as diverse activities that typically occur in mid-sized Indian cities [20]. The current study defines the land-use pattern based on nearby activities (within 100 meters) corresponding to the intersection crossing [14]. In all the selected locations, there is a significantly high volume of pedestrian crossings, leading to frequent and critical interactions between pedestrians and motorists.
Site 1: Dukh Nivaran Sahib Chowk
Site 2: Fountain Chowk Patiala
Site 3: Leela Bhawan Chowk
Site 4: Nabha Road Chowk
Site 5: Thikriwala Chowk
Site 6: TIET Chowk
Figure 2. Study intersections
3.2 Survey and data collection
In this study, (a) road inventory survey, (b) spot speed survey, (c) video graphic survey, and (d) questionnaire survey were conducted by a group of road safety experts and surveyors. The road inventory survey comprised several parameters related to road geometrics, sight distance, road signage and marking, traffic signal parameters, roadside adjacent land use patterns, pavement surface conditions, traffic movement characteristics, etc.
A spot speed survey was carried out at each study location to estimate the approaching vehicle speed at an intersection. Speed data were collected from at least 30 samples for each vehicle category to assess the 85th percentile speed at the site [8].
Subsequently, video recording was conducted at each intersection to estimate the daily average traffic volume and to examine pedestrian-vehicular interaction [16]. The video recording and data extraction were conducted for six hours, from 8 am to 11 am and from 5 pm to 8 pm, to capture both peak and off-peak traffic periods. The classified traffic volume, including turning movements, was manually counted by a team of well-trained research associates. Additionally, to study pedestrian-vehicular interaction, the average time-to-collision was extracted from the video images [35].
A questionnaire survey was conducted to examine pedestrians' perception of 'safety' and 'satisfaction' levels. A group of experienced survey experts directed the onsite questionnaire survey for six hours between morning, 8 am and 11 am, and evening, 5 pm and 8 pm (same as the video recording time phase). The questionnaire survey included information about pedestrians' sociodemographic characteristics, trip purpose, and intended mode of transportation immediately after the crossing. The meaning and importance of each question of the questionnaire were personally explained to each pedestrian to get their opinions on (a) safety and (b) satisfaction with the overall road environment of the intersection on a scale of "1 to 6", where 1 represents "highly safe/highly satisfied" conditions and 6 represents "highly unsafe/highly unsatisfied." The questionnaire form was prepared in English and regional languages (Hindi and Punjabi) to understand the survey respondents better. Further, it should be mentioned that based on pedestrians' willingness to participate in the questionnaire survey, survey participants were chosen, and pedestrians' responses were recorded immediately after the crossing. A total of 2112 pedestrians were surveyed from six intersections. The sample size utilized in this study is greater than the minimum sample size to get reliable results [36].
To assess pedestrian satisfaction level and safety perception, the current study utilized a 6-point scale to compare pedestrian-perceived safety and satisfaction levels with the standard level of service practices (i.e., LOS A, LOS B, LOS C, LOS D, LOS E, LOS F) as suggested in the Highway Capacity Manual and IRC 103: 2012 (i.e., Guidelines for Pedestrian Facilities). The use of pedestrian risk perception and satisfaction level on a 6-point scale is also well-established in the prior research conducted in India and other developing nations [37, 38].
Table 1 provides descriptions of these variables. The number of survey respondents tabulated along with the predominant land use pattern at each intersection is shown in Table 2. Additionally, Table 2 shows each study site's average perceived safety and satisfaction scores. If the perceived safety or satisfaction for 'N1' pedestrian (first pedestrian) is PS1, 'N2' Pedestrian (second pedestrian) is PS2, 'N3' Pedestrian (third pedestrian) is PS3, and 'Nn' pedestrian (Nnth pedestrian) is PSn; then the average safety or satisfaction (PSavg) of the intersection 'i' is:
$P S_{\text {avg }}=\frac{P S_1+P S_2+P S_3+\cdots \ldots+P S_n}{n}$ (1)
where, n is the total number of the survey respondents (i.e., n = N1 + N2 + N3 +…. + Nn) at a particular intersection 'i' during the survey period. A specific site's average safety and satisfaction score indicates the overall safety performance and lacuna of pedestrian infrastructure and traffic operational issues. Sociodemographic information, trip purpose, and intended mode of transportation of the survey respondents have also been presented in Figure 3.
Table 1. Description of variables
|
Variable Name |
Description |
Type of Variable |
Source of Data |
|
Junction type [18] |
|
Categorical |
Road Inventory Survey |
|
Number of legs [1] (approaches) |
|
Categorical |
Road Inventory Survey |
|
Land use type [14] |
The current study defines the land-use pattern based on nearby activities (within 100 meters) corresponding to the intersection crossing. The predominant land use types considered in the present study are as follows:
|
Categorical |
Road Inventory Survey |
|
Pavement Surface conditions [1] |
The pavement surface condition was evaluated by road safety experts and classified into two main groups:
|
Categorical |
Road Inventory Survey |
|
Road alignment |
|
Categorical |
Road Inventory Survey |
|
Sight distance [1] |
|
Categorical |
Road Inventory Survey |
|
Carriageway width (meter) |
Width of the major and minor roads, including median and refuge islands |
4.1 Observations from field survey
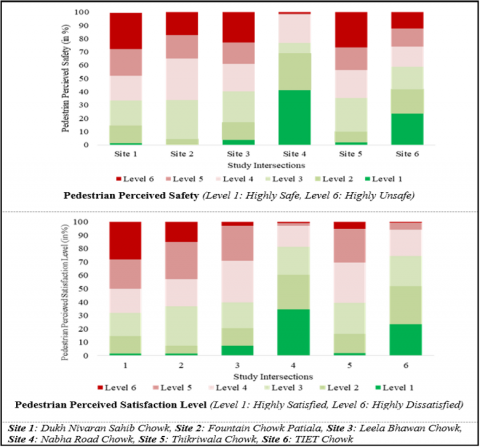
The questionnaire survey findings revealed that pedestrians perceived significantly lower levels of safety and satisfaction at the religious place compared to other locations (Figure. 4). Due to the lack of pedestrian signals along the wider roadway section and non-standard markings of zebra crossing at selected religious locations, pedestrians rated safety and satisfaction as significantly lower. Alternatively, pedestrians perceived higher safety and satisfaction levels near educational hubs. At educational hubs, standard zebra crossings and dedicated pedestrian phases are present, which causes pedestrians to perceive more excellent safety and satisfaction levels compared to commercial and religious locations.
Figure 4. Responses of pedestrian perceived safety and satisfaction level
Table 3. ANOVA test results
|
Variables |
Null Hypothesis |
Sample Size |
f-Statistics |
p-Value |
Remarks |
|
Perceived Safety |
Pedestrian perceived safety doesn't vary with land use type |
2112 |
7.57 |
0.000 |
Reject |
|
Perceived Satisfaction Level |
Pedestrian perceived satisfaction doesn't vary with land use type |
2112 |
6.59 |
0.000 |
Reject |
|
ln(ADT) |
Vehicular volume doesn't vary with land use type |
6 |
1.51 |
0.143 |
Not Reject |
|
85th Percentile Speed |
Vehicular speed doesn't vary with land use type |
248 |
21.38 |
0.000 |
Reject |
|
Pedestrian-Vehicular Interaction |
TTC doesn't vary with land use type |
119 |
8.80 |
0.000 |
Reject |
Table 4. Correlation outcomes of correlation tests
|
Characteristics |
Variable |
Perceived Safety |
Perceived Satisfaction Level |
|
Junction Type |
Signalization |
-0.240*** |
-0.139*** |
|
Police Personnel |
Presence of onsite traffic police |
-0.106*** |
-- |
|
Land Use Type |
Educational |
-0.055** |
-0.180*** |
|
Commercial |
0.024* |
0.039* |
|
|
Religious place |
0.077*** |
0.063*** |
|
|
Presence of Sight Distance |
Presence of adequate sight distance at a junction |
-0.083*** |
-0.079*** |
|
Carriageway Width (meter) |
Road width |
0.138*** |
0.093** |
|
Curved Road |
Presence of a curve at the junction |
0.109*** |
0.057* |
|
On-street Parking |
Presence of on-street parking |
0.083*** |
0.112*** |
|
Crossing Facility |
Presence of zebra crossing |
-0.085*** |
-0.162*** |
|
Sidewalk |
Presence of sidewalk |
-0.066** |
-0.063** |
|
Sidewalk width |
-0.048* |
-0.104*** |
|
|
Bus Stop at Junction |
Absence of commuter facility at the bus stop |
0.196*** |
0.167*** |
|
The Carriageway is Blocked by the Stopped Bus |
The carriageway is blocked by a stopped bus at a junction |
0.055*** |
0.108*** |
|
Central Refuge Island (CRI) |
Presence of CRI at the junction |
-0.019* |
-0.083** |
|
Pavement Marking |
Presence of adequate pavement marking |
-0.0071*** |
-0.086*** |
|
Cycle Length (sec) |
Overall cycle length of the junction |
-0.082*** |
-0.082*** |
|
Timing of Pedestrian Phase (sec) |
Pedestrian phase timing |
-0.103*** |
-0.149*** |
|
Speed |
85th percentile speed of the junction |
0.131*** |
0.184*** |
|
Pedestrian Vehicular Interaction |
Average TTC at the junction |
-0.058*** |
-0.068*** |
|
Gender |
Female |
0.043** |
-- |
|
Educational Qualification |
Post-graduation and above |
-0.059** |
-0.031** |
|
Employment Status |
Unemployed |
0.089** |
0.078** |
|
Business |
0.063** |
0.059** |
|
|
Students |
-0.033** |
-0.031** |
|
|
Purpose of Trip |
Business |
0.155*** |
0.149*** |
|
Job |
-- |
0.104*** |
|
|
Education |
-0.411*** |
-0.503*** |
|
|
Entertainment and religious |
0.678*** |
0.433*** |
|
|
Pedestrian's Intended Mode of Transport |
Public bus |
-- |
0.124** |
Note: ***Significant at 99% Confidence Interval; **Significant at 95% Confidence Interval; *Significant at 90% Confidence Interval, -- Not Significant
4.2 Descriptive analysis
ANOVA was applied to identify the significant differences in pedestrians' perceptions of safety and satisfaction across different land use patterns. The test results indicate pedestrian perceived safety and satisfaction levels, 85th percentile speed, and the average TTC values are not uniform across different land use patterns (Table 3). However, average daily traffic volume doesn't vary significantly with diverse land use types.
The Spearman Rank correlation test was also employed to investigate the effects of each independent variable on pedestrians' perceptions of safety and satisfaction, and the test findings are reported in Table 4. It was identified that the existence of traffic signals, adequate sight distance, wider zebra crossings, and sidewalks have a significant and optimistic impact on pedestrians' perception of a higher safety and satisfaction level. Conversely, lack of pavement marking and road signage, lack of designated bus stop facilities, higher vehicular speed, and a lower TTC value negatively influence the pedestrian perception of safety and satisfaction levels. Regarding pedestrians' sociodemographic aspects, poor educational background, frequency of unemployed persons, and pedestrian's trip purpose substantially affect their perception.
4.3 Model outcomes
Two ordinal logistic (OL) models were developed to identify the critical factors influencing respondents' perceptions of safety and satisfaction. To mitigate multicollinearity issues among independent variables, only a select few were included in the OL modeling, chosen for their lower correlations. Initially, only uncorrelated independent variables showing a high correlation with the dependent variable (perceived safety or satisfaction level) were incorporated into the model. Subsequently, during iterative testing, insignificant variables or those with implausible signs were systematically eliminated. Among several competing models, those deemed "best-fitted" were selected based on various criteria, including model goodness of fit (i.e., log-likelihood value) and theoretical relevance of variables. The subsequent subsections present the model results and their corresponding discussions. Table 5 and Table 6 present the model outcomes.
The model's outcome indicates that the presence of traffic signals (β = -0.67, p<0.01) and sufficient pedestrian phases (β = -0.20, p<0.01) enhances perceived safety (Table 5). Conversely, curved roads at intersections (β = 0.49, p<0.01) and wider road widths (β = 0.23, p<0.01) are associated with decreased perceived safety. Furthermore, pedestrian-perceived safety is notably lower in commercial (β = 0.22, p<0.10) and religious areas (β = 0.59, p<0.10), whereas it is higher in educational zones (β = -0.20, p<0.10). Intersections with higher vehicle speeds (β = 1.15, p<0.01) and lower Time to Collision (TTC) (β = -4.47, p<0.01) values also negatively affect pedestrians' safety perception (β = -4.47, p<0.01). Female pedestrians generally perceive a higher risk compared to male pedestrians (β = 0.31, p<0.01). Additionally, pedestrians with lower levels of education perceive a higher risk when crossing (β = 0.31, p<0.01). Those making trips for work purposes (β = 0.39, p<0.01), as well as religious or entertainment-related trips (β = 0.92, p<0.01), also perceive a higher risk.
Table 6 shows that reduced pedestrian phase timing (β = 0.74, p<0.01), wider road widths (β = 0.68, p<0.01), lack of zebra crossings (β = 1.67, p<0.01), pavement markings (β = 9.82, p<0.01), and the presence of on-street parking (β = 0.30, p<0.01) are associated with decreased pedestrian satisfaction levels. Conversely, wider sidewalk facilities (β = -4.77, p<0.01) and the presence of wider zebra crossings (β = 61, p<0.01) improve pedestrian satisfaction levels. Pedestrian-perceived satisfaction level is considerably lower in commercial (β = 0.13, p<0.10) and religious areas (β = 0.39, p<0.01), whereas it is higher in educational zones (β = -0.54, p<0.01). Pedestrians also report lower satisfaction levels at intersections with significantly higher average vehicular speeds (β = 1.19, p<0.01). Additionally, pedestrians with lower levels of education express higher dissatisfaction (β = 0.39, p<0.01). Interestingly, pedestrians engaged in religious or entertainment-related trips (β = 1.16, p<0.01) exhibit significantly lower satisfaction levels compared to those on educational trips (β = -0.28, p<0.01). Furthermore, commuters waiting for buses at bus stops also perceive lower satisfaction levels (β = 0.69, p<0.01). In the following subsections, the interpretation of each significant variable is explained in detail, drawing upon prior studies conducted not only in India and other LMICs but also in HICs.
Table 5. OL model for pedestrian perceived safety
|
Characteristics |
Variable |
Coefficient |
t-Statistics |
p-Value |
|
Roadway Factors |
Presence of Traffic Signal |
-0.673 |
-8.89 |
0.000 |
|
Pedestrian Phase Timing |
-0.208 |
-9.01 |
0.000 |
|
|
Presence of Curved Road |
0.498 |
3.26 |
0.000 |
|
|
Carriageway Width |
0.236 |
7.67 |
0.001 |
|
|
Land Use Type |
Religious Area |
0.593 |
9.25 |
0.000 |
|
Commercial Area |
0.220 |
1.68 |
0.093 |
|
|
Educational Area |
-0.206 |
-1.85 |
0.064 |
|
|
Traffic Exposures |
85th Percentile Speed at the Site |
1.115 |
9.21 |
0.000 |
|
Pedestrian-Vehicular Interaction |
Time to Collision |
-4.475 |
-4.63 |
0.000 |
|
Demographics |
Female |
0.316 |
2.04 |
0.041 |
|
Education Level |
Up to Primary Level |
0.312 |
2.74 |
0.006 |
|
Post-Graduation and Above |
-0.529 |
-2.57 |
0.010 |
|
|
Trip Purpose |
Job |
0.390 |
3.63 |
0.008 |
|
Entertainment and Religious |
0.926 |
4.24 |
0.000 |
|
|
Students |
-0.407 |
-3.94 |
0.000 |
|
|
Model Summary |
Threshold Parameter (µ1) |
1.39 (1.77)* |
||
|
Threshold Parameter (µ2) |
1.549 (2.33)** |
|||
|
Threshold Parameter (µ3) |
2.987 (4.59)*** |
|||
|
Threshold Parameter (µ4) |
3.190 (4.16)*** |
|||
|
Threshold Parameter (µ5) |
3.951 (5.63)*** |
|||
|
Sample Size |
2112 |
|||
|
Chi-Squared Value (χ2) |
57.45 (p<0.001) |
|||
|
Log-likelihood |
-3576.923 |
|||
|
The goodness of fit (ρ2) |
0.113 |
|||
Note: ***Significant at 99% Confidence Interval; **Significant at 95% Confidence Interval; *Significant at 90% Confidence Interval
Table 6. OL model for pedestrian perceived satisfaction
|
Characteristics |
Variable |
Coefficient |
t-Statistics |
p-Value |
|
Roadway Factors |
Pedestrian Phase Timing |
-0.747 |
-4.60 |
0.000 |
|
Carriageway Width |
0.068 |
3.48 |
0.000 |
|
|
Presence of Zebra Crossing |
-1.671 |
-12.34 |
0.000 |
|
|
Width of Zebra Crossing |
-0.613 |
-10.77 |
0.000 |
|
|
Width of Sidewalk |
-4.77 |
-9.23 |
0.000 |
|
|
Pavement Marking |
-9.824 |
-6.16 |
0.000 |
|
|
On-Street Parking |
0.303 |
3.83 |
0.000 |
|
|
Land Use Type |
Religious Area |
0.399 |
10.77 |
0.000 |
|
Commercial Area |
0.137 |
1.72 |
0.085 |
|
|
Educational Area |
-0.544 |
-10.60 |
0.000 |
|
|
Traffic Exposures |
85th Percentile Speed of the Site |
1.196 |
6.13 |
0.000 |
|
Education Level |
Primary |
0.393 |
3.49 |
0.000 |
|
Trip Purpose |
Education |
-0.286 |
-2.77 |
0.006 |
|
Entertainment and Religious |
1.167 |
3.39 |
0.000 |
|
|
Mode of Transportation |
Bus |
0.698 |
6.64 |
0.000 |
|
Model Summary |
Threshold Parameter (µ1) |
1.158 (2.78)*** |
||
|
Threshold Parameter (µ2) |
1.608 (3.55)*** |
|||
|
Threshold Parameter (µ3) |
3.759 (5.68)*** |
|||
|
Threshold Parameter (µ4) |
4.210 (4.67)*** |
|||
|
Threshold Parameter (µ5) |
5.981 (7.93)*** |
|||
|
Sample Size |
2112 |
|||
|
Chi-Squared Value (χ2) |
195.06 (p<0.001) |
|||
|
Log-likelihood |
-3493.594 |
|||
|
The goodness of fit (ρ2) |
0.129 |
|||
Note: ***Significant at 99% Confidence Interval; **Significant at 95% Confidence Interval; *Significant at 90% Confidence Interval
4.3.1 Roadway factors
The model outcomes indicate the existence of traffic signals with a dedicated pedestrian phase helps improve pedestrians' safety and satisfaction levels. The present finding is consistent with the results documented by past researchers [40, 41]. A study conducted in Montreal, Canada, concluded that pedestrian priority phases reduced injuries, whereas the presence of the green straight arrow increased injuries [42]. In contrast, Quistberg et al. [43] examined the relationship between pedestrian-motor vehicle collisions and the presence of visible traffic signals, pedestrian signals, and signal timing in Lima (Capital of Peru) to determine whether these countermeasures improved pedestrian safety. The study claimed that pedestrian-vehicular collisions were more frequent where signalization was present.
Curved roads at an intersection have a detrimental effect on the pedestrian perception of safety. In general, the presence of a curved section at an intersection blocks the visibility of pedestrians; consequently, they perceive a higher risk of crossing.
Pedestrians generally perceive lesser safety and satisfaction on wider roads. Wider roads have also been linked to a higher risk of fatal pedestrian crashes [44, 45]. Typically, wider roads facilitate faster operating speeds, which may contribute to this perception. Additionally, as the width or the number of lanes of a road increases, pedestrians' crossing time increases, thereby elevating the likelihood of pedestrian-vehicle collisions. A recent report by the World Health Organization (WHO) also emphasized that wider minor roads increase the risk of pedestrian-vehicular crashes [46].
It is also found that the existence of wider zebra crossings, adequate pavement marking, and wider sidewalks are helpful in improving pedestrian satisfaction levels. A study by Mukherjee and Mitra [1] found that the presence of wider and more accessible zebra crossings is beneficial in reducing the frequency of pedestrian fatalities. William et al. [47] also acknowledged that zebra crossings help reduce critical interactions between pedestrians and motorists. Further, there is some evidence that zebra crossing plays a vital role in reducing pedestrian-vehicular critical conflicts at controlled and uncontrolled intersections [48].
The model's outcomes show that having on-street parking close to a junction raises the possibility of pedestrian dissatisfaction. On-street parking makes it difficult for vehicle drivers and pedestrians to see each other clearly, which may be a significant factor in pedestrians' lower safety perception and greater dissatisfaction. Landis et al. [49] and Asadi-Shekari et al. [50] also concluded that the presence of on-street parking significantly affects pedestrian safety and comfort.
4.3.2 Land use type
The land use type also influences pedestrians' perception of safety and satisfaction levels, impacting their crossing behavior. Pedestrians perceived lower safety and satisfaction levels at religious places and commercial areas. This could be due to a lack of pedestrian-friendly infrastructure, the presence of parked vehicles, and high vehicular speed at those locations. Alternatively, pedestrians perceive higher safety and satisfaction near educational areas. In Patiala city, traffic signals with separate pedestrian phases commonly exist in educational areas, which reduces the pedestrian crossing difficulty; consequently, pedestrians perceive a higher level of comfort in these locations. Effati and Saheli [51] investigated the influence of rural land uses and accessibility-related factors on pedestrian safety in Guilan province, Iran, utilizing GIS and machine learning techniques. The study revealed that residential land uses had the most adverse effect on safety. Additionally, it confirmed that commercial and retail, governmental, and institutional land uses, along with the number of access roads, negatively impacted pedestrian safety on rural multilane roads. Similarly, Osama and Sayed [52] highlighted those commercial hubs and residential areas with more access points negatively affected pedestrian safety in Vancouver city, Canada. A recent study by Sung et al. [53] demonstrated that pedestrians face a higher risk of being involved in crashes in areas with mixed land use in Seoul, Korea.
4.3.3 Traffic exposure
The present study finding shows a positive correlation between higher speed and a lower level of safety and satisfaction. The former studies also reported similar observations. For example, a study conducted by Gårder [54] in the USA concluded that wide roadways and faster speeds increase the number of pedestrian deaths. Alhajyaseen et al. [55] also acknowledged that speed is a major factor in pedestrian vehicular crashes in Japan. The earlier research in Indian metropolises also drew similar conclusions [1, 14-16]. Furthermore, studies have confirmed the effects of traffic exposure on child pedestrian safety in the context of HICs [56-58].
4.3.4 Pedestrian-vehicular interaction
The model's output reveals a strong negative correlation between the average TTC and pedestrians' perceptions of safety. Due to the lack of pedestrian crossing facilities, wider roads, and faster-moving vehicles, the average TTC value is much lower in religious and commercial areas. On the other hand, the average TTC is significantly higher and close to an educational hub. This may be because educational hubs have traffic signals with dedicated pedestrian phases and user-friendly crossing facilities. Several earlier studies have assessed pedestrian safety utilizing TTC and also identified a significant and negative association between pedestrian-vehicular collisions and lower TTC values in the context of both LMICs and HICs [59-63].
4.3.5 Sociodemographic characteristics
The model result indicates that females perceived lower safety compared to male pedestrians. Pedestrians with a lower educational qualification also perceived a higher risk and lower satisfaction level compared to pedestrians with a higher education level. Zhang et al. [64] acknowledged that pedestrian crossing behavior and risk perception improve with their education levels. Lartey [65] also revealed that pedestrians with lower educational backgrounds were unable to accurately predict the risk of pedestrian crashes and injuries. Duperrex et al. [66] emphasized the importance of traffic safety education to promote safe crossing behavior among pedestrians. A recent study by Mukherjee and Mitra [8] confirmed that the risk associated with signal violations by pedestrians with lower educational backgrounds is significantly higher in urban settings in India.
Pedestrians' trip purpose plays a significant role in pedestrian risk perception. Pedestrians committing religious and entertainment-related trips have a higher risk perception than educational or office-related trips. A few past studies have confirmed the impact of pedestrian trip characteristics, such as going to work or coming back from work, within the framework of HICs [67, 68]; however, none of the prior studies have demonstrated the effect of various trip purposes on pedestrian risk perception.
4.3.6 Intended mode of transportation
The intended mode of transportation for pedestrians also influences their perceived satisfaction. For example, a pedestrian waiting for a bus may experience lower satisfaction levels. This could be attributed to the lack of real-time bus service information, inadequate designated bus stop facilities, and the absence of suitable access to bus stops in mid-sized Indian cities, leading to increased unease among pedestrians. This finding underscores the broader implications of urban planning and strategic decisions on pedestrians' satisfaction levels and risky crossing behavior. The study completed by Mukherjee and Mitra [8] also discovered that pedestrian red-light jumping behavior is significantly more prevalent near bus stops in Indian metropolitans. Cheranchery et al. [69] acknowledged that the absence of pedestrian infrastructure is primarily responsible for the heightened risk perception by pedestrians near a bus stop.
To lower the risk of pedestrian crashes and to promote pedestrian safety and convenience, it is crucial to develop suitable action plans that have been proven to reduce pedestrian fatalities and injuries [70-77]. The following corrective actions and policy interventions are suggested in light of several essential inferences from the present study (Table 7).
Table 7. Recommendations of countermeasures to improve pedestrian safety and satisfaction
|
Characteristics |
Risk Factors |
Recommendations |
|
Roadway Factors |
Absence of Pedestrian Phase |
|
|
Carriageway Width |
|
|
|
Zebra Crossing |
|
|
|
Absence of Adequate wide Sidewalk |
|
|
|
Lack of Pavement Marking |
|
|
|
On-Street Parking |
|
|
|
Curve at intersection |
|
|
|
Pedestrian-Vehicular Interaction |
Lowe value of average Time to Collision |
|
|
Land Use Pattern |
Religious and Commercial areas |
|
|
Traffic Exposures |
Higher vehicular speed |
|
|
Educational Background |
Poor educational background (up to primary level) |
|
|
Trip Purpose |
Religious |
|
|
Mode of Transportation |
Bus |
|
The study recommends several measures to enhance pedestrian safety and satisfaction levels. Firstly, it suggests the implementation of wider and more accessible zebra crossing along with adequate wide footpath facilities close to the intersection. The footpath and zebra crossing must be well connected to confirm pedestrians' comfort and safety. Additionally, installing appropriate traffic calming treatments and ensuring proper pavement markings, including zebra crossings, stop lines, and edge lines, are essential steps to promote pedestrian safety. Off-street parking facilities should be provided in urban areas to mitigate congestion and improve pedestrian accessibility.
To further enhance pedestrian safety, locations with lower Time to Collision (TTC) values should be upgraded with signalization featuring dedicated pedestrian signal phases. Commercial and religious areas require pedestrian crosswalks, wider sidewalk facilities, speed limit signs, and adequate illumination to ensure pedestrian comfort, convenience, and safety. Installing CCTV cameras and implementing speed monitoring in these areas are also crucial measures.
Moreover, urban bus stops should be equipped with commuter facilities and accompanied by adequate street lights, zebra crossings, sidewalks, and pavement markings. In addition, informative signage, such as "bus stop ahead" signs, should be placed at designated bus stops to alert pedestrians and motorists.
Lastly, campaigns aimed at promoting pedestrian safety, educating the public, and disseminating relevant information are essential, particularly for pedestrians from low-educational communities. These campaigns play a vital role in raising awareness and fostering a culture of pedestrian safety among the general populace.
Pedestrian safety is a significant concern in LMICs. However, the scarcity of research on pedestrian safety evaluation using crash data can be attributed to the poor and inconsistent collection of such data, a common issue observed in LMICs. Further, in medium-sized Indian cities, the lack of reliable and consistent crash information is a considerable challenge. The current paper examines the critical elements affecting pedestrian perceptions of safety and satisfaction in a medium-sized Indian city with mixed traffic conditions. The critical contributions of the present study are emphasized below.
• The study reveals that religious areas exhibited the lowest pedestrian perception of safety, followed by commercial hubs. The findings indicate that key factors influencing pedestrian safety in these areas include inadequate infrastructure, such as the absence of traffic signals (for both traffic and pedestrians), zebra crossings, wide sidewalks, designated bus stops nearby, and clear sight distance at intersections.
• Pedestrians perceive a higher risk when crossing wider carriageways and report lower satisfaction levels. The current finding underscores the importance of implementing grade-separated pedestrian crossing facilities for wider intersections. Additionally, pedestrian signalization and the inclusion of pedestrian refuge islands may be warranted for wider unsignalized intersections with high pedestrian and traffic volumes to enhance safety and mitigate conflicts between pedestrians and vehicles.
• The Time-to-Collision (TTC), a metric measuring pedestrian-vehicle interaction, was also found to have a strong and negative correlation with pedestrian perceptions of safety. The current research suggests that higher TTC values indicate a reduced frequency of critical interactions between pedestrians and vehicles, thereby lowering the risk of collisions. Therefore, signalization with a designated pedestrian phase is recommended to enhance safety at the crossings with low TTC values. Also, grade-separated pedestrian crossing facilities such as pedestrian underpasses or foot-over bridges may be constructed at intersections with lower TTC values to separate pedestrians from motorized traffic completely.
• It was also revealed that pedestrians typically judge a lower safety level at an intersection having high-speed vehicles. Therefore, it is imperative to enforce speed laws and implement necessary measures to reduce traffic speed in mid-sized Indian cities, particularly at at-grade crossings.
• The model findings suggest that pedestrians with lower educational backgrounds perceive a higher crossing risk at urban intersections in India. Hence, it is essential to enhance pedestrian safety and confidence levels through systematic training and education programs, which are currently lacking in mid-sized Indian cities.
• The current article also emphasizes the impact of sociodemographic factors on pedestrian safety perception and satisfaction levels. It was found that perceived safety and satisfaction levels are lower for pedestrians making religious trips. While the current research underscores the necessity for appropriate and secure pedestrian infrastructure near religious locations, it also suggests that these areas could benefit from systematic road safety education and advocacy to enhance pedestrian safety and crossing activities.
• Lastly, it was acknowledged that the perceived level of pedestrian satisfaction for public bus users is much lower; therefore, locations with more bus routes should be given priority to building safe crossing facilities. In mid-sized Indian cities like Patiala, a significant problem is caused by the absence of a designated bus stop. The dissatisfaction of pedestrians in a mid-sized Indian city can be attributed, in part, to the inaccessibility of the bus stop, the absence of a zebra crossing close to a bus stop, the absence of informative signage, the lack of a dedicated bus lane, and the absence of real-time information on the availability of bus services. To make walking a more comfortable and confident experience for pedestrians, it is essential to provide infrastructure for public bus services that are both safer and more pedestrian-friendly.
Like other studies, this one also has several limitations. Firstly, the perceived safety and satisfaction levels of pedestrians were not correlated with actual crash data due to the unavailability of recent crash statistics. Additionally, this study did not account for the influence of risky driving attitudes on pedestrian risk perception. While the established models in the current paper provide acceptable estimates, a larger sample size for the questionnaire survey would have allowed for a more robust assessment of variables with a greater confidence level. Moreover, the examination of pedestrian-vehicular conflicts was limited to a sample period of six hours, which may not capture all variations and warrants further investigation over a longer duration. Lastly, the study was restricted to only six intersections, which may limit the generalizability of the findings. Expanding the number of intersections would allow for a more comprehensive analysis and enhance the overall robustness of the study.
Future research endeavors could concentrate on establishing a robust relationship between pedestrian risk perception and actual crash occurrences within the framework of Indian mid-sized cities. Enhancing the sample size, encompassing both the number of intersections and survey respondents, is imperative to bolster the reliability and generalizability of findings. Moreover, it is essential to assess the geographical applicability of the proposed models along with conducting model validation. The examination of pedestrian-vehicular conflicts was limited to a six-hour sample period in the current study, necessitating data collection over a more extended duration to capture a broader spectrum of variations. Furthermore, upgrading data collection and extraction techniques would enable advanced analysis in future studies.
Despite several further research possibilities, the present study findings could be valuable in improving pedestrian safety, comfort, and confidence levels at the intersection level in mid-sized Indian cities and similar cities in other LMICs.
[1] Mukherjee, D., Mitra, S. (2022). The role of built environment on pedestrian safety and pedestrian activity at urban signalized intersections. Transportation in Developing Economies, 8: 33. https://doi.org/10.1007/s40890-022-00168-1
[2] Budzynski, M., Guminska, L., Jamroz, K., Mackun, T., Tomczuk, P. (2019). Effects of road infrastructure on pedestrian safety. IOP Conference Series: Materials Science and Engineering, 603(4): 042052. https://doi.org/10.1088/1757-899X/603/4/042052
[3] Chaudhari, A., Gore, N., Arkatkar, S., Joshi, G., Pulugurtha, S. (2021). Exploring pedestrian surrogate safety measures by road geometry at midblock crosswalks: A perspective under mixed traffic conditions. IATSS Research, 45(1): 87-101. https://doi.org/10.1016/j.iatssr.2020.06.001
[4] Stipancic, J., Miranda-Moreno, L., Strauss, J., Labbe, A. (2020). Pedestrian safety at signalized intersections: Modelling spatial effects of exposure, geometry and signalization on a large urban network. Accident Analysis & Prevention, 134: 105265. https://doi.org/10.1016/j.aap.2019.105265
[5] Budzynski, M., Gobis, A., Guminska, L., Jelinski, L., Kiec, M., Tomczuk, P. (2021). Assessment of the influence of road infrastructure parameters on the behaviour of drivers and pedestrians in pedestrian crossing areas. Energies, 14(12): 3559. https://doi.org/10.3390/en14123559
[6] Hamed, M.M. (2001). Analysis of pedestrians’ behavior at pedestrian crossings. Safety Science, 38(1): 63-82. https://doi.org/10.1016/S0925-7535(00)00058-8
[7] Ridel, D., Rehder, E., Lauer, M., Stiller, C., Wolf, D. (2018). A literature review on the prediction of pedestrian behavior in urban scenarios. In 2018 21st International Conference on Intelligent Transportation Systems (ITSC), Maui, HI, USA, pp. 3105-3112. https://doi.org/10.1109/ITSC.2018.8569415
[8] Mukherjee, D., Mitra, S. (2020). A comprehensive study on factors influencing pedestrian signal violation behaviour: Experience from Kolkata city, India. Safety Science, 124: 104610. https://doi.org/10.1016/j.ssci.2020.104610
[9] Rankavat, S., Tiwari, G. (2015). Association between built environment and pedestrian fatal crash risk in Delhi, India. Transportation Research Record, 2519(1): 61-66. https://doi.org/10.3141/2519-07
[10] Kadali, B.R., Vedagiri, P. (2016). Proactive pedestrian safety evaluation at unprotected mid-block crosswalk locations under mixed traffic conditions. Safety Science, 89: 94-105. https://doi.org/10.1016/j.ssci.2016.05.014
[11] Shah, H., Vedagiri, P. (2018). Proactive pedestrian safety evaluation at unsignalized intersections in India using surrogate safety measures (No. 18-02052). https://trid.trb.org/View/1495152.
[12] Avinash, C., Gore, N., Shriniwas, A., Gaurang, J., Manoranjan, P. (2020). Choice crossing behaviour model for safety margin of pedestrian at mid-blocks in India. Transportation Research Procedia, 48: 2329-2342. https://doi.org/10.1016/j.trpro.2020.08.285
[13] Mitra, S., Mukherjee, D., Mitra, S. (2019). Safety assessment of urban un-signalized intersections using conflict analysis technique. Journal of the Eastern Asia Society for Transportation Studies, 13: 2163-2181. https://doi.org/10.11175/easts.13.2163
[14] Mukherjee, D., Mitra, S. (2022). Pedestrian safety analysis of urban intersections in Kolkata, India using a combined proactive and reactive approach. Journal of Transportation Safety & Security, 14(5): 754-795. https://doi.org/10.1080/19439962.2020.1818907
[15] Rankavat, S., Tiwari, G. (2016). Pedestrians risk perception of traffic crash and built environment features - Delhi, India. Safety Science, 87: 1-7.
[16] Mukherjee, D., Mitra, S. (2022). What affects pedestrian crossing difficulty at urban intersections in a developing country? IATSS Research, 46(4): 586-601. https://doi.org/10.1016/j.iatssr.2022.10.002
[17] Bansal, A., Goyal, T., Sharma, U. (2021). Pedestrian level of service of un-signalised intersections using an integrated approach of pedestrian-risk-perception survey and structural equation modelling. In: Devi, L., Asaithambi, G., Arkatkar, S., Verma, A. (eds) Proceedings of the Sixth International Conference of Transportation Research Group of India. CTRG 2021. Lecture Notes in Civil Engineering, 272: 245-268. Singapore: Springer Nature Singapore. https://doi.org/10.1007/978-981-19-3494-0_15
[18] Mukherjee, D., Mitra, S. (2019). A comparative study of safe and unsafe signalized intersections from the view point of pedestrian behavior and perception. Accident Analysis & Prevention, 132: 105218. https://doi.org/10.1016/j.aap.2019.06.010
[19] Tiwari, G., Bangdiwala, S., Saraswat, A., Gaurav, S. (2007). Survival analysis: Pedestrian risk exposure at signalized intersections. Transportation Research Part F: Traffic Psychology and Behaviour, 10(2): 77-89. https://doi.org/10.1016/j.trf.2006.06.002
[20] Hussain, M.S., Goswami, A.K., Gupta, A. (2023). Predicting pedestrian crash locations in urban India: An integrated GIS-based spatiotemporal HSID technique. Journal of Transportation Safety & Security, 15(2): 103-136. https://doi.org/10.1080/19439962.2022.2048759
[21] Charters, K.E., Gabbe, B.J., Mitra, B. (2017). Population incidence of pedestrian traffic injury in high-income countries: A systematic review. Injury, 48(7): 1331-1338. https://doi.org/10.1016/j.injury.2017.05.021
[22] Stoker, P., Garfinkel-Castro, A., Khayesi, M., Odero, W., Mwangi, M.N., Peden, M., Ewing, R. (2015). Pedestrian safety and the built environment: A review of the risk factors. Journal of Planning Literature, 30(4): 377-392. https://doi.org/10.1177/0885412215595438
[23] Tiwari, G. (2020). Progress in pedestrian safety research. International Journal of Injury Control and Safety Promotion, 27(1): 35-43. https://doi.org/10.1080/17457300.2020.1720255
[24] Jha, A.N., Tiwari, G., Chatterjee, N. (2020). Road accidents in EU, USA and India: A critical analysis of data collection framework. Strategic System Assurance and Business Analytics, 419-443. https://doi.org/10.1016/j.ssci.2012.09.008
[25] Papadimitriou, E., Theofilatos, A., Yannis, G. (2013). Patterns of pedestrian attitudes, perceptions and behaviour in Europe. Safety Science, 53: 114-122. https://doi.org/10.1016/j.ssci.2012.09.008
[26] Azık, D., Solmazer, G., Ersan, Ö., Kaçan, B., Fındık, G., Üzümcüoğlu, Y., Özkan, T., Lajunen, T., Öz, B., Pashkevich, A., Pashkevich, M., Danelli-Mylona, V., Georgogianni, D., Krasniqi, E.B., Krasniqi, M., Makris, E., Shubenkova, K., Xheladini, G. (2021). Road users’ evaluations and perceptions of road infrastructure, trip characteristics, and daily trip experiences across countries. Transportation Research Interdisciplinary Perspectives, 11: 100412. https://doi.org/10.1016/j.trip.2021.100412
[27] Dinh, D.D., Vũ, N.H., McIlroy, R.C., Plant, K.A., Stanton, N.A. (2020). Effect of attitudes towards traffic safety and risk perceptions on pedestrian behaviours in Vietnam. IATSS Research, 44(3): 238-247. https://doi.org/10.1016/j.iatssr.2020.01.002
[28] Kadali, B.R., Vedagiri, P. (2013). Modelling pedestrian road crossing behaviour under mixed traffic condition. European Transport, 55(3): 1-17.
[29] Georgiou, A., Skoufas, A., Basbas, S. (2021). Perceived pedestrian level of service in an urban central network: The case of a medium size Greek city. Case Studies on Transport Policy, 9(2): 889-905. https://doi.org/10.1016/j.cstp.2021.04.009
[30] Nag, D., Bhaduri, E., Kumar, G.P., Goswami, A.K. (2020). Assessment of relationships between user satisfaction, physical environment, and user behaviour in pedestrian infrastructure. Transportation Research Procedia, 48: 2343-2363. https://doi.org/10.1016/j.trpro.2020.08.284
[31] Priyadarshini, P., Mitra, S. (2018). Investigating pedestrian risk factors leading to pedestrian fatalities in Kolkata city roads. Transportation in Developing Economies, 4: 1-11. https://doi.org/10.1007/s40890-017-0054-9
[32] Avinash, C., Jiten, S., Arkatkar, S., Gaurang, J., Manoranjan, P. (2019). Evaluation of pedestrian safety margin at mid-block crosswalks in India. Safety Science, 119: 188-198. https://doi.org/10.1016/j.ssci.2018.12.009
[33] Rankavat, S., Tiwari, G. (2020). Influence of actual and perceived risks in selecting crossing facilities by pedestrians. Travel Behaviour and Society, 21: 1-9. https://doi.org/10.1016/j.tbs.2020.05.003
[34] Accident Black Spot Identification & Rectification Program on Various Highway/Roads of Punjab- 2021. https://punjabpolice.gov.in/PDFViwer.aspx?pdfFileName=~/writereaddata/UploadFiles/OtherFiles/RAB2021.pdf.
[35] Minderhoud, M.M., Bovy, P.H. (2001). Extended time-to-collision measures for road traffic safety assessment. Accident Analysis & Prevention, 33(1): 89-97. https://doi.org/10.1016/S0001-4575(00)00019-1
[36] Özdamar, K. (2003). Modern bilimsel araştırma yöntemleri: Araştırma planlama, toplum ve örnek seçimi, güç analizi, proje hazırlama, veri toplama, veri analizi, bilimsel rapor yazımı. Kaan Kitabevi.
[37] Hidayat, N., Choocharukul, K., Kishi, K. (2011). Pedestrian level of service model incorporating pedestrian perception for sidewalk with vendor activities. In Proceedings of the Eastern Asia Society for Transportation Studies (The 9th International Conference of Eastern Asia Society for Transportation Studies, 2011), 8: 197-197. Eastern Asia Society for Transportation Studies. https://doi.org/10.11175/eastpro.2011.0.197.0
[38] Meng, J.Q., Zhu, Z.J., Zeng, J. (2014). The research on the system of level of service of the city commercial pedestrian street. Applied Mechanics and Materials, 505: 656-665. https://doi.org/10.4028/www.scientific.net/AMM.505-506.656
[39] Washington, S.P., Karlaftis, M.G., Mannering, F., Anastasopoulos, P. (2020). Statistical and econometric methods for transportation data analysis. Chapman and Hall, CRC Press, New York.
[40] Koh, P.P., Wong, Y.D., Chandrasekar, P. (2014). Safety evaluation of pedestrian behaviour and violations at signalised pedestrian crossings. Safety Science, 70: 143-152. https://doi.org/10.1016/j.ssci.2014.05.010
[41] Deb, S., Carruth, D.W., Sween, R., Strawderman, L., Garrison, T.M. (2017). Efficacy of virtual reality in pedestrian safety research. Applied Ergonomics, 65: 449-460. https://doi.org/10.1016/j.apergo.2017.03.007
[42] Stipancic, J., Miranda-Moreno, L., Strauss, J., Labbe, A. (2020). Pedestrian safety at signalized intersections: Modelling spatial effects of exposure, geometry and signalization on a large urban network. Accident Analysis & Prevention, 134: 105265. https://doi.org/10.1016/j.aap.2019.105265
[43] Quistberg, D.A., Koepsell, T.D., Boyle, L.N., Miranda, J.J., Johnston, B.D., Ebel, B.E. (2014). Pedestrian signalization and the risk of pedestrian-motor vehicle collisions in Lima, Peru. Accident Analysis & Prevention, 70: 273-281. https://doi.org/10.1016/j.aap.2014.04.012
[44] Prato, C.G., Gitelman, V., Bekhor, S. (2012). Mapping patterns of pedestrian fatal accidents in Israel. Accident Analysis & Prevention, 44(1): 56-62. https://doi.org/10.1016/j.aap.2010.12.022
[45] Babić, D., Babić, D., Fiolic, M., Ferko, M. (2022). Road markings and signs in road safety. Encyclopedia, 2(4): 1738-1752. https://doi.org/10.3390/encyclopedia2040119
[46] World Health Organization. (2023). Pedestrian safety: A road safety manual for decision-makers and practitioners. World Health Organization.
[47] William, A., Kolawole, O.T., Comfort, O.A., Francis, A. (2021). Driver compliance and pedestrian safety at zebra crossings in the Cape Coast Metropolis, Ghana. Urban, Planning and Transport Research, 9(1): 464-478. https://doi.org/10.1080/21650020.2021.1984984
[48] Olszewski, P., Dąbkowski, P., Szagała, P., Czajewski, W., Buttler, I. (2020). Surrogate safety indicator for unsignalised pedestrian crossings. Transportation Research Part F: Traffic Psychology and Behaviour, 70: 25-36. https://doi.org/10.1016/j.trf.2020.02.011
[49] Landis, B.W., Vattikuti, V.R., Ottenberg, R.M., McLeod, D.S., Guttenplan, M. (2001). Modeling the roadside walking environment: Pedestrian level of service. Transportation Research Record, 1773(1): 82-88. https://doi.org/10.3141/1773-10
[50] Asadi-Shekari, Z., Moeinaddini, M., Shah, M.Z. (2015). Pedestrian safety index for evaluating street facilities in urban areas. Safety Science, 74: 1-14. https://doi.org/10.1016/j.ssci.2014.11.014
[51] Effati, M., Saheli, M.V. (2022). Examining the influence of rural land uses and accessibility-related factors to estimate pedestrian safety: The use of GIS and machine learning techniques. International Journal of Transportation Science and Technology, 11(1): 144-157. https://doi.org/10.1016/j.ijtst.2021.03.005
[52] Osama, A., Sayed, T. (2017). Macro-spatial approach for evaluating the impact of socio-economics, land use, built environment, and road facility on pedestrian safety. Canadian Journal of Civil Engineering, 44(12): 1036-1044. https://doi.org/10.1139/cjce-2017-0145
[53] Sung, H., Lee, S., Cheon, S., Yoon, J. (2022). Pedestrian safety in compact and mixed-use urban environments: Evaluation of 5D measures on pedestrian crashes. Sustainability, 14(2): 646. https://doi.org/10.3390/su14020646
[54] Gårder, P.E. (2004). The impact of speed and other variables on pedestrian safety in Maine. Accident Analysis & Prevention, 36(4): 533-542. https://doi.org/10.1016/S0001-4575(03)00059-9
[55] Alhajyaseen, W.K., Asano, M., Nakamura, H. (2012). Estimation of left-turning vehicle maneuvers for the assessment of pedestrian safety at intersections. IATSS Research, 36(1): 66-74. https://doi.org/10.1016/j.iatssr.2012.03.002
[56] Posner, J.C., Liao, E., Winston, F.K., Cnaan, A., Shaw, K.N., Durbin, D.R. (2002). Exposure to traffic among urban children injured as pedestrians. Injury Prevention, 8(3): 231-235. https://doi.org/10.1136/ip.8.3.231
[57] Macpherson, A., Roberts, I., Pless, I.B. (1998). Children's exposure to traffic and pedestrian injuries. American Journal of Public Health, 88(12): 1840-1843. https://doi.org/10.2105/AJPH.88.12.1840
[58] Giles-Corti, B., Wood, G., Pikora, T., Learnihan, V., Bulsara, M., Van Niel, K., Timperio, A., McCormack, G., Villanueva, K. (2011). School site and the potential to walk to school: The impact of street connectivity and traffic exposure in school neighborhoods. Health & Place, 17(2): 545-550. https://doi.org/10.1016/j.healthplace.2010.12.011
[59] Sha, D., Guo, Y.Y., Ding, Y. (2016). Pedestrian safety diagnosis at signalized crosswalks using traffic conflict techniques. In CICTP 2016, pp. 1811-1823. https://doi.org/10.1061/9780784479896.166
[60] Zhang, Y.Y., Yao, D.Y., Qiu, T.Z., Peng, L.H. (2011). Vehicle-pedestrian interaction analysis in mixed traffic condition. In ICTIS 2011: Multimodal Approach to Sustained Transportation System Development: Information, Technology, Implementation, pp. 552-559. https://doi.org/10.1061/41177(415)70
[61] Lubbe, N., Rosén, E. (2014). Pedestrian crossing situations: Quantification of comfort boundaries to guide intervention timing. Accident Analysis & Prevention, 71: 261-266. https://doi.org/10.1016/j.aap.2014.05.029
[62] Gruden, C., Otković, I.I., Šraml, M. (2022). Pedestrian safety at roundabouts: A comparison of the behavior in Italy and Slovenia. Transportation Research Procedia, 60: 528-535. https://doi.org/10.1016/j.trpro.2021.12.068
[63] Pin, C., Sayed, T., Zaki, M.H. (2015). Assessing safety improvements to pedestrian crossings using automated conflict analysis. Transportation Research Record, 2514(1): 58-67. https://doi.org/10.3141/2514-07
[64] Zhang, C.B., Zhou, B., Chen, G.J., Chen, F. (2017). Quantitative analysis of pedestrian safety at uncontrolled multi-lane mid-block crosswalks in China. Accident Analysis & Prevention, 108: 19-26. https://doi.org/10.1016/j.aap.2017.08.018
[65] Lartey, G.K., Price, J.H., Telljohann, S.K., Dake, J.A., Yingling, F. (2007). Primary grade teachers’ perceptions and practices regarding pedestrian safety education. Journal of School Health, 77(5): 265-272. https://doi.org/10.1111/j.1746-1561.2007.00202.x
[66] Duperrex, O., Bunn, F., Roberts, I. (2002). Safety education of pedestrians for injury prevention: A systematic review of randomised controlled trials. BMJ, 324(7346): 1129. https://doi.org/10.1136/bmj.324.7346.1129
[67] Lee, J.Y., Abdel-Aty, M., Huang, H.L., Cai, Q. (2019). Transportation safety planning approach for pedestrians: An integrated framework of modeling walking duration and pedestrian fatalities. Transportation Research Record, 2673(4): 898-906. https://doi.org/10.1177/0361198119837962
[68] Sze, N.N., Su, J.B., Bai, L. (2019). Exposure to pedestrian crash based on household survey data: Effect of trip purpose. Accident Analysis & Prevention, 128: 17-24. https://doi.org/10.1016/j.aap.2019.03.017
[69] Cheranchery, M.F., Bhattacharyya, K., Salih, M., Maitra, B. (2019). A proactive approach to assess safety level of urban bus stops. International Journal of Injury Control and Safety Promotion, 26(3): 260-270. https://doi.org/10.1080/17457300.2019.1626442
[70] Park, Y., Garcia, M. (2020). Pedestrian safety perception and urban street settings. International Journal of Sustainable Transportation, 14(11): 860-871. https://doi.org/10.1080/15568318.2019.1641577
[71] Bunn, F., Collier, T., Frost, C., Ker, K., Roberts, I., Wentz, R. (2003). Traffic calming for the prevention of road traffic injuries: Systematic review and meta-analysis. Injury Prevention, 9(3): 200. https://doi.org/10.1136/ip.9.3.200
[72] Rahman, I., Rahman, M.M., Ahmed, M. (2014). Safety sign, symbols and road markings of ‘planned residential areas with adjacent highways’ of Dhaka city: Focusing pedestrian safety. IOSR Journal of Mechanical and Civil Engineering (IOSR-JMCE), 11(2): 17-27.
[73] Murenzi, J.C. (2021). A needs assessment of the pedestrian safety-focused awareness campaigns, case study: Musanze-Rwanda. Master’s thesis, School of Transportation Sciences.
[74] Hamim, O.F., Hoque, M.S., McIlroy, R.C., Plant, K.L., Stanton, N.A. (2020). A sociotechnical approach to accident analysis in a low-income setting: Using accimaps to guide road safety recommendations in Bangladesh. Safety Science, 124: 104589. https://doi.org/10.1016/j.ssci.2019.104589
[75] Ulak, M.B., Kocatepe, A., Yazici, A., Ozguven, E.E., Kumar, A. (2021). A stop safety index to address pedestrian safety around bus stops. Safety Science, 133: 105017. https://doi.org/10.1016/j.ssci.2020.105017
[76] Craig, C.M., Morris, N.L., Van Houten, R., Mayou, D. (2019). Pedestrian safety and driver yielding near public transit stops. Transportation Research Record, 2673(1): 514-523. https://doi.org/10.1177/0361198118822313
[77] Phillips, R.O., Hagen, O.H., Berge, S.H. (2021). Bus stop design and traffic safety: An explorative analysis. Accident Analysis & Prevention, 153: 105917. https://doi.org/10.1016/j.aap.2020.105917