Rini Handayani![]() | Giva Andriana Mutiara*
| Giva Andriana Mutiara*![]() | Devie Ryana Suchendra
| Devie Ryana Suchendra![]()
© 2024 The authors. This article is published by IIETA and is licensed under the CC BY 4.0 license (http://creativecommons.org/licenses/by/4.0/).
OPEN ACCESS
The logistics sector is overburdened trying to keep up with the demand for package shipments due to the impact of the growth of online sales on various platforms that make it easier for people to shop. However, there are still a few manual parts involves measuring and calculating the cargo volume. This research proposes a solution with a three-dimensional package measurement approach based on the Ultrasonics HC-SR04 sensor, Arduino, and DC motor to make volume calculation easy, cheap, and automatic. Volume measurement is equipped with a moving arm mechanism from 3 axes simultaneously. The system's ability was tested using a variety of package shape measurement scenarios. According to the measurement results, it can measure package dimensions and volume with an overall success rate of 82.66%, a flat box-shaped package success rate of 93.35%, a cylindrical shape success rate of 96.65%, and an irregular shape success rate of 33.33%. According to the test findings, it can be concluded that this method is highly effective to contribute to calculating the volume of regular-shaped package objects. This is because over 90% of the package shapes received are regular-shaped. However, measuring irregular shapes requires more enhancement to achieve accurate results.
automation in logistic, cargo volume, digital measurement system, HCSR04, shifting ultrasonic sensors, three-dimensional, package measurement
The technological advancements in logistics, courier, and freight cargo transit have experienced significant growth since the COVID-19 pandemic. This growth is also caused by the appearance of digital online stores, MSMEs, and various online sales platforms that make it easier for customers to shop. Furthermore, the pandemic causes people to shop online in order to avoid crowds and gatherings in public places. Increasing consumer interest in online purchasing will undoubtedly lead to a rise in cargo shipments. Airlines and airports are recognizing air cargo's potential as a source of revenue [1]. The growing volume of cargo shipments is progressively straining logistics. The reason for this phenomenon might be attributed to the wide range of cargo shipments that are recorded based on their volume or weight.
However, the process of documenting and measuring these receipts and expenses continues to be performed manually, particularly when determining dimension’s volume. Officers need to regularly measure the package dimension’s volume by multiplying the length, width, height and then converting them into cargo’s volumes formulas. Consequently, an escalation in cargo shipments will produce more time-consuming in generating package documents. With the advancement of sensing technology, there is a requirement for an instrument to replace the manual volume calculation system in the cargo industry.
The existing options for assessing shapes without physical contact (non-contact devices) include laser sensors [2], infrared sensors [3, 4], and ultrasonic sensors [5]. Ultrasonic sensors offer a cost-effective and user-friendly solution for reducing production expenses. Ultrasonic sensors provide lower sensitivity to light interference compared to infrared and laser sensors, which are highly vulnerable to light sensitivity. Therefore, considering the above characteristics, ultrasonic sensors are quite powerful in determining physical characteristics that are very challenging in determining the dimension of a package or object in the logistic field [6].
Meanwhile, in a fixed state, the challenges associated with using an ultrasonic sensor for distance measurement include potential inaccuracies resulting from limited angle coverage and reflections, which can impact reliability [7]. This is in contrast to motion conditions, where it is possible to measure continuously [8]. Moving conditions could potentially provide more dependable distance measurements due to decreased interference [9].
This study aims to develop a device that utilize ultrasonic sensors and integrated stepper motors to determine the dimension of a 3-dimensional package in centimeter units. The device will provide real-time computing and measure the length, width, and height of the package. This research is expected to contribute a beneficial impact on the automated computation of package volume, enabling it to aid officers and expedite cargo paperwork.
The further sections of the paper are outlined below. Section two includes a comprehensive description of the methodology used in this research, including detail information about the theoretical and experimental procedures and materials. Section three provides a detail of the experimental system scenario, the outcome, and the discussion section. Next, section four presents the conclusion, significant findings and implications of the research.
This study will be organized in accordance with research and development techniques that are closely related to prototyping techniques. The research will begin with a review of the literature, followed by the design and architecture of the package dimension measurement prototype, and finally testing with various test scenarios. The study then analyzes and discusses the test results, before drawing conclusions.
2.1 Literature review
In order to determine the dimensions of an object, it is crucial to utilize a sensor with the ability to detect the object and subsequently measure its three-dimensional shape. As mentioned in the introduction, there are different types of sensors that are widely used by researchers to measure the shape object. However, ultrasonic sensors provide a solution in excellent precision, cost-effective, and easy to use [10, 11]. Ultrasonic sensors are very reliable in systems that require distance measurement or telemetry of an object. Ultrasonic sensors commonly utilized to detect and identify objects or obstacle when measuring distance, as shown in the context of autonomous mobile robots [12, 13] and smart canes developed for people with visual impairments [14].
In addition, ultrasonic sensors can be used to measure the water level in tanks [15]. This study utilizes ultrasonic sensors to monitor the water level in a water tank and calculate the volume of water. Ultrasonic sensors are used in the healthcare domain for the purpose of height measurement [16]. Furthermore, ultrasonic sensors are used not only to measure distance and detect objects, but also to determine shape [17, 18]. Likewise, ultrasonic sensors have been employed to determined shape and distance by utilizing triangle geometry computations for sensor placement [19], as well as employing stepper motors [20] to facilitate two-dimensional measurements [21]. Moreover, the integration of an array of ultrasonic sensors has been implemented to precisely detect and analyze the geometric characteristics of various objects [22].
The HC-SR04 Ultrasonic Sensor is utilized due to its simple operational mechanism as an object detection device, where it generates and detects sound waves [23]. Ultrasonic sensors operate by utilizing the fundamental principle of sound wave reflection to determine the distance of an object, applying a certain frequency [24]. The ultrasonic waves utilized possess a substantial frequency, ranging from 20 kHz to 20 MHz [23, 25, 26].
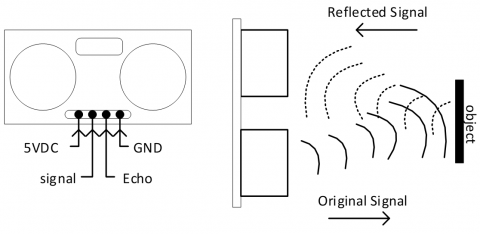
Ultrasonic sensors consist of two primary components: a transmitter and a receiver [27], as depicted in Figure 1. The sensor operates through a reflection mechanism, wherein an alternating voltage is delivered to the ultrasonic sensor transmitter, leading to generates of ultrasonic waves. Subsequently, the sensor releases the wave into the surrounding atmosphere, causing it to propagate in a forward direction.
If the ultrasonic wave encounters an object, it will reflect and then be detected by the receiver [28]. The wave that bounces back creates an oscillating electrical potential with the identical frequency. The period between the transmitter and receiver is computed to determine the distance [29]. Furthermore, the HC-SR04 ultrasonic sensor features has a measurement range that spans from 2 to 400 cm and consumes less than 1 watt of electricity [30].
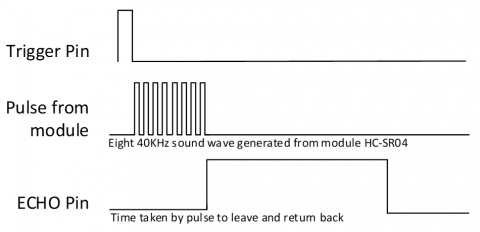
The timing diagram of the HC-SR04 ultrasonic sensor is depicted in Figure 2. The provided diagram illustrates that when the HCSR04 ultrasonic module is subjected to a trigger pulse, it emits ultrasound waves at a frequency of 40 kHz. frequency of 40 kHz will generate 8 ultrasonic pulses, resulting in a high state for the echo pin. The echo pin remains elevated until it no longer receives an echo signal. As a result, the width of the echo pin will be computed into the length of time-of-flight (ToF) required for the sound to travel to and from the object [5].
Figure 1. Ultrasonic HC-SR04 and working principle
Figure 2. Ultrasonic HC-SR04 timing diagram
After acquiring the time, the distance can be determined by calculating the speed of sound using Eq. (1). If the speed of the sound wave is 343 m/s, the total distance is divided in half due to the signal has to travel from the HC-SR04 to the object and then back to the HC-SR04 sensor, completing a round trip. The equation is formulated as shown in Eq. (2) [31]. Moreover, the velocity of sound is a parameter that is influenced by environmental elements such as temperature and humidity. Based on this particular circumstance, the distance can be precisely expressed as quantitative terms as specified in Eq. (3). A temperature fluctuation of around 50 degrees Celsius will result in a 3 mm variation in distance within a timeframe of 1000 microseconds. The sound speed equals 342.3 m/s at 200 degrees Celsius, sound distance taken is about 343.2 mm in 1000 microseconds.
distance = Speed $\times$ Time (1)
$Total\, Distance =\frac{343 \times { Time \,of \,High \,(Echo)\, Pulse }}{2}$ (2)
Distance = 331.2 + (Temperature $\times$ 0.6) (3)
The proposed system will perform computations to determine the volumetric value of an object. Typically, when an item or object is scheduled for delivery by land, sea, or air, it goes a weighed procedure. This stage involves the determination of an object's weight by considering either its actual weight in kilograms, its volumetric weight in kilograms, or its cubic volume in cubic centimeters.
The concept of actual weight refers to the procedure of determining the mass of objects using the metric unit of kilograms. Volumetric weight refers to the procedure of determining the weight of an object by measuring its length, width, and height, and applying the volume Eq. (4) derived from block volume computation. Eqs. (5)-(6) contain the corresponding formulae [32]. Eq. (5) represents a mathematical expression utilized to determine the weight of an object, specifically in the context of sea and land shipping. On the other hand, Eq. (6) serves as a mathematical formula employed to calculate the weight of an object, specifically in the domain of air shipping [33].
Volume (cm3) = Length $\times$ Width $\times$ Height (4)
${Volume}_{ {sealand }}({kg})=\frac{ { Volume }}{4000} \times 1 {kg}$ (5)
$Volume _{ {air }}({kg})=\frac{ { Volume }}{6000}$ (6)
Cubic volume calculations can be employed to measure the volume of an object. Cubic volume measurements are mostly utilized by individuals or organizations involved in the delivery of large quantities of commodities. The formula, which is represented by Eq. (4), is utilized as a substitution in Eq. (7).
$Volume \left({m}^3\right)=\frac{ { Volume }}{1.000 .000}$ (7)
The computation values for actual weight, volumetric weight, and cubic volume will be rounded up or down to the nearest whole number. The process of rounding is depended on the numerical value of the fraction following the decimal point. The process of rounding down is typically employed for fractions ranging from 0.0 up to 0.3, whilst rounding up is utilized for fractions exceeding the threshold greater than 0.3. Furthermore, the computation of cubic volume is applicable in cases where the dimensions of the object to be delivered exceed 18,000 cm3.
Meanwhile, the study about integrating the sensors with motors and microcontroller on a hardware level have been conducted by many researchers on the field of water level monitoring [7], smart parking system [34], robotics [8], micro aerial vehicles [35], security surveillances, automobile anti-collision system, and any other contactless measurements. Thus, based on this, the system will continue in the design process for the proposed system.
2.2 Design proposed system
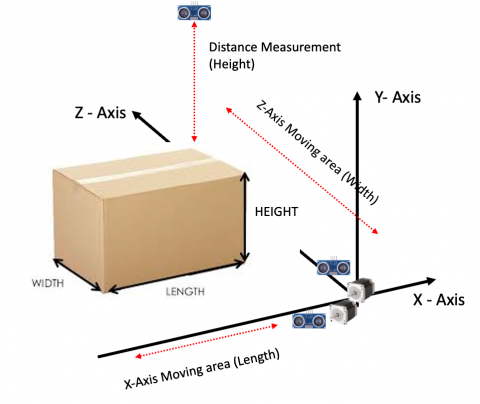
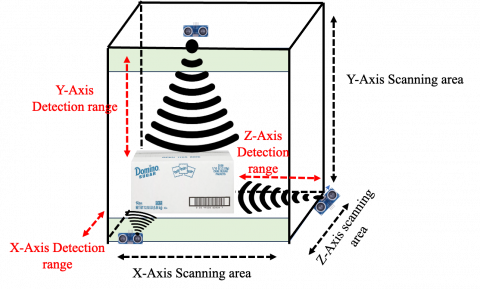
The proposed system will be designed based on the findings from the literature review. The proposed system design must meet the requirements shown in Figure 3. Figure 3 illustrates requirement for the system to accurately measure the object from various perspectives. The system is comprised of the x-axis, y-axis, and z-axis. The x-axis is utilized for quantifying the length of the object, the y-axis is employed for quantifying the height of the object, and the z-axis is utilized for quantifying the width of the object.
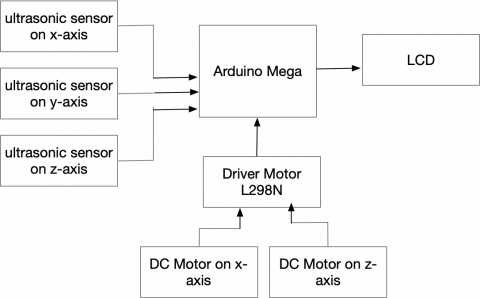
Figure 4 illustrates a configuration of three ultrasonic sensors that has been implemented to determine the measurements of an object's length, width, and height dimensions. During installation, the y-axis sensor does not equip with a DC motor. In order to facilitate the movement of the ultrasonic sensor along the x-axis and z-axis for measurement purposes, a configuration including the installation of two DC motors has been implemented.
The calculation of volume will eventually depend on the measurement results derived from Eqs. (5)-(7). In the field of logistics, the calculation of a package's volume, regardless of the form of packaging used, is ultimately based on the volume of a cuboid-shaped object [36]. The diagrammatic illustration of the motor's design for movement along the x and z axes is depicted in Figure 5.
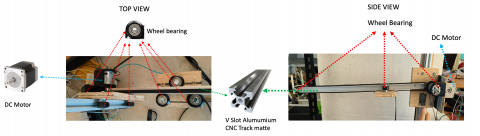
Each direct current (DC) motor is equipped with several wheel bearings, belts, and aluminum rails. These three parts, as shown in the architecture in Figure 5, aid in the motor's smooth operation when the ultrasonic sensor is mobilized for measurement. The system's construction can be observed from both a top-view and a side-view perspective.
Figure 3. The propose system
Figure 4. Diagram block of the proposed system
Figure 5. Motor tracking construction
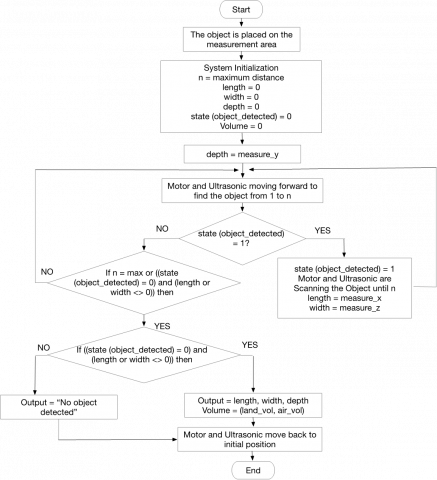
Figure 6. Flowchart of the proposed system
When the active button is pressed, the system is activated. In Figure 6, upon system activation, a series of parameters will be set to their initial value. An example of a parameter is labeled as 'n', which represents the maximum distance value in centimeters. In addition, the parameters for length (x), width (z), and height (y) are all set to zero. The design includes the state parameter, specifically the object_detected variable, which indicates the system's detection status of the object. Additionally, the volume parameter is included to compute the volume of the box.
The height (y) parameter is not linked to the DC motor; hence the ultrasonic sensor transmits a sound signal directly to the object within the measurement area. Based on the above information, the height (y) value, denoted as measure_y, can be determined by applying the Eq. (2) through Eq. (8).
H(y) = nmax - total distance from Sensor (y) (8)
A DC motor is used to enable movement along the axis when measuring the length (x) and width (z) properties in the computing process. The DC motors and ultrasonic sensors will be utilized to facilitate the movement and detection of objects along the specified track route. If the sensor detects an object within the specified measurement region, the state value "object_detected" will transition to 1. Consequently, the system will continue its scanning operation, reflecting the signal, until the state value "object_detected" returns to 0. This particular state indicates that the sensor is no longer capable of detecting objects, as there is no longer any signal reflection. In contrast, in cases where the sensor fails to detect the object, the motor will continue moving forward to the ‘nmax’ value, which represents the maximum allowable distance for measurement.
Therefore, if the measurement remains in the state where the object detected is equal to 0 up to nmax ((object detected) = 0 to nmax), the resulting measurements will indicate the lack of any detected object. If an object is found, the dimensions of length and width will be acquired using the method outlined in Eqs. (9) and (10), derived by substituting the parameters from Eq. (2) as described in Eq. (7).
L(x) = nmax - total distance from Sensor (x) (9)
W(z) = nmax - total distance from Sensor (z) (10)
Ultimately, the volume value will be determined through the computation of either Eq. (5), Eq. (6), or Eq. (7), depending on which formula yields the largest volume. Finally, the ultrasonic motor and sensor revert back to their initial position.
2.3 Experiments
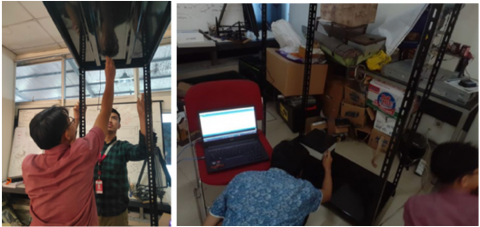
The experimental setup for evaluating the proposed system involved the installation of the system on a metallic shelf with dimensions of 100cm × 60cm × 200cm, as depicted in Figure 7. An ultrasonic sensor is installed on the ceiling of the shelf to measure the height of the object. In addition, two ultrasonic sensors, which are connected to DC motors, are placed along the rail to determine the length and width of the object. Subsequently, the measurement procedure will be conducted by arranging multiple objects, both with regular and irregular shapes, on the flat surface of the metal shelf. This test is conducted to determine how accurate the proposed system is in measuring the volume of various object shapes.
The measurement area was positioned at height of approximately 10 centimeters above the floor level. Next, the proposed method is evaluated through the process of measuring various shapes of objects. The object types measured in the experiment were a large object box, a small object box, a large cylindrical container, a small cylindrical container, and a half mannequin with an irregular shape.
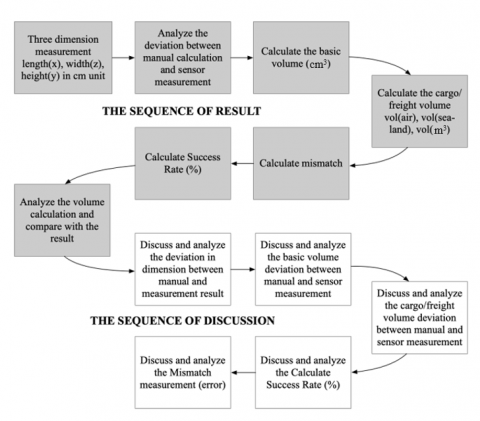
The measurement was performed by positioning packages of varying shapes at the coordinate point (0,0,0), which corresponds to the bottom corner of the metal shelf. Subsequently, in the results and discussion section, the experimental findings will be explained. Moreover, the subsequent part will present a comprehensive analysis of the experimental findings, elucidating each step in a sequential manner as depicted in Figure 8.
Figure 7. Testing scenario
Figure 8. Sequential steps as a guide for result and discussion
Before conducting the test, it is necessary to manually determine the dimensions of length, width, and height for all packages or objects that will be measured. This is needed as a measurement reference to assess accuracy. Subsequently, the volume should be calculated based on the chosen type of cargo, whether it is delivered by sea, air, or sea-land. During this procedure, the duration of the measurement process is manually determined till the process is finished.
Subsequently, the automated measurement test started following the experimental protocol and data collection procedure depicted in Figure 8. The test began by positioning the object at the coordinates (0,0,0) within the metal rack. In the meantime, the proposed system automatically measures the whole package. After the system determines the measurements of length, width, and height, it will proceed to calculate the volume of the object, considering all the computations related to the shipment type. After that, a comprehensive examination is conducted to compare the findings of the automated and manual system computations.
Furthermore, the analysis and discussion process will cover the overall test results, including an examination of potential calculation errors, the impact of any discrepancies on the final cost results, and the success rate calculation for the proposed system.
3.1 Result
According to the testing scenario described in the experiment section and the sequential steps in Figure 8. Table 1 represents the dimension testing results of the system on various shape form of the measured object. Based on the information provided in Table 1, the object column consists of a collection shape of measured objects, accompanied by their respective manual measurement dimensions. The column for sensor measurements represents the results of measurements, with the length dimension corresponding to the x-axis, the width dimension corresponding to the z-axis, and the height dimension corresponding to the y-axis. The deviation column, in this context, comprises the disparities seen between the sensor measurement results and the manual measurement results recorded in the object column, with respect to each axis.
According to the test results, the length dimension along the x-axis shows a variation difference of 1 cm to 2 cm for regular shapes and 1 cm to 3 cm for cylindrical containers. In irregular shapes, there is a significant difference of 10 cm to 12 cm. The test findings indicate that there are no substantial differences in the width dimension along the z-axis for standard box shapes. However, there is a discrepancy of 1 cm seen for cylindrical containers, and a range of 1-2 cm for irregular mannequin shapes. The range of the vertical axis, representing the height dimension, spans from 0 to 2 cm for all shapes.
Furthermore, the volume calculations, derived from the measurements shown in Table 1, are displayed in Table 2. Based on the information presented in Table 2, it can be observed that the object column is classified as a type of object whether it is regular or irregular shape with a certain size in cm.
The manual column is referred to computation of volume in various type of formulas. The column labeled vol (cm3) provides the calculated volume values for each shape, which is determined using the block volume calculation formula as stated in Eq. (4). The volume of the air column (vol (air) (kg)) is determined by the utilization of Eqs. (5) and (6) in order to calculate the volume of the sea-land column (vol (sea and land) (kg)). The value of volume in cubic units (m3) is obtained through the utilization of Eq. (7) in mathematical calculations.
Table 1. Dimension measurement result
|
Object (in cm) |
Sensor Measurement (in cm) |
Deviation (in cm) |
||||
|
L(x) |
W(z) |
H(y) |
L(x) |
W(z) |
H(y) |
|
|
Box 20×36×36 |
20 |
36 |
36 |
0 |
0 |
0 |
|
21 |
36 |
36 |
1 |
0 |
0 |
|
|
20 |
36 |
36 |
0 |
0 |
0 |
|
|
20 |
36 |
36 |
0 |
0 |
0 |
|
|
20 |
36 |
36 |
0 |
0 |
0 |
|
|
Box 20×44×32 |
21 |
44 |
31 |
1 |
0 |
1 |
|
21 |
44 |
31 |
1 |
0 |
1 |
|
|
21 |
44 |
31 |
1 |
0 |
1 |
|
|
22 |
44 |
31 |
2 |
0 |
1 |
|
|
22 |
44 |
31 |
2 |
0 |
1 |
|
|
Cylindric Container 20×20×20 |
17 |
21 |
18 |
3 |
1 |
2 |
|
19 |
21 |
19 |
1 |
1 |
1 |
|
|
19 |
21 |
19 |
1 |
1 |
1 |
|
|
19 |
21 |
19 |
1 |
1 |
1 |
|
|
19 |
21 |
19 |
1 |
1 |
1 |
|
|
Cylindric Container 15×15×15 |
16 |
14 |
16 |
1 |
1 |
1 |
|
16 |
15 |
16 |
1 |
0 |
1 |
|
|
15 |
15 |
16 |
0 |
0 |
1 |
|
|
16 |
14 |
15 |
1 |
1 |
0 |
|
|
17 |
14 |
16 |
2 |
1 |
1 |
|
|
Irregular 50×27×85 |
38 |
29 |
84 |
12 |
2 |
1 |
|
39 |
28 |
84 |
11 |
1 |
1 |
|
|
38 |
28 |
85 |
12 |
1 |
0 |
|
|
39 |
29 |
83 |
11 |
2 |
2 |
|
|
40 |
29 |
84 |
10 |
2 |
1 |
|
The units of volume measurement vary for various types of shipments. The metrics used for conventional cost calculations on shipments by air, land, and sea-land are cm3 and m3, while kg is used specifically for calculating cargo transport costs by air. The costs are determined by the package with the highest capacity multiplier result.
The sensor measurement column represents sensor scan findings recorded in relation to the object. Furthermore, the column labeled sensor measurement result represents the calculated values derived from the sensor measurements using the Eqs. (4)-(7). All volume estimations are rounded up from 0.3 measurements.
The remaining two columns, the mismatch and success rate columns are used to measure the level of error in the determined volume value compared to the manually computed result. The success rate is a quantitative measure that evaluates the efficiency of the proposed system in performing calculations and measurements. The formulation of the success rate performance is expressed by Eq. (11).
$S R P(\%)=\frac{n \, { trial }-nfail}{n \, { trial }} \times 100 \%$ (11)
SRP stands for successful rate performance represents the percentage of successful results. The variable "ntrial" represents the total number of trials conducted, whereas the variable "nfail" represents the count of unsuccessful or inaccurate computations performed during the test.
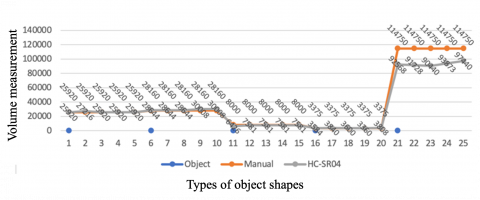
Figure 9 displays a comparative graph of the measurement results that have been converted into volume units (cm3). The graph depicts a comparison of manual volume computation and automatic volume calculation derived from the proposed system. The graph represents the result of comparing volume measurements conducted on five objects, as indicated in Table 2. Orange color represents the result of the volume calculation of each object manually, whereas the grey color reflects the automatically calculated volume of each object using the proposed system (sensor measurement).
In general, the graph displays a minor disparity in volume measurements, which is not particularly noteworthy when measuring regular object shapes. Unfortunately, the results on the measurement of irregular items' volume indicate a substantial disparity. Moreover, the contrast can be defined by the level of success attained by the proposed system.
The success rate obtained for rectangular box-shaped objects ranges from 86.7% to 100%. While the results of dimension and volume measurements of two different cylindrical objects in regular size and shape, show a higher level of accuracy than the measurement of rectangular box-shaped objects which is in the range of 93.3% to 100%. However, the measuring results for irregular items have demonstrated unsatisfactory performance, achieving a success rate of only 33.3%. This is because there are still some inconsistencies, especially on the x-axis measurement. Further discussion will be presented in the following sub-chapters during the discussion session.
Table 2. Volume measurement result
|
Object |
Vol (cm3) |
Manual |
Vol (cm3) |
Sensor Measurement |
Mismatch |
Success Rate (%) |
||||
|
Vol (Air) (kg) |
Vol (Sea and Land) (kg) |
Vol Cubic (m3) |
Vol (Air) (kg) |
Vol (Sea and Land) (kg) |
Vol Cubic (m3) |
|||||
|
Box 20×36×36 |
25920 |
5 |
7 |
1 |
25920 |
5 |
7 |
1 |
0 |
100 |
|
27216 |
5 |
7 |
1 |
0 |
||||||
|
25920 |
5 |
7 |
1 |
0 |
||||||
|
25920 |
5 |
7 |
1 |
0 |
||||||
|
25920 |
5 |
7 |
1 |
0 |
||||||
|
Box 20×44×32 |
28160 |
5 |
7 |
1 |
28644 |
5 |
7 |
1 |
0 |
86,7 |
|
28644 |
5 |
7 |
1 |
0 |
||||||
|
28644 |
5 |
7 |
1 |
0 |
||||||
|
30008 |
5 |
8 |
1 |
1 |
||||||
|
30008 |
5 |
8 |
1 |
1 |
||||||
|
Cylindrical container 20×20×20 |
8000 |
2 |
2 |
1 |
6426 |
1 |
2 |
1 |
1 |
93,3 |
|
7581 |
2 |
2 |
1 |
0 |
||||||
|
7581 |
2 |
2 |
1 |
0 |
||||||
|
7581 |
2 |
2 |
1 |
0 |
||||||
|
7581 |
2 |
2 |
1 |
0 |
||||||
|
Cylindrical container 15×15×15 |
3375 |
1 |
1 |
1 |
3584 |
1 |
1 |
1 |
0 |
100 |
|
3840 |
1 |
1 |
1 |
0 |
||||||
|
3600 |
1 |
1 |
1 |
0 |
||||||
|
3360 |
1 |
1 |
1 |
0 |
||||||
|
3808 |
1 |
1 |
1 |
0 |
||||||
|
Irregular shapes 50×27×85 |
114750 |
19 |
29 |
1 |
92568 |
16 |
23 |
1 |
1 |
33,3 |
|
91728 |
16 |
23 |
1 |
1 |
||||||
|
90440 |
15 |
23 |
1 |
1 |
||||||
|
93873 |
16 |
24 |
1 |
1 |
||||||
|
97440 |
16 |
25 |
1 |
1 |
||||||
Figure 9. Volume measurement comparison result
3.2 Discussion
This research presents an innovative strategy for the automated quantification of package dimensions, with the aims of streamlining the dimension measurement and volume calculation procedures. Specifically, it determines the length along the x-axis, the height along the y-axis, and the width along the z-axis. The utilization of two DC motors facilitates the movement of the ultrasonic sensor along the x-axis and z-axis, enabling the measurement of the length and width of the package. Meanwhile, the ultrasonic sensor positioned on the y-axis remains stationary at a fixed height of 2 meters, allowing for the measurement of the package's height. A series of experiments were carried out on a sample of five packages, which included both regular and irregular shapes.
The test findings showed that the difference between the measurements on the x-axis and the manually measured package length was greater compared to the measurements obtained from the y-axis and z-axis, which also measure the package dimensions. This is because the scanning area along the x-axis is wider and longer than the scanning area along the static y-axis and z-axis, which shows a shorter scanning area, as shown in Figure 10. Therefore, the ability of the ultrasonic sensor to determine the distance of an object along the x-axis results in the reflection area becoming increasingly narrowed. The Ultrasonic sensor will keep measuring until it detects the boundary of the last reflected object.
Figure 10. Detection and scanning area of measurement
Similarly, an ultrasonic sensor positioned along the z-axis will take measurements within the scanning area, up to the boundary of the final reflected packet. Nevertheless, this will lead to a significantly wider and more precise reflection in contrast to the measurement gained along the x-axis. Regarding the y-axis context, the sensor's scanning region demonstrates substantial width due to its wide detection range, which enables static measurements without requiring a DC motor. Installing the sensor at this specific place along the y-axis ensures that it can effectively detect and identify reflections from the whole surface of the objects.
Furthermore, after the findings of the three-dimensional package measurement have been obtained, the subsequent task is to compute the volume of the package. This is because the package shipment cost calculation is determined by the package's volume, which is measured in cm3 or kg metrics which is calculated proportional to the results of the volume calculation.
The package volume is determined using the volume formula for a block shape, as outlined in Eqs. (4)-(7) in the field of logistics. Therefore, all measurements of objects with regular geometry, such as cylinders, and irregular shapes, such as half-mannequins, are determined using the box volume calculation equation. Subsequently, volume measurements are determined using the results of previously obtained dimensional measurements. The package volume calculation results are rounded using a rounding-up threshold of fractions equal to or greater than 0.3.
The volume numbers in the column labeled "vol (cm3)" in Table 2 are derived using Eq. (4). At this level, the results obtained correspond to the basic calculation of the block volume. In this case study, the gap between the manual volume value and the measured volume was quite significant. Specifically, the difference between the manual measurement volume and the proposed system measurement volume ranged from 6.5% for the normal box shape, 19% for the regular cylindrical shape, and 21% for the irregular half mannequin shape. However, this is not a cause for concern because logistics volume estimates differ from regular block volume calculations. The results of these volume calculations provide the fundamentals for shipment volume calculations, which are expressed in Eqs. (5)-(7), depending on the specific shipping type. Finally, the results in Table 2 have been rounded to achieve the final volumes. This final volume is obtained by multiplying the cost charged to the cargo. These volumes are divided into air shipments, sea and land shipments, and cubic volumes measured in m3.
Furthermore, Table 2 displays the mismatch column, which indicates the count of volume calculation values that differ from the volume calculation results obtained from manual calculations. It is crucial to include this factor when calculating the success rate performance of the proposed system, as it has a substantial impact on the computation of the expenses incurred by shipping. The differences mostly occur in the computation of volumes for air freight, as well as sea and land transportation. Based on the 20 experiments conducted on regular shapes, there were three instances of erroneous volume estimations. Specifically, one error was related to air volume, while the remaining two were related to sea and land volume calculations. The calculations for volume in cubic (m3) units are identical to manual computations.
On the other hand, based on five experiments for irregular objects, all volume calculations for air cargo, as well as sea and land experienced inaccurate calculations. While for volume calculations in vol cubic (m3) units, as with regular objects, all calculations were correctly calculated.
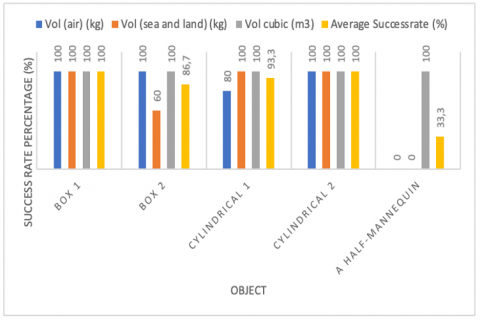
Figure 11. Success rate percentages comparison
Based on the data presented in Figure 11, it can be observed that the average success rate of the proposed system for determining the final volume compared to the manual calculation results is 82.66%. The average success rate for regular box shapes with flat surfaces, including box 1 and box 2, was 93.35% for all final volume values. The average value for regular cylindrical shapes, specifically cylinder 1 and cylinder 2, was determined to be 96.65% based on all volume measurements. The success rate for irregular shapes, especially half mannequins, remained constant at 33.33%. Utilizing the method of approximating the ultimate volume of the package, particularly when dealing with fractions of 0.3, provides benefits in reducing measurement inconsistencies.
The resulting processing time for officers in carrying out the process of calculating package dimensions by measuring the volume of a package manually is 65 seconds, depending on the size of the package to be measured. In the proposed system, the average duration for the package measuring process is 1 minute and 29 seconds. Therefore, there is an approximate difference of 24 seconds. From a processing time perspective, the proposed system does not reduce the processing time. However, this may not be an important problem as the system does have the potential to reduce the workload on officers when calculating package measurements.
According to the test results provided, the shifting ultrasonic sensor method is highly effective in accurately measuring the dimensions of a regularly shaped package with a flat surface. It achieves a success rate of up to 100%. Several studies have stated that using ultrasonic sensors in moving conditions is considered capable of measuring an object close to its actual size. In addition, inaccuracies caused by echo patterns can be reduced [35]. The implementation of the HC-SR04 ultrasonic sensor can potentially improve the process of automating the measurement of package dimensions and volume. However, the efficiency of the proposed technique diminishes when utilized for packages with irregular forms and non-planar surfaces. The challenge in interpreting the dimensions of irregular shapes and non-flat surfaces with shifting HC-SR04 ultrasonic sensors derives from the complexity associated with the non-flat nature of the shapes. The shifting ability of the HC-SR04 ultrasonic sensor to accurately measure package dimensions cannot be compromised when scanning irregular surfaces in motion due to signal reflections. Hence, further studies are required to handle dimensional measurements with non-flat surfaces and irregular shapes.
The present study utilizes the HC-SR04 ultrasonic sensor as a methodology for quantifying the dimension of a package. The system is stored in a metallic enclosure of 100 cm in length, 60 cm in width, and 200 cm in height. The system is built with three HC-SR04 ultrasonic sensors, two DC motors, an L298N motor driver installed on the side of the three-dimensional measurement package, and axes for the x-axis (length), y-axis (height), and z-axis (width). The static measurement is exclusively utilized along the y-axis, which represents height. The utilization of the x-axis and y-axis is commonly observed in the context of dynamic measurement. The system conducted comprehensive testing under several scenarios to evaluate its performance in accurately measuring dimension and calculate volume packages. The experimental procedure involved measuring the dimensions of the packaging, subsequently by calculating its volume, and then comparing these results with manually measurements. The packaging options used included regular-shaped package, such as boxes and cylinders with flat surfaces, as well as packaging with irregular shapes.
According to the measurement data, the system showed an average success rate of 82.66% in accurately measuring the dimensions and volume of packages across all types. Despite its advantages, the technique still has limitations when it comes to accurately characterizing containers with irregular shapes. Additional improvements are needed in the process of ensuring the measurement of packages with irregular shapes.
However, this proposed system can be utilized to assist and facilitate officers in identifying the dimensions and packaging of objects, for cargo shipments that are packaged in regular shapes. From the perspective of the processing time to measure dimensions, it has not significantly improved processing time, but at least it can reduce the workload on officers while performing calculations.
To enhance the system's capability to handle dimensional measurements of irregular shapes in future work, it is recommended to integrate computer vision with the proposed system to determine the object's dimensions. Additionally, it's possible to include various types of filters or artificial intelligence systems. This modification can enhance the functionality of the HC-SR04 sensor by enabling precise measurement of the dimensions of packages with irregular shapes. In addition, it is feasible to substitute supplementary sensors, such as employing a lidar or Kinect sensor. In addition, this technology also has the potential to be integrated with automatic weighing systems.
We would like to express our appreciation to Directorate of Research and Community Service (PPM) Telkom University for funding the research with a partnership research scheme, to Embedded and Network System Research Group Laboratory, and to the Center of Excellence Sustainable Technology of Applied Science (STAS-RG) laboratory of Telkom University, Bandung, Indonesia for supporting this research.
[1] Van Asch, T., Dewulf, W., Kupfer, F., Meersman, H., Onghena, E., Van de Voorde, E. (2019). Air cargo and airport competitiveness. Journal of Air Transport Studies, 10(2): 48-75. https://doi.org/10.38008/jats.v10i2.142
[2] Suh, Y.S. (2019). Laser sensors for displacement, distance and position. Sensors, 19(8): 1924. https://doi.org/10.3390/s19081924
[3] Daud, S.A., Mohd Sobani, S.S., Ramiee, M.H., Mahmood, N.H., Leow, P.L., Che Harun, F.K. (2013). Application of infrared sensor for shape detection. In 2013 IEEE 4th International Conference on Photonics (ICP), Melaka, Malaysia, pp. 145-147. https://doi.org/10.1109/ICP.2013.6687095
[4] Sari, M., Sularsa, A., Handayani, R., Alamsyah, S., Rizaldi, S. (2023). 3D scanner using infrared for small object. JOIV: International Journal on Informatics Visualization, 7(3): 935-940. http://doi.org/10.30630/joiv.7.3.2050
[5] Aliew, F. (2022). An approach for precise distance measuring using ultrasonic sensors. Engineering Proceedings, 24(1): 8. https://doi.org/10.3390/IECMA2022-12901
[6] Ohtani, K., Baba, M. (2012). Shape recognition and position measurement of an object using an ultrasonic sensor array. In: Yang, W.Q. (ed) Sensor Array. InTech. https://doi.org/10.5772/36115
[7] Subekti, A., Cahyono, B.E., Misto, M., Nugroho, A.T. (2022). Static characteristics analysis of ultrasonic sensor HC-SR 04 and its application to water level monitoring based on Arduino Uno. AIP Conference Proceedings, 2663(1): 060006. https://doi.org/10.1063/5.0108043
[8] Szlachetko, B., Lower, M. (2020). Reliability of ultrasonic distance measurement in application to multi-rotor MAVs. In International Conference on Dependability and Complex Systems, pp. 642-651. https://doi.org/10.1007/978-3-030-48256-5_63
[9] Henning, B., Schröder, A. (2011). Ultrasonic distance sensors-An overview and trends. Journal of Electronic Measurement and Instrument, 25(7): 577-581.
[10] Soni, A., Aman, A. (2018). Distance measurement of an object by using ultrasonic sensors with Arduino and GSM module. International Journal of Science Technology & Engineering, 4(11): 23-28.
[11] Sze, E., Hindarto, D., Wirayasa, I.K.A., Haryono, H. (2022). Performance comparison of ultrasonic sensor accuracy in measuring distance. Sinkron: Jurnal Dan Penelitian Teknik Informatika, 6(4): 2556-2562. https://doi.org/10.33395/sinkron.v7i4.11883
[12] Gangawane, M., Awate, R., Suryawanshi, R., Joshi, R. (2016). Obstacle detection and object size measurement for autonomous mobile robot using sensor. International Research Journal of Engineering and Technology, 3(5): 3105-3108.
[13] Ishihara, M., Shiina, M., Suzuki, S.N. (2009). Evaluation of method of measuring distance between object and walls using ultrasonic sensors. Journal of Asian Electric Vehicles, 7(1): 1207-1211. https://doi.org/10.4130/jaev.7.1207
[14] Mutiara, G.A., Hapsari, G.I., Rijalul, R. (2016). Smart guide extension for blind cane. In 2016 4th International Conference on Information and Communication Technology (ICoICT), Bandung, Indonesia, pp. 1-6. https://doi.org/10.1109/ICoICT.2016.7571896
[15] Suryana, A., Paikun, Yudono, M.A.S. (2022). Fluid volume detector on a horizontal tube using an ultrasonic-based water level sensor. Fidelity, 4(1): 6-10. https://doi.org/10.52005/fidelity.v4i1.80
[16] Ulyanida, S., Supriyanto, A., Suciyati, S.W., Junaidi, J. (2022). Automatization of weight and height measurement using ultrasonic sensors HC-SR04 and load cell based on Arduino UNO at integrated services posts (Posyandu). Journal of Energy, Material, and Instrumentation Technology, 3(4): 127-137. https://doi.org/10.23960/jemit.v3i4.103
[17] Masoudi, H. (2022). Mass and volume determination of orange fruit using ultrasonic sensors. Journal of Agricultural Machinery, 13(1): 55-66. https://doi.org/10.22067/jam.2022.76674.1106
[18] Barua, S., Saha, A., Khan, A.A.S., Chowdhury, R.H. (2019). Comparative study of object shape recognition using ultrasonic sensor arrays with artificial neural network. In 2019 2nd International Conference on Innovation in Engineering and Technology (ICIET), Dhaka, Bangladesh, pp. 1-6. https://doi.org/10.1109/ICIET48527.2019.9290607
[19] Kusumadjati, A., Napitupulu, J.Y., Setiawan, R., Samosir, A.I., Cengiz, K. (2023). Ultrasonic sensor system for detection of the objects position in two-dimensional plane. International Journal of Applied Mathematics, Sciences, and Technology for National Defense, 1(1): 7-12. https://doi.org/10.58524/app.sci.def.v1i1.168
[20] Zhai, C.Y., Zhao, C.J., Wang, X., Wang, N., Zou, W., Li, W. (2015). Two-dimensional automatic measurement for nozzle flow distribution using improved ultrasonic sensor. Sensors, 15(10): 26353-26367. https://doi.org/10.3390/s151026353
[21] Dam, R.R., Biswas, H., Barman, S., Ahmed, A.Q. (2016). Determining 2D shape of object using ultrasonic sensor. In 2016 3rd International Conference on Electrical Engineering and Information Communication Technology (ICEEICT), Dhaka, Bangladesh, pp. 1-5. https://doi.org/10.1109/CEEICT.2016.7873143
[22] Batsaikhan, M., Zhang, Z., Takahashi, H., Kikura, H. (2021). Development of measurement system for flow and shape using array ultrasonic sensors. Journal of Flow Control, Measurement & Visualization, 9(3): 45-72. https://doi.org/10.4236/jfcmv.2021.93004
[23] Loveday, P. (2021). High frequency guided wave ultrasound measurements using low-cost equipment. In MATEC Web of Conferences, 347: 00010. https://doi.org/10.1051/matecconf/202134700010
[24] Eden, J.G., Telan, E.C., Pancho, J.K., Bongolan, R.R.S. (2019). Ultrasonic distance measuring device study. https://doi.org/10.13140/RG.2.2.22528.17928/2
[25] Darwito, P.A., Raditya, M., Sa’diyah, H., Cikadiarta, A., Aditya, W. (2019). Comparative study of burst and beams types ultrasonic sensor for distance measurements. In 2019 International Seminar on Intelligent Technology and Its Applications (ISITIA), Surabaya, Indonesia, pp. 46-51. https://doi.org/10.1109/ISITIA.2019.8937133
[26] Setiawan, F.B., Prasetyo, D.D., Pratomo, L.H. (2023). Design of audiosonic frequency wave therapy tool with Arduino mega-based spectrum analyzer monitoring. PROtek: Jurnal Ilmiah Teknik Elektro, 10(1): 33-38. https://doi.org/10.33387/protk.v10i1.5536
[27] Karthik, M., Sudharshan, K., Subramani, D., Nivethitha, S. (2018). Design and development of self-governing robotic cart for universal applications. International Journal of Engineering and Applied Sciences, 5(1): 32-35.
[28] Setiawan, H., Ma'arif, A., Marhoon, H.M., Sharkawy, A. N., Çakan, A. (2023). Distance estimation on ultrasonic sensor using kalman filter. Buletin Ilmiah Sarjana Teknik Elektro, 5(2): 210-217. https://doi.org/10.12928/biste.v5i2.8089
[29] Biswas, A., Abedin, S., Kabir, M.A. (2020). Moving object detection using ultrasonic radar with proper distance, direction, and object shape analysis. Journal of Information Systems Engineering and Business Intelligence, 6(2): 99-111. https://doi.org/10.20473/jisebi.6.2.99-111
[30] Cenkeramaddi, L.R., Bhatia, J., Jha, A., Vishkarma, S. K., Soumya, J. (2020). A survey on sensors for autonomous systems. In 2020 15th IEEE Conference on Industrial Electronics and Applications (ICIEA), Kristiansand, Norway, pp. 1182-1187. https://doi.org/10.1109/ICIEA48937.2020.9248282
[31] Noor, F., Swaied, M., AlMesned, M., AlMuzini, N. (2018). A method to detect object's width with ultrasonic sensor. In 2018 International Conference on Computing, Electronics & Communications Engineering (iCCECE), Southend, UK, pp. 266-271. https://doi.org/10.1109/iCCECOME.2018.8658900
[32] Johannes, B. (2012). Air Cargo Revenue Management. https://pure.uvt.nl/ws/portalfiles/portal/29379793/Air_Cargo_Revenue_Management.pdf.
[33] Wang, T., Hu, Q., Lim, A. (2022). An exact algorithm for two-dimensional vector packing problem with volumetric weight and general costs. European Journal of Operational Research, 300(1): 20-34. https://doi.org/10.1016/j.ejor.2021.10.011
[34] Andriana, G.M., Agung, A.A.G., Handayani, R. (2018). Implementation of smart parking system with real time monitoring. Far East Journal of Electronics and Communications, 18(2): 277-290. https://doi.org/10.17654/EC018020277
[35] Alphaeus, O., Audu Ngyarmunta, A., Monday Fredrick, O. (2022). Development and realization of an ultrasonic ranging detection and tracking device. American Journal of Modern Physics, 11(2): 22-31. https://doi.org/10.11648/j.ajmp.20221102.12
[36] Chuan, W.K. (2020). Calculation of Air Freight. https://asean.org/wp-content/uploads/2023/02/Air-Freight-C5.-Calculation-of-Air-Freight-PPT-Trainer-V2.pdf.