Maen Q. Ghadi![]()
© 2023 IIETA. This article is published by IIETA and is licensed under the CC BY 4.0 license (http://creativecommons.org/licenses/by/4.0/).
OPEN ACCESS
This work attempts to develop a universal model for predicting micro-and macro-level accident frequency. The study implies that the number of accidents may vary depending on the type of roadway and the characteristics of its small segments, both at the group and individual levels. A multilevel model has been designed to address the nested link between individual road segments and multiple road classifications. The multilevel analysis allows one to investigate the hierarchical nature of road accident parameters at the micro and macro levels to comprehend the risk of specific road segments within distinct roadway categories. To accomplish this, a case study of fifty-seven roads has been selected, covering five main categories: motorway, expressway, primary arterial, secondary main roads, and minor roads. In addition, each roadway has been subdivided into several flexible-length segments, each of which is identified by its traffic and geometrical characteristics. The outcome confirms that the accident frequency per road segment is more likely to vary between roads with distinct categories. Moreover, road types with low design requirements are more hazardous than well-designed roads, even with lower speed restrictions and traffic numbers.
accident prediction, multilevel analysis, hierarchical structure, road category, mixed model, road segment
Each year, road accidents result in high economic and social costs for nations, families, and individuals [1]. Experts in road safety have recently made determining the causes of road accidents a priority to reduce accident risk. Depending on the purpose of the study, models for forecasting accident frequency may incorporate numerous variables. According to numerous sources, various causes contribute to road accidents [2-5]. Guerrero-Barbosa et al. [6, 7] studied the influence of factors related to roadway geometry, traffic volumes, and speeds on accident frequency on an urban road network and people responses to speed limits. Marcianò and Vitetta [8] examined the effect of changing traffic parameters on pedestrian accidents. Joly et al. [9] investigated the influence of geographical and socio-ecological variations on pedestrian and cyclist accidents in different zones.
The accuracy of accident prediction models is based on extracting patterns from similar or historical accident data. In the past, the concept of prototypical accident scenario has been used [10]. In this method an in-depth investigation is made in order to extract a chain of facts and causal relationships from a series of accidents data and diagrams [11] in different stages. The modern science applies more accurate statistical models for studying accident-related parameters. The parameters may include environmental or traffic elements. These elements may include abnormal events. For example, the period of Covid-19 cited a significant effect not only on transportation sectors but on economy and life of all countries [12, 13].
The existing studies have also examined the precision of accident prediction models. Hauer et al. [14] studied the practical applications of the Empirical Bayesian method. In his methodology the expected number of accidents is calculated by combining the accident records of the entity and the accident frequency expected at similar entities by a weight factor. The author claimed that the precision of road accidents' estimation can be enhanced when the accident record is sparse and the regression to mean bias is eliminated. The benefit of the Empirical Bayesian method has also improved by the studies [15, 16]. In their paper they have examined the performance of different accident prediction models developed from network segmentation methods on Hungarian expressways.
Road safety analysis may include data on different levels of aggregation [17, 18]. Russo and Vitetta [18] defined two structural levels of road safety data, aggregated and disaggregated data. The aggregated level is focusing almost on spatial data of a large geographical areas (urban area, central business district, etc.) and apply a macroscopic analysis for predicting accident occurrence. In contrast, the disaggregated level concerns small infrastructural elements (road segment, junction, parking area, etc.) and uses a set of micro-level variables (incident, driver, etc.) to estimate accident severity or frequency. Generally, existing research has examined traffic safety independently at either the micro or macro level.
At the microlevel, road accident analysis included detailed factors related to one or a small group of accidents, such as, geometric road features [19, 20], traffic characteristics [21], or weather and environmental conditions [22, 23]. Most of these studies have been performed for small spots or road segments. In contrast, the macro-level applied factors related to a large group of accidents at an area or regional level, such as road category [24], urban planning including population and building density [25], or vehicle mile-travel [26]. However, the selection of a suitable analysis level depends on the purpose of the study and the type of available data.
On the other hand, accident prediction models in every literature were limited to a specific road category or intersection. Castro et al. [27] applied a latent variable generalized ordered response framework for modeling accident count at urban intersections. The results revealed some critical unobserved components influencing accident propensity at intersections, including roadway configuration, approach roadway functional type, and total daily entering traffic volume. Persaud and Mucsi [28] used the hourly traffic volumes in a regression model for estimating accident potential on two-lane rural roads. Persaud and Dzbik [29] developed a generalized linear model to study the change in accident frequency and severity on the freeway. Most of these studies were limited and dedicated to a specific road type or intersection. Differences in the characteristics of different roads make it difficult to construct a uniform model for all road categories. Ghadi and Török [30] compared the performance of some black spot identification methods between highway and secondary roads. They discovered that the performance of the applied approaches could be significantly affected by the broad category and the speed factor. Gururaj et al. [31] used un-supervised machine learning algorithms for predicting the injury severity of traffic accidents. However, failing to account for the hierarchical structure of accident data might lead to underestimating accident prediction model parameters.
Multilevel models are specifically geared to analyze data with a hierarchical or cluster structure [32]. The multilevel analysis includes modeling the relationship between different groups of accidents by identifying a hierarchical system of data that takes advantage of the clustered dataset. This means that the model's outcome is affected by a nested relationship between individual accidents' lower-level characteristics (level one) and higher-level group characteristics (level two). Lenguerrand et al. [33] investigated the advantages of applying a multilevel logistic model to analyze the hierarchical structure of accident data for vehicle occupants compared to a traditional generalized estimating equation and logistic models. They found that the multilevel analysis provides a more efficient model than the traditional models. Haghighi et al. [20] explored the nested relationship between individual crash characteristics and environmental and roadway features. They applied a multilevel ordinal logistic regression to analyze the hierarchical structure of accident data and its impact on accident severity outcome. Few literatures investigated the influence of multilevel analysis on accident counts. Cai et al. [34] developed a Bayesian integrated spatial model to analyze accident frequency at the macro-and micro-levels between district and road entities (i.e., segments and intersections) simultaneously. The results indicated that the model could simultaneously identify both micro-and macro-level factors contributing to the accident occurrence and with higher performance.
A road accident is generally an unforeseen occurrence that might occur on different roadways under different conditions. A given road segment's environmental and geometrical parameters significantly influence the density of accidents per segment length. Typically, these accident risk data of individual road segments are grouped within groupings (e.g., roadways with different categories). Due to the hierarchical nature of these data structures, similarities in accident risk across road segments (i.e., individuals) of consecutive highways (i.e., groups) may exist. They must be accounted for in the analysis. The multilevel analysis presents an opportunity to study the hierarchical nature of road accident properties, attempting to understand the risk of individual road segments within a group context. For example, on the one hand, small roadway segments may vary in some parameters, such as traffic characteristics (i.e., traffic volume, speed limit, truck volume) and geometric features (i.e., roadside hazard, median type, curves, surface condition). From another hand, accident frequency can be counted from group characteristics that might be aggregated from lower-level characteristics, such as category or level of service, including road design standard, average speed limit, and the average annual daily traffic (AADT).
No study has, to our knowledge, examined the variation of road accident risks for different road categories using a single micro-and macro-level model. This study believed every road could be subdivided into smaller portions with distinct environmental and geometric design characteristics. The nested link between roadways of various categories and their short segments is utilized to develop a multilevel model capable of predicting accident counts at a road segment for every road category in the case study.
This study analyzed a range of accident occurrences on five distinct road types. Fifty-seven routes have been selected from the Hungarian road map, divided into five categories: Motorways, Expressways, Arterial (primary main roads), Secondary main roads, and Local roads. The Hungarian standards define the highway as a two-lane road in each direction, with an emergency lane and a speed restriction of 130 kilometres per hour. The expressway has two lanes in each direction but no emergency lanes and a speed restriction of around 110 kilometres per hour. Both expressways and motorways can alternatively be considered highways. The arterial route is similar to the expressway regarding the number of lanes and speed limits but with lower requirements. The primary, secondary roadway is classified as a state highway. The final road is a local or secondary access route.
The dataset covered five broad categories with a total of 5074 km in length and 6025 accidents that covered three study years (2013-2015). The data included accident information (i.e., geographical location, date, severity, involved vehicles), road characteristics (category, number of lanes, residential presence), and traffic characteristics (i.e., traffic volume, speed limits, truck volume). Additional roadway characteristics (i.e., horizontal curves, lane characteristics, and roadside hazards) have been identified with the help of ArcGIS software and Google Earth. The analysis has only considered data from homogeneous road segments without intersections.
The primary focus of this study was on examining the impact of the nested relationship between various road categories and road segments with different environmental characteristics (i.e., roadway geometric and traffic characteristics) on accident frequency. To determine the effect of the difference in road type on accident frequency, each road has been divided into smaller homogeneous segments with distinguished environmental characteristics. The segmentation process included factors distinguished by the AADT, speed limit, roadside hazard, and horizontal curves, as recommended by the Highway Safety Manual (HSM) specifications [35]. Table 1 presents the descriptive statistics of the resulting segmentation process for each road category.
The segmentation process has resulted in 1590 segments for all roads, each of which has different environmental characteristics. Considering the parameters of Table 1, it can be noted that each road category has distinguished characteristics. On average, motorways recorded the highest average speed limit above the hundreds (i.e., 122 km/hour), reaching 130 km/hour for some segments. In contrast, the average speed limit decreases as it shifts to the right-hand roads (in Table 1), reaching the local road. Similarly, AADT, truck volume, horizontal curves, and residential presence increase by moving from the highest speed limit road (motorway) to the lowest speed-limit road (local road). In general, according to Table 1, the segments of the motorway and expressway show some convergence in their average data sets. In contrast, the arterial, secondary, and local roads show another convergence. However, this study examines the effect of various environmental and geometrical features for each road category on accident frequency, considering the environmental changes of road segments in which accidents occur.
Table 1. Descriptive statistics of the resulted segments per road category
|
Parameters description |
Motorway |
Expressway |
Arterial |
Secondary |
Local |
||
|
Number of roads |
5 |
6 |
8 |
23 |
18 |
||
|
Total lengths (km) |
993 |
236 |
1608 |
1796 |
441 |
||
|
Total accidents (2013-2015) |
1068 |
189 |
2257 |
1980 |
531 |
||
|
Road segment |
Min length (km) |
0.78 |
0.4 |
0.32 |
0.42 |
0.45 |
|
|
Max length (km) |
17.29 |
8.8 |
14.91 |
15.53 |
11.83 |
||
|
Average length (km) |
6.45 |
4.07 |
3.54 |
2.34 |
2.81 |
||
|
Standard deviation |
3.28 |
1.78 |
2.52 |
1.49 |
1.91 |
||
|
Number of segments |
154 |
58 |
454 |
767 |
157 |
||
|
Observed accidents (per year) |
Min |
0 |
0 |
0 |
0 |
0 |
|
|
Max |
13 |
7 |
8 |
7 |
10 |
||
|
Mean |
2.31 |
1.08 |
1.65 |
0.86 |
1.12 |
||
|
Standard deviation |
2.46 |
1.40 |
1.49 |
0.96 |
1.52 |
||
|
AADT |
Min |
1388 |
3304 |
836 |
827 |
164 |
|
|
Max |
107962 |
105023 |
34768 |
56176 |
17134 |
||
|
Mean |
33291 |
34150 |
10029 |
6678 |
3865 |
||
|
Standard deviation |
21765 |
30074 |
6299 |
4878 |
3364 |
||
|
Truck |
Min |
94 |
487 |
33 |
0 |
6 |
|
|
Max |
12748 |
19476 |
3489 |
2973 |
1213 |
||
|
Mean |
4312 |
5055 |
756 |
634 |
146 |
||
|
Standard deviation |
3224 |
5420 |
643 |
589 |
158 |
||
|
Speed |
Min |
80 |
60 |
40 |
30 |
30 |
|
|
Max |
130 |
110 |
110 |
90 |
90 |
||
|
Mean |
122 |
90 |
75 |
74 |
71 |
||
|
Standard deviation |
13 |
17 |
16 |
17 |
17 |
||
|
Horizontal curves (%) |
Straight path |
0.73 |
0.57 |
0.48 |
0.52 |
0.40 |
|
|
Single curve |
0.23 |
0.33 |
0.33 |
0.36 |
0.39 |
||
|
Multiple curves |
0.05 |
0.10 |
0.20 |
0.12 |
0.20 |
||
|
Residential area |
No |
0.70 |
0.74 |
0.77 |
0.43 |
0.76 |
|
|
Yes |
0.30 |
0.26 |
0.22 |
0.57 |
0.24 |
||
Appropriate accident prediction models are regarded as fundamental ways of analyzing road safety. Accident frequency analysis is applicable at both the micro and macro levels. Differently, the characteristics of several road types can considerably add to the safety risk of each road segment. In other words, accident frequency may fluctuate not only across road types but also between road segments.
The frequency of accidents per road section is a count including both zeros and positive numbers. If accident counts are uncommon, they may adhere to a Poisson distribution. A property of the Poisson distribution is that the mean and variance must be equal. More often they not, the observed accident variance exceeds the mean. The exclusion of crucial explanatory variables or dependent observations is the known cause. Using a negative binomial regression, the problem of overdispersion can be overcome [36].
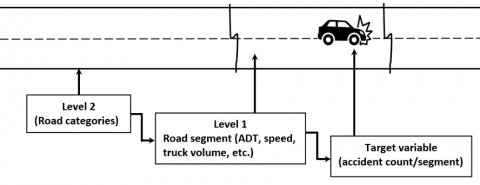
The hidden effects of the hierarchical relationship must be investigated to analyze the accident frequency and reveal the correlation between explanatory variables at both micro and macro levels. Accident frequency can be analyzed at different information levels (see Figure 1), including regional-level characteristics (i.e., population, residents), road level characteristics (i.e., category, level of service, average speed limit), or minor road segment level characteristics (i.e., AADT, speed limit, roadside hazard, curvature). For instance, the correlation may exist among road segments in which accidents occurred on the same road due to possible unobserved characteristics. Similarly, roads in the same district are more likely to share similar characteristics than roads in other districts. Considering the multilevel correlation between variables may increase the accuracy and help produce a more general model. The multilevel analysis includes modeling the relationship between different groups of accidents by identifying a hierarchical system of data that takes advantage of the clustered dataset. This means that the outcome of the model is affected by a nested relationship between the lower-level characteristics (level-one) of individual road segments and higher-level group characteristics (level-two) related to the road characteristics (which will be considered in this study), as presented in Figure 1.
This research examines accident frequency by discovering the hidden influences of a hierarchical relationship between explanatory factors in the methods section. To achieve this, a two-level technique was utilized to analyze the nested relationship between the number of roadways belonging to five distinct groups and the accident frequency per road segment. The description of the two-level model is provided below.
Figure 1. Multilevel hierarchical structure of road accident data
3.1 Level-one modelling
The level-one model treats all road segments similarly, assuming the accident risk does not change on different roads. The general single-level model tries to link the expected accident's outcome to the predicted accidents through the log-odd link function, which can be written as follows [37].
$\eta_{i j}=\log \left(\lambda_{i j}\right)=\beta_{0 j}+\sum_{q=1}^Q \beta_{q j} X_q$ (1)
where, $\eta_{i j}$ is equal to the natural logarithm of the expected accident count ($\lambda_{i j}$) per segment $i$ at road $j$. $\beta_0$ is the intercept, and $X_q$ is the slope for a predictor $q$. $\beta_q$ is the fixed effect coefficient.
The odds ratio can result from exponentiation with the log-odd coefficients (exp.($\eta_{i j}$)) when the odds ratio is less than one, the probability of the outcome decreases while it increases for a higher odds ratio above one.
3.2 Level-two modeling (developing multilevel model)
Multilevel model is distinguished from the single-level model by nesting of individual observations within higher-level groups. The multilevel model treats individual road segments as parts of groups. Each group is corresponding to a specific road with distinguished characteristics (i.e., road category). Because individual segments of the same road are likely to share similar characteristics, they are more likely to respond in the same way compared with individuals of other roads, which in turn violating the assumptions of a single model.
Unlike the fixed-effect of slopes and intercept of the single-level model, the variation of the multilevel model is random. The variation of level-one intercept values (β0j) between groups j (i.e., roads) indicates the importance of group-level characteristics on the outcome. The level-one intercept values represent a group mean when all explanatory variables are zero or at their average base [38]. The general form of the level-two model is presented in the following equation [37].
$\beta_{0 j}=\gamma_{00}+\left(\sum_j \gamma_{0 j} W_j\right)+u_{0 j}$ (2)
At the level-two, more level-one intercepts (β0j) can be modeled as a function of level-two random effect variance (u0j) with a fixed level-two intercept (γ00). In some cases, the random change in slope coefficient (γ0j) between groups can be considered as a level-two parameter (Wj) of the model. However, a general multilevel model can be formed by combining both levels (Eqns. (1)+(2)) in a single formula (Eq. (3)) [37].
$\eta_{i j}=\gamma_{00}+\left(\sum_i \gamma_{i 0} X_i\right)+\left(\sum_j \gamma_{0 j} X_j\right)+u_{0 j}$ (3)
where, Xi and Xj are fixed-effect predictors of accident frequency at level-one and level-two, respectively. γi0 is a coefficient of Xi and γ0j is a coefficient of Xj.
The estimation of the level-two variance (u0j) can judge whether groups are significantly different from each other. For multilevel model outcome, there is no separate variance (error) term at level-one, because individuals of a single group are assumed to be similar in many variables, and the variation only exists between level-two groups.
Several explanatory variables have been tested to model accident risks on different road categories, including road segment characteristics (i.e., geometrical features, traffic characteristics) and full-road characteristics (i.e., category, level of service, speed limit) excluded insignificant variables. According to Table 1, the accident counts per road segment show higher variance values (square standard deviation) than their mean values. This suggests some possible presence of over-dispersion. Therefore, the accident counts have been assumed to follow a negative binomial distribution.
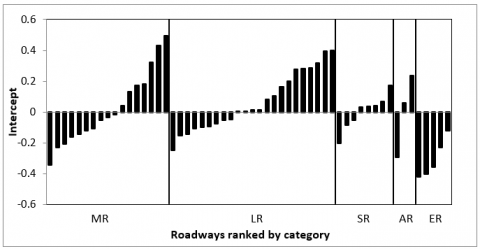
A two-level negative binomial regression model has been developed for the case study to reveal the potential unobserved within-road correlation and address the influence of different road category features, as shown in Figure 2. The level-two of the model includes features related to the full-length roadways with different categories, while the divided road segment characteristics constitute level one. Considering the accident frequency per road segment is the target variable. Figure 3 shows the level-one estimated intercept values for the 57 roads of the case study. These roads are divided into five categories: Motorways (MR), Expressways (ER), Arterial (primary main roads) (AR), Secondary main roads (SR), and Local roads (LR) as depicted in the figure. The level-one intercepts describe the unit changes in the predicted accidents assuming the other variables at their base value (average or zero). The changing intercept values (Figure 1) indicate that the predicted accidents are highly associated with different road features with increasing or decreasing trends.
Figure 3 also shows the distribution of roadway intercepts ranked by road category. The intercept describes the unit changes in the predicted accidents assuming the other variables at their base value, average or zero (i.e., AADT=10873, truck volume=1127, speed=79, path shape=straight, and residential area=no, according to all data of the case study). As the value of intercept increases, the accident density increases. Therefore, it can be noted that the intercept values (when the other variables are at their base values) for each road category range from hostile to positive, except for the motorway, which shows negative values for all roadways.
Figure 2. The proposed hierarchical structure of road accident data for the case study
Figure 3. Estimated intercept for different roadways from the multilevel analysis
The degree of variability of the intercepts is presented in a single value in Table 2(a). Table 2(a) presents the variance component of the intercept. The ratio of the intercept variance (0.084, p=0.01) to its standard error (0.033) justifies using the multilevel model. Table 2(a) is also shown the variability of the level-two road category variable. The variance of road category values (0.07, p=0.01) suggests that their accident frequency per road segment is more likely to vary across different roadways with different categories. In other words, the developed multilevel model can explain the effect of the hierarchical relationship between individual road segments and groups of roads with different categories on accident frequency.
In contrast, applying only a single-level model could reduce the model’s performance. Table 2(b) compares the model fitting (goodness-of-fit) of the single-level and multilevel models developed from the current case study data set. According to Table 2(b), the multilevel model has significantly lower Akaike Information Criterion (AIC) and Bayesian Information Criterion (BIC) values (4377, 4388 respectively) compared with the single-level model (6682, 6746 respectively). This indicates that the hierarchical structure explains part of the variation in the predicted accidents between different roads with different categories.
Table 3 summarizes the estimated fixed effect results of applying the multilevel model, considering that the length of the road segment as an offset.
Table 3 contains the variables of two hierarchical levels. The level-one microscopic variables (road segments) include AADT, truck volume, speed limits, path shape, and residential presence. The only level-two macroscopic (roadway) variable is the road category. Most of the variables in Table 3 are statistically significant at a 0.05 significance level (95% confidence level). The estimated parameters represent the odds ratio of accident counts. When the odds ratio is less than 1, the probability of the outcome decreases while it increases for a higher odds ratio above 1. The intercept value (1.47) can be interpreted as the odds ratio that describes the increased risk of accidents, assuming no predictors. In other words, accident prediction, holding the other variables at their base value, is expected to increase by about 47%.
On the other hand, the slope of one predictor can be interpreted as the amount required to increase or decrease the odd value of the expected accident rate by one unit, holding the other predictors at their base. For example, accidents are more likely to increase on road segments with higher AADT by a factor (2.70) assuming the other variables at their average or equal zero. To illustrate more, each increase in AADT by 170% is expected to increase accident prediction by one unit given that: truck volumes=1127, speed=79, path shape=straight and residential area=no, and road category=motorway. The correlation between accidents and AADT was highlighted by many researchers. Cadar et al. [39] proved that accident risk is significantly proportional with traffic volume up to a certain level of congestion. The proportional relationship has also been proved by the HSM [35].
Table 2. (a) Variance values of the random effect components (b) Comparing the goodness-of-fit of a single level and multilevel models
|
(a) |
||||
|
Variance |
Estimate |
Std. Error |
Z |
Sig. |
|
Intercept |
0.084 |
0.033 |
2.569 |
0.010 |
|
Road category |
0.071 |
0.028 |
2.555 |
0.011 |
|
(b) |
||||
|
One-level Model |
Akaike Corrected (AIC) |
6682 |
||
|
Bayesian (BIC) |
6746 |
|||
|
Multilevel Model |
Akaike Corrected (AIC) |
4377 |
||
|
Bayesian (BIC) |
4388 |
|||
Table 3. Resulted fixed effect parameter values
|
Model Term |
Odd ratio (parameter) |
Significance |
|
Intercept |
1.47 |
0.00 |
|
Level-one road segment variables |
||
|
AADT |
2.70 |
0.00 |
|
Speed-limit |
0.69 |
0.00 |
|
Truck volumes |
0.68 |
0.00 |
|
Path shape=multi-curve |
1.49 |
0.00 |
|
Path shape=one-curve |
1.33 |
0.00 |
|
Path shape=straight |
* |
* |
|
Resident=yes |
1.90 |
0.00 |
|
Resident=no |
* |
* |
|
Level-two full road variables |
||
|
Road category=local road |
1.78 |
0.00 |
|
Road category=secondary main |
1.25 |
0.06 |
|
Road category=arterial |
1.93 |
0.00 |
|
Road category=expressway |
0.20 |
0.00 |
|
Road category=motorway |
* |
* |
|
Over-dispersion |
0.53 |
|
* Reference variable
In contrast, increasing speed-limits are more likely to have safer road segments when the other predictors are at their base mean. This is a sensible result since usually road specifications improve as speed-limits increase. Therefore, increasing speed-limit for motorway straight path, and no residential road segments, above the average (i.e., 79 km/hour) is just approaching the designed speed-limit (130 km/hour), according to the motorway specifications. This is supported by Garber and Gadiraju [40] who found that drivers’ speed tends to increase as road geometrical characteristics improve, and that accident rates do not necessarily increase with an increase in average speed but do increase with an increase in speed variance. From a statistical perspective, high speed-limit roads (e.g., motorway, expressway) with higher specifications have lower accident densities compared with the other low speed-limit roads, as shown in Table 1. However, almost the same interpretation can describe the odd ratio of truck volumes that showed an inverse relationship with accident risks by 31%. On the other hand, moving from a single-curve to multi-curve road segment would increase the predicted accident by 33% and 49% with respect to a straight path shape, respectively. Similarly, it is estimated that the road segments in which residents exist are positively affected accidents by 90% compared to non-residential road segments.
The only level-two slope is the road category. Interpretation of its results is tricky somewhat since it is affected by the pre-determined base values (described above) of level-one variables. Generally, high-speed roads (motorway and expressway) show lower accidents trends compared with the lower speed roads, holding level-one variables at their base values. For the same conditions, the least accident probability is for the expressway which decreased by 80% compared with the motorway. This can also be explained by the lack of data available for the expressway which already most of which are newly constructed.
Regarding road safety, the effects of micro-and macro-level factors have a significant role in determining accident rates. In this study, a multilevel negative binomial regression model has been built to predict the accident frequency at various road segments for various road classifications. The multilevel study entailed modeling the association between distinct groups of accidents on different routes by establishing a hierarchical data system that exploits the benefits of the clustered dataset. This multilevel data is portrayed hierarchically to highlight the impact of group-level characteristics. Using the negative binomial to account for the potential dispersion of count data.
The model included two levels. In level two, fifty-seven roads have been chosen as a case study, including five different categories (i.e., motorway, expressway, arterial, secondary roads, and local roads) with distinguished characteristics. Every road has been divided into a group of level-one segments in which every segment has distinguished environmental and geometric features. Accident frequency per road segment has been chosen as a target variable. Several explanatory variables related to road segment characteristics (i.e., geometrical features, traffic characteristics) and full-road characteristics (i.e., category) have been applied in the model.
The resulting level-two variance components of the intercept confirm the presence of a hierarchical structure within the data, where there is a link between the accident frequencies on the same road. In other words, the incidence of accidents per road segment is more likely to differ between roadways. This justifies adopting a multilevel model for a more precise analysis of accident frequency. In contrast, an assessment of the random effect of a road type revealed varying slopes between the various roads within a group level. This demonstrates a link between road categories and accident risk that a one-level model analysis may not see. The results also suggested that high-speed roads (motorways and expressways) have lower accident trends than low-speed roads (arterial, secondary, and local roads) when all other model variables are at their mean or zero. This explains the distinction between the design standards for the various road types.
The accuracy of accident prediction models and black spot analyses can be improved by predicting accident frequencies by examining the nested links between micro-and macro-levels. Generally, the developed model can be extended by computing the expected number of accidents using the Empirical Bayesian method. This can improve the accuracy of accident count prediction. However, adding new levels can increase the model’s performance by increasing the number of parameters.
[1] Ghadi, M., Török, Á., Tánczos, K. (2018). Study of the economic cost of road accidents in Jordan. Periodica Polytechnica Transportation Engineering, 46(3): 129-134. https://doi.org/10.3311/PPtr.10392
[2] Michalaki, P., Quddus, M.A., Pitfield, D., Huetson, A. (2015). Exploring the factors affecting motorway accident severity in England using the generalised ordered logistic regression model. Journal of Safety Research, 55: 89-97. https://doi.org/10.1016/j.jsr.2015.09.004
[3] George, Y., Athanasios, T., George, P. (2017). Investigation of road accident severity per vehicle type. Transportation Research Procedia, 25: 2076-2083. https://doi.org/10.1016/j.trpro.2017.05.401
[4] Al-Masaeid, H.R., Bazlamit, S.M., Al-Zedaneen, A.E., Al-Mofleh, H.M. (2020). Impact of fasting on traffic accidents. Jordan Journal of Civil Engineering, 14(3): 431-442.
[5] Török, Á. (2020). A novel approach in evaluating the impact of vehicle age on road safety. Promet-Traffic&Transportation, 32(6): 789-796. https://doi.org/10.7307/ptt.v32i6.3441
[6] Guerrero-Barbosa, T., Espinel-Bayona, Y., Palacio-Sánchez, D. (2015). Effects of the attributes associated with roadway geometry, traffic volumes and speeds on the incidence of accidents in a mid-size city. Ingeniería y Universidad, 19(2): 351-367. https://doi.org/10.11144/javeriana.iyu19-2.eaar
[7] Delhaye, E. (2006). Traffic safety: Speed limits, strict liability and a km tax. Transportation Research Part A: Policy and Practice, 40(3): 205-226. https://doi.org/10.1016/j.tra.2005.06.003
[8] Marcianò, F.A., Vitetta, A. (2011). Risk analysis in road safety: An individual risk model for drivers and pedestrians to support decision planning processes. International Journal of Safety and Security Engineering, 1(3): 265-282. https://doi.org/10.2495/SAFE-V1-N3-265-282
[9] Joly, M.F., Foggin, P.M., Pless, I.B. (1991). Geographical and socio-ecological variations of traffic accidents among children. Social Science & Medicine, 33(7): 765-769. https://doi.org/10.1016/0277-9536(91)90375-M
[10] Fleury, D., Brenac, T. (2001). Accident prototypical scenarios, a tool for road safety research and diagnostic studies. Accident Analysis & Prevention, 33(2): 267-276. https://doi.org/10.1016/S0001-4575(00)00041-5
[11] Litvin, D.M., Datta, T.K. (1979). Automated collision diagrams. Transportation Research Record, 706: 23-27.
[12] Omar, A.H. (2021). The digital transformation of the government and its role in achieving the sustainable development goals: Egypt as a model. Al-Zaytoonah University of Jordan Journal for Legal studies, 2(3): 154-179. https://doi.org/10.15849/ZUJJLS.211130.07
[13] Muhammad, F. (2021). The arbitration carried out by modern technological devices. Al-Zaytoonah University of Jordan Journal for Legal studies, 2(1): 63-77. https://zjjls.zuj.edu.jo/PapersUploaded/v2/4.pdf.
[14] Hauer, E., Harwood, D.W., Council, F.M., Griffith, M.S. (2002). Estimating safety by the empirical Bayes method: A tutorial. Transportation Research Record: Journal of the Transportation Research Board, 1784(1): 126-131. https://doi.org/10.3141/1784-16
[15] Qaseem Ghadi, M., Török, Á. (2019). Comparison of different road segmentation methods. Promet-Traffic & Transportation, 31(2): 163-172. https://doi.org/10.7307/ptt.v31i2.2937
[16] Ghadi, M., Török, Á. (2019). A comparative analysis of black spot identification methods and road accident segmentation methods. Accident Analysis & Prevention, 128: 1-7. https://doi.org/10.1016/j.aap.2019.03.002
[17] Dupont, E., Papadimitriou, E., Martensen, H., Yannis, G. (2013). Multilevel analysis in road safety research. Accident Analysis & Prevention, 60: 402-411. https://doi.org/10.1016/j.aap.2013.04.035
[18] Russo, F., Vitetta, A. (2003). Disaggregate road accident analysis for safety policy and measures: Theoretical aspects and application. In Proceedings of the European Transport Conference (ETC), Strasbourg, France.
[19] Dart, O.K., Mann, L. (1970). Relationship of rural highway geometry to accident rates in Louisiana. Highway Research Record, 312: 1-16.
[20] Haghighi, N., Liu, X.C., Zhang, G.H., Porter, R.J. (2018). Impact of roadway geometric features on crash severity on rural two-lane highways. Accident Analysis & Prevention, 111: 34-42. https://doi.org/10.1016/j.aap.2017.11.014
[21] Abdel-Aty, M.A., Radwan, A.E. (2000). Modeling traffic accident occurrence and involvement. Accident Analysis & Prevention, 32(5): 633-642. https://doi.org/10.1016/S0001-4575(99)00094-9
[22] Brodsky, H., Hakkert, A.S. (1988). Risk of a road accident in rainy weather. Accident Analysis & Prevention, 20(3): 161-176. https://doi.org/10.1016/0001-4575(88)90001-2
[23] Edwards, J.B. (1996). Weather-related road accidents in England and Wales: A spatial analysis. Journal of Transport Geography, 4(3): 201-212. https://doi.org/10.1016/0966-6923(96)00006-3
[24] Cioca, L.I., Ivascu, L. (2017). Risk indicators and road accident analysis for the period 2012-2016. Sustainability, 9(9): 1530. https://doi.org/10.3390/su9091530
[25] Al-Masaeid, H.R., Suleiman, G. (2004). Relationships between urban planning variables and traffic crashes in Damascus. Road & Transport Research, 13(4): 63-73.
[26] Jovanis, P.P., Chang, H.L. (1986). Modeling the relationship of accidents to miles traveled. Transportation Research Record, 1068: 42-51.
[27] Castro, M., Paleti, R., Bhat, C.R. (2012). A latent variable representation of count data models to accommodate spatial and temporal dependence: Application to predicting crash frequency at intersections. Transportation Research Part B: Methodological, 46(1): 253-272. https://doi.org/10.1016/j.trb.2011.09.007
[28] Persaud, B.N., Mucsi, K. (1995). Microscopic accident potential models for two-lane rural roads. Transportation Research Record, 1485: 134-139.
[29] Persaud, B., Dzbik, L. (1992). Accident prediction models for freeways. Transportation Research Record, 1401: 55-60.
[30] Ghadi, M., Török, Á. (2017). Comparison different black spot identification methods. Transportation Research Procedia, 27: 1105-1112. https://doi.org/10.1016/j.trpro.2017.12.104
[31] Gururaj, H.L., Janhavi, V., Tanuja, U., Flamini, F., Soundarya, B.C., Ravi, V.K. (2022). Predicting traffic accidents and their injury severities using machine learning techniques. International Journal of Transport Development and Integration, 6(4): 363-377. https://doi.org/10.2495/TDI-V6-N4-363-377
[32] Alzyadat, W., AlHroob, A., Almukahel, I.H., Muhairat, M., Abdallah, M., Althunibat, A. (2021). Big data, classification, clustering and generate rules: An inevitably intertwined for prediction. In 2021 International Conference on Information Technology (ICIT), IEEE, pp. 149-155. https://doi.org/10.1109/ICIT52682.2021.9491733
[33] Lenguerrand, E., Martin, J.L., Laumon, B. (2006). Modelling the hierarchical structure of road crash data-Application to severity analysis. Accident Analysis & Prevention, 38(1): 43-53. https://doi.org/10.1016/j.aap.2005.06.021
[34] Cai, Q., Abdel-Aty, M., Lee, J., Huang, H. (2019). Integrating macro-and micro-level safety analyses: A Bayesian approach incorporating spatial interaction. Transportmetrica A: Transport Science, 15(2): 285-306. https://doi.org/10.1080/23249935.2018.1471752
[35] Highway Safety Manual, 1st Editio. (2010). American Association of State Highway and Transportation officials, Washington, DC, USA.
[36] Poch, M., Mannering, F. (1996). Negative binomial analysis of intersection-accident frequencies. Journal of Transportation Engineering, 122(2): 105-113. https://doi.org/10.1061/(asce)0733-947x(1996)122:2(105)
[37] Heck, R.H., Thomas, S., Tabata, L. (2013). Multilevel Modeling of Categorical Outcomes Using IBM SPSS. Routledge.
[38] Azen, R., Walker, C.M. (2011). Categorical Data Analysis for the Behavioral and Social Sciences. Routledge.
[39] Cadar, R.D., Boitor, M.R., Dumitrescu, M. (2017). Effects of traffic volumes on accidents: The case of Romania’s national roads. Geographia Technica, 12(2): 20-29. https://doi.org/10.21163/GT_2017.122.03
[40] Garber, N.J., Gadiraju, R. (1989). Factors affecting speed variance and its influence on accidents. Transportation Research Record, 1213: 64-71.