Antonella Pireddu*![]() | Mara Lombardi
| Mara Lombardi![]() | Silvia Bruzzone
| Silvia Bruzzone![]() | Davide Berardi
| Davide Berardi![]() | Massimo Guarascio
| Massimo Guarascio![]()
© 2023 IIETA. This article is published by IIETA and is licensed under the CC BY 4.0 license (http://creativecommons.org/licenses/by/4.0/).
OPEN ACCESS
Between 2018 and 2020, in the approximately 2,600 km of Italian road tunnels, 2,899 people were injured and 60 died in 1,885 road accidents. The accident frequency was lower than on open roads, while the injury/fatality rate was higher. Using the recursive partitioning and regression trees method (rpart), we developed two accident models useful for predicting the probability of involvement of "vehicle type" in short and long tunnels. Variables such as the type of accident, the circumstances, the type of road, the carriageway, the time of the accident, the journey purpose (whether work-related or not), and the length of the tunnel defined the nodes and paths of the regression tree associated with a vehicle type involved. The “road type” was the best predictors for short tunnels while the “journey purpose” was the best predictor for long tunnels. The most important result of the study refers to the similarity between the probability of an accident in short and long tunnels for a specific segment of road users: commuting and non-commuting car drivers and drivers of heavy goods vehicles on-duty. The study showed that this road user segment in short tunnels has an accident probability half that observed in long tunnels.
accident model, commuting, machine learning, on-duty driving, rpart, road user, vehicle type, work-related-road accident
Road tunnels are a common feature in Italy due to the presence of mountain chains such as the Alps, which mark the northern border of the country, and the Apennines, which divide the territory longitudinally. In Italy, tunnels extend for about 2,600 km and cover a large part of the national road network. A tunnel traffic accident is the result of a collision between two or more vehicles or of a vehicle hitting a pedestrian, an animal, or an obstacle such as a tunnel wall, a traffic signal, etc. [1]. Amundsen et al. [2-4], in a series of studies on accidents in Norwegian road tunnels from 1994 to 2009, found that the risk of accidents in tunnels is lower than on open roads, but the severity of accidents is much higher. Further studies on road accidents in Italian tunnels confirm a lower accident frequency than in straight stretches, curves, roundabouts, and intersections [5]. However, although less frequent than in open stretches, road accidents in tunnels can cause serious consequences, such as a fire [1]. According to Nævestad and Meyer [6], most tunnel fires and SWF (smoke without fires) are caused by vehicle accidents and not by vehicle failures. In accordance with previous simulation and psychological studies, the analytical results indicate that different tunnel types have distinct accident characteristics and therefore should be considered separately for safety analysis [7]. When dealing with the topic of road safety and tunnels, the analysis of accidents cannot be disregarded, as the count of road accidents and their fatalities is essential information for road safety practitioners to analyse their spatial and temporal aspects [8]. Xing et al. [9] defined a classification criterion for the safety of road tunnels based on a calibrated exponential model that relates the accident rate to the standard deviation of speed, as well as an engineering judgement on the modelling. In the period 2018-2020, the Italian National Institute of Statistics recorded 463,034 road accidents, 643,551 injuries and 8,902 deaths on Italian roads [10-12]. In 2020, the United Nations General Assembly adopted Resolution A/RES/74/299 “Improving Global Road Safety”, in which it calls on Member States and the international community to intensify collaboration to ensure greater commitment to improving road safety. In this context, the WHO and the UN Regional Commissions developed the Global Plan for the Decade of Action for Road Safety 2021-2030, which has the goal of preventing at least 50 per cent of road deaths and injuries by 2030 through better design of road rules and controls, improved vehicle and road design. The Directive 2004/54/EC of the European Parliament and of the Council of 29 April 2004 on minimum safety requirements for tunnels in the Trans-European Road Network longer than 500 m [13] regulates minimum safety requirements for tunnels in operation, under construction or at the design stage. Following serious accidents between 1999 and 2002 in countries such as Austria, France, Germany, Italy and Switzerland, the directive considers risk analysis an indispensable tool for the safety assessment of road tunnels. The Italian national transposition of the European Road Tunnels Directive introduced the use of Risk Analysis also in tunnels with characteristics that do not comply with the safety parameters set out in the Directive [14]. Directive 2008/96/EC on road infrastructure safety management in Europe provides for the establishment and implementation of road safety impact assessment procedures in the design of the trans-European road network, leaving Member States free to apply them or not to other national road infrastructures. The directive provides for the classification of network safety and the identification of road sections with a high concentration of accidents (Annex III), leaving the methodology for analysing road accidents open [15]. Recently, the Stockholm Declaration reinforced the EU’s own aspirations: the EU Road Safety Policy Framework 2021-2030 aims at halving the number of fatalities and serious injuries on European roads by 2030, as a milestone on the way to “Vision Zero” - zero fatalities and serious injuries by 2050.
A methodologic reference for risk analysis in the design phase is the DM 28 October 2005 of the Italian Ministry of Infrastructure, unfortunately only applicable to railway tunnels [16]. The decree provides the basis for the critical application of consolidated probabilistic methods for the risk assessment of complex events, based on event tree and cause tree techniques, combined with scenario studies for the assessment of the consequences associated with each outcome. The proposed methods are also based on officially accredited databases on accident rates and component malfunction or failure rates for the observed system. This source, although not applicable to road tunnels, provides a valuable methodological reference consistent with the contents of the Stockholm Declaration and emphasises a holistic approach to safety based on the information contained in the databases.
Information concerning the characteristics of the road network, the stratification of transport demand between various areas in the territory, whether they are connected by tunnels or not, the purposes of journeys and the means of public or private transport used for journeys, are fundamental both for planning purposes and for road accident analysis. In recent years scientific research has focused on the development of accident classification and prediction models based on big data and machine learning methods. Starting from these premises, by using the recursive partitioning and regression trees [17] a powerful “machine learning” that provides a prediction algorithm (probability) by a mathematical model.
We analysed the datasets on road accidents occurring in Italian road tunnels between 2018 and 2020, provided by the Italian National Institute of Statistics (Istat). The aim of the study was to provides a model to predict the involvement of different vehicle types (target variable) in tunnel road accidents. Rpart algorithm based applied to two subsets, short and long tunnel accident provided two different accident models and the most probable scenario (path) of accident variables extracted by the Istat database. Accident parameters such as accident type, circumstances, type of road, carriageway, time of accident, purpose of travel, type of vehicle involved, represented the nodes, the leaves, and paths of the trees. This work includes a Section 1 Introduction where is offered a description of the context and specificities of accidents in Italian road tunnels, the Section 2 Materials and Methods, describes the sources, the reference time frame for the data used, the location and methods used in the study. The Section 3 Results describes the findings obtained, the validation metrics and the graphic representation of the two classification-prediction models. Section 4 Discussion includes an analysis of the results obtained and a comparison based on scientific literature and the state of the art and the Section 5 Conclusions summarize the main findings. Our work offers a contribution in risk analysis based on road accidents (collisions, impacts, rear-ends) also useful in case of accidents triggered in a domino effect.
Statistical information on road accidents in Italy is produced by Istat based on the set of all road accidents that occurred on the national territory and resulted in personal injuries (deaths within the 30th day or injuries). The collection of information involves the cooperation of public safety bodies in connection with their duties in relation to traffic regulation. The survey of road accidents resulting in death or injury is included in the National Statistical Programme (IST-00142) and was established by an ISTAT programmatic act to meet the information needs of national decision-making bodies and local administrations engaged in the preparation of prevention and road safety plans and to provide a solid information base for researchers and data users. The field of observation of the survey consists of all road accidents recorded by a police authority, which occurred on the national territory within a year and caused injuries to persons (deaths within 30 days or injuries). International standards (European Commission, Eurostat, OECD, ECE, etc.), transposed by our country, define a road accident as “that event in which at least one vehicle is involved in circulation on the road network and which results in personal injury” (Vienna Conference, 1968). The scope of observation therefore includes all road accidents occurring in streets or squares open to public traffic, in which accidents involving stationary or moving vehicles and resulting in personal injury. Excluded from the survey are accidents that did not result in personal injury, those that did not occur in areas open to public traffic, accidents in which no vehicles were involved and those in which a police force did not intervene. The survey refers to the time when the accident occurred.
The main attributes recorded are accident circumstances (not keeping distances between vehicles, distraction, normal driving, speeding, unspecified and other circumstances, corresponding to driver behaviour recorded when the accident occurred); accident type (rear-end; impact or collision with other vehicles; pedestrians or obstacles, skidding or off-road etc.); carriageway (one way lane, two way lanes, two carriageways, more than two carriageways); infrastructure type (intersection, tunnel, curve, etc.); consequence (accident with at least one fatality, accident with at least one injured person and no fatality); location (longitude and latitude), journey purpose (in route to/from work, driving on duty or not work-related); pedestrian (accident not involving pedestrian, accident involving at least one pedestrian); road type (motorway, rural road, urban road); time of accident occurrence (defined according to a conventional interval); vehicle type (car, truck and special vehicle, motorcycle, other vehicle etc.) [10-12, 18]. These variables, better described in Table 1, are based on Istat and European encoding (European Commission CARE 2016). To classify or predict the involvement of different types of vehicles in tunnel accidents, we used the Istat dataset of road accidents, referring to 2018-2020 by selecting “tunnel' as the type of road infrastructure involved. First, after geo-processing the Istat dataset was completed with the length of the tunnel involved in the accident. Rstudio version 1.3 and Quantum Gis (geographic information system) version 3.18.3 were used.
The tunnels were then grouped into two classes, including subways: up to 500 metres in length and over 500 metres in length, suitable for the exploration and classification of accident data using the recursive partitioning and regression trees method [17]. This is a “machine learning” that provides a prediction algorithm (probability) defined by a mathematical model. The advantage of this non-parametric method in R is that the result is relatively easy to understand and interpret. By selecting “vehicle type” as the target variable, the rpart algorithm determined the best variable (root node) for predicting the type of vehicle involved in the accident. Dividing the original dataset into a training set and a test set and choosing “class” as the algorithm to be used in the model, the target variable (vehicle type) was linked to the other variables. Based on the subset used to train the machine to predict a given observation, the predictor variables were then divided into several simple areas. The prediction was derived from the average of the observations in the area in which the observation falls. The “root node” best divides the datasets of the short and long tunnels, while the remaining nodes classify the data in the tree model. For each complexity parameter (cp), the error rate calculated by cross-validation represented the average of the error rates calculated over the entire dataset. This was useful for redistributing the error ratio and evaluating the performance of the model. The “confusion matrix” provided indicators for assessing the reliability of the model such as “accuracy”, “sensitivity”, “specificity” and “balanced accuracy”. The former measures the frequency with which the model predicted the positive class, the sensitivity measures the rate of true positives. Balanced accuracy was particularly useful for our study, as the classes were not balanced (one class appeared much more than others). Balanced accuracy close to 1 indicates that the model is better able to classify or predict observations.
In Italy, tunnels and subways cover the entire territory: 907 km in the North-West, 488 km in the North-East, 410 km in the Centre, 527 km in the South and 268 km in the Islands (Author’s processing on OpenStreetMap data). The class of tunnels up to 500 m is the most numerous with over 8,300, while there are approximately 750 tunnels between 500 and 1,000 m in length. The other classes are less numerous and range from around 300 (1,000-1,500 m) to 30 (3,000-3,500 m).
Accidents in short tunnels mainly affect urban areas while those in long tunnels mainly affect extra-urban areas.
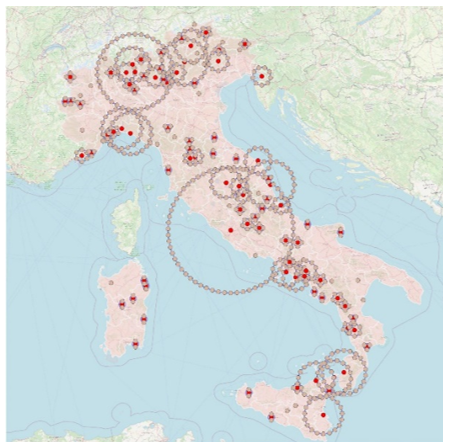
In Figure 1, red dots indicate the barycentre's around which are placed, equidistant, the accidents occurred in the Italian short road tunnels during the 2018-2020 period. The largest radius indicates higher accident frequencies.
Accidents in short tunnels are more frequently located in major Italian metropolitan areas such as Rome, Milan, Turin, Bologna, Bari, Florence, Genoa, Naples, Palermo, Venice, Messina, Catania, Cagliari, Reggio di Calabria where, most of the road traffic is concentrated.
Figure 2 shows the traffic accidents in the long Italian tunnels. The circles around barycentre extend beyond the metropolitan areas and project radius that are much wider, involving the Alps and the Apennine ridge up to Sicily. Very extended is the circle in central Italy, which comprises the Gran Sasso and its tunnel (more than 10,100 meters long). The Apennine Ridge, which extends to Calabria and Sicily, has experienced a more significant increase in accidents in the long tunnels.
Figure 1. Tunnel road accidents. Short tunnel accidents moved at equal distances from their barycentre (red point). Italy. Years 2018-2020
Source: Author’s processing on Istat data, R and OpenStreetMap
Figure 2. Tunnel road accidents. Long tunnel accidents moved at equal distances from their barycentre (red point). Italy. Years 2018-2020
Source: Author’s processing on Istat data, R and OpenStreetMap
The urbanised areas of Northern Italy are characterized by a high number of circles. Many of these are overlaid also because of the urban density and consequently the high vehicular traffic. However, all the circles are included within the national borders and do not affect the large Alpine tunnels and even those Apennines.
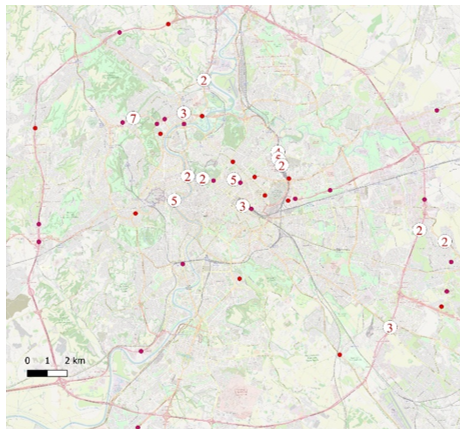
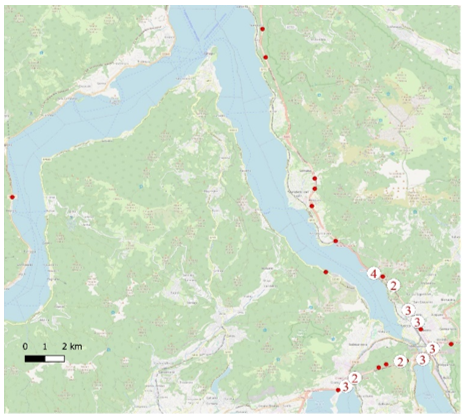
Figure 3 shows accidents in short tunnels on urban, rural roads and motorways in the metropolitan area of Rome. Figure 4 shows the accidents related to long tunnels in rural roads and motorways, around Lake Como in northern Italy.
Figure 3. Road accidents in tunnels up to 500 m. Urban area of Rome. Italy. Years 2018-2020
Source: Author’s processing on Istat data, R and OpenStreetMap
Figure 4. Road accidents in tunnels over 500 m. Como Lake. Northern Italy. Years 2018–2020
Source: Author’s processing on Istat data, R and OpenStreetMap
The reason that prompted our analysis of accidents in Italian road tunnels is linked to the increasing trend observed in the period 2013-2017 [19]. On the other hand, the same trend for the two-year period 2018-2020 was constant, probably also because of the traffic restrictions due to the Covid 19 pandemic look down, which generated an inflection in vehicle traffic that also affected tunnel accidents. The 1,885 cases of our dataset, occurred during 2018-2020, associated with 2,999 injuries and 60 deaths [10-12] were then grouped in classes as listed in Table 1.
The tunnel accident dataset grouped in classes was thus suitable to the be used in rpart model.
A result of descriptive analysis applied to our dataset is represented in Table 2 where data are classified by short tunnel accidents (underpasses included) and long tunnel accidents and Table 3 where accidents are grouped by road type.
Table 1. Accident attributes by classes. Italy. Years 2018–2020
|
Attribute |
Classes |
|
Road type |
motorway rural road urban road |
|
Accident circumstances (Care 2016) |
distance distraction normal driving speeding other |
|
Journey purpose |
work-related 1 (on-duty driving) work-related 2 (commuting) not work-related |
|
Accident time |
morning (06 h-12 h) afternoon (13 h-18 h) evening (19 h-21 h) night (22 h-05 h) |
|
Accident type |
rear-end collision impact other |
|
Tunnel type |
short tunnels (≤ 500 m) long tunnel (> 500 m) |
|
Carriageway |
carr1 (one-way lane) carr2 (two-way lanes) carr3 (two carriageways) carr4 (>2 carriageways) |
|
Consequence |
Death (one or more fatalities) Injury (one or more injuries not fatalities) |
|
Pedestrian |
0 (not pedestrian involved) 1 (one pedestrian involved) |
|
Vehicle type |
car truck, special vehicle motorcycle bicycle&scooter, electric bicycle&scooter other vehicles |
Source: Authors’ processing on Istat data
Table 2. Accident frequency by tunnel length and vehicle type. Italy. Years 2018–2020
|
Vehicle type |
Tunnel length (m) |
|||
|
≤ 500 |
> 500 |
NA |
total |
|
|
Car |
641 |
499 |
146 |
1286 |
|
Motorcycle |
151 |
72 |
57 |
280 |
|
Truck, special vehicle |
93 |
79 |
11 |
183 |
|
Other vehicle |
18 |
25 |
5 |
48 |
|
Bicycle, scooter |
62 |
5 |
21 |
88 |
|
Total |
965 |
680 |
240 |
1885 |
Source: Authors’ processing on Istat data
Table 3. Accident frequency by tunnel length and road type. Italy. Years 2018–2020
|
Road type |
Tunnel length (m) |
|||
|
≤ 500 |
> 500 |
NA |
total |
|
|
Motorway |
233 |
306 |
2 |
541 |
|
Rural road |
265 |
284 |
98 |
647 |
|
Urban road |
467 |
90 |
140 |
697 |
|
Total |
965 |
680 |
240 |
1885 |
Source: Authors’ processing on Istat data
Once analysed attributes and classes we provided the "randomisation" of the tunnel accident datasets for short, long tunnel and underpasses (Table 4) useful in model developing.
Table 4. Attributes and classes resulting from dataset randomisation. Short and long tunnels, underpasses
|
Attribute |
Classes |
≤ 500 |
> 500 |
Underpasses |
|
(%) |
(%) |
(%) |
||
|
Road type |
motorway |
29 |
46 |
10 |
|
rural road |
26 |
41 |
30 |
|
|
urban road |
45 |
13 |
60 |
|
|
Carriageway |
1 |
36 |
49 |
28 |
|
2 |
42 |
28 |
54 |
|
|
3 |
20 |
23 |
16 |
|
|
4 |
2 |
0 |
2 |
|
|
Vehicle type |
bicycle, scooter |
7 |
1 |
6 |
|
car |
66 |
73 |
64 |
|
|
motorcycle |
15 |
10 |
16 |
|
|
other vehicle |
2 |
4 |
3 |
|
|
truck, special vehicle |
10 |
12 |
10 |
|
|
Circumstance |
distance |
14 |
17 |
12 |
|
distraction |
16 |
14 |
16 |
|
|
normal driving |
20 |
22 |
24 |
|
|
other circumst |
35 |
33 |
36 |
|
|
speeding |
15 |
14 |
12 |
|
|
Time of accident |
afternoon |
41 |
39 |
46 |
|
evening |
8 |
11 |
15 |
|
|
morning |
38 |
38 |
29 |
|
|
night |
13 |
13 |
8 |
|
|
Accident type |
collision, impact |
43 |
42 |
45 |
|
rear-end |
37 |
37 |
35 |
|
|
other |
20 |
21 |
20 |
|
|
Consequences |
dead |
2 |
4 |
3 |
|
injured |
98 |
96 |
97 |
|
|
Journey purpose |
not work-related |
94 |
95 |
96 |
|
on-duty driving |
2 |
2 |
2 |
|
|
commuting |
4 |
3 |
1 |
By the regression analysis we explained the relationship between the dependent or target variable Y and one or more independent variables or regressors named predictors X1,X2,…Xk as explained in the Eq. (1):
Y=f(X1,X2,…Xk)+ ε (1)
The second term ε refer to accidental error. Thus, the target variable "Vehicle type" is expressed by the predictors while ε, is due to the set of variables left out in the applied model. The algorithm rpart resulted as follow [formula=vehicle type ~ road type + circumstance + journey purpose + accident time + accident type + tunnel type + carriageway + consequence + pedestrian, data=train, method="class", minsplit=50, minbucket=8, cp=0.01]. Minsplit and minbucket are the parameters for “pruning” the tree and reducing its complexity. Assuming 0.01 as the complexity parameter, the algorithm continued to separate the trees until the explained rate of variance was less than 0.01. As a result, we obtain a model cross validated that estimates, for each subset, the “size” of each “target variable” by length classes. The “class” algorithm was used to link the target variable to the others and divide the dataset into a training set and a test set. The former, containing 90% or 95% of the original dataset, provided root nodes, nodes, and leaf nodes on which the models were developed. The variables of Istat dataset complete with relevance index (importance) were aggregated according to the criteria shown in Table 5.
Table 5. Accident variables (nodes). Importance of variables and paths by type of tunnel
|
Variables |
Importance (≤ 500 m) |
Importance (> 500 m) |
|
Road type |
32 |
- |
|
Accident circumstances |
35 |
- |
|
Journey purpose |
11 |
100 |
|
Accident time |
7 |
- |
|
Accident type |
7 |
- |
|
Carriageway |
(4) |
- |
|
Consequence |
- |
- |
|
Pedestrian |
- |
- |
|
Vehicle type |
target |
target |
3.1 Validation of models and test
We estimated the root node error to compute two measures of predictive performance, considering the complexity parameter (cp), the relative and x error, the standard error of the mean (Tables 6 and 7).
Table 6. Complexity parameter, nodes (split) and errors of short tunnel accident tree model
|
|
cp |
nsplit |
rel error |
xerror |
xstd |
|
1 |
0.050228 |
0 |
100.000 |
100.000 |
0.055236 |
|
2 |
0.022831 |
2 |
0.89954 |
0.91324 |
0.053911 |
|
3 |
0.018265 |
3 |
0.87671 |
0.92694 |
0.054136 |
|
4 |
0.010000 |
4 |
0.85845 |
0.90411 |
0.053757 |
Considering the short tunnel accident model the root node error is 0.33182. The error rate computed on the training dataset (relative error × xstd) is 0.04 (4%). The cross-validated (CV) error rate provided the estimated error rate of the tree on the data using 10-fold CV (xerr × root node error). This CV error is 0.297 (30%).
Table 7. Complexity parameter, nodes (split) and errors of long tunnel accident tree model
|
|
cp |
nsplit |
rel error |
xerror |
xstd |
|
1 |
0.017241 |
0 |
100.000 |
100.000 |
0.064856 |
|
2 |
0.010000 |
3 |
0.94828 |
0.97701 |
0.064376 |
Table 8. Tree model validation. Target variable: type of vehicle affected. Test set 5% and 10% of the original dataset. Italy. Years 2018–2020
|
Vehicle type |
Balanced accuracy (≤500m) |
Balanced accuracy (>500m) |
|
Bicycle, scooter |
0.6 |
NA |
|
Car |
0.6 |
0.6 |
|
Motorcycle |
0.6 |
0.5 |
|
Other type of vehicle |
NA |
0.5 |
|
Truck, special vehicle |
0.6 |
0.6 |
Considering the long tunnel accident model the root node error is 0.2681. The error rate computed on the training dataset (relative error × xstd) is 0.057 (6%). The cross-validated (CV) error rate provided the estimated error rate of the tree on the data using 10-fold CV (xerr × root node error). This CV error is 0.2646 (27%). The CV error that provided a reliable indicator of predictive accuracy resulted in 30% in the short tunnel model accident and 26% in long tunnel one. The obtained parameters calculated on the training dataset must be compared with the metrics derived from the confusion matrix, calculated instead with the testing dataset (Table 8).
The accuracy of model for the short tunnel accident is included in the range 0.5-0.7. The balanced accuracy resulted overall 0.6 (other type of vehicle excluded). The balanced accuracy reached 0.6 for long tunnels for car and truck and special vehicles (excluding bicycle, scooter), and 0.5 for motorcycle and other vehicle (Table 2).
The model for short tunnels includes 5 nodes, 6 predictive paths (leaves) while 1 node and 2 paths, the one for long tunnels. The paths from root nodes to leaf ones provided the accident probability per type of vehicle involved.
3.2 Graphical representation of models
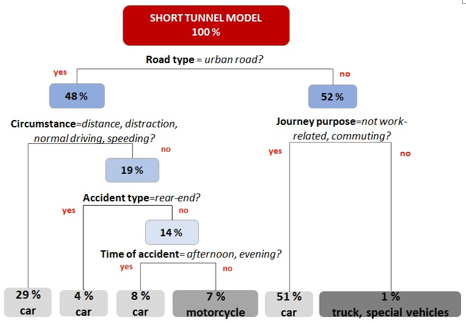
The variables included in the accident model for short tunnels were 5: “road type” (root node), “circumstance”, “journey purpose”, “accident type” and “time of accident”. The terminal nodes (leaf) resulted from the model were thus: cars, motorcycles, truck or special vehicles in six different paths (Figure 5). The unused leaf nodes in the tree were "bicycles and scooters", "electric bicycles and scooters" and "other vehicles". "Consequences" and "Pedestrians" that were not included by the algorithm. "Carriageway" was subsequently "pruned" from the tree. The predictive rule determined by the terminal node (leaf) contains the highest predictive purity and class homogeneity.
Figure 5. Road accident model. Short tunnels. Target variable: type of vehicle involved. Training dataset 90%, 95%. Italy. Years 2018–2020
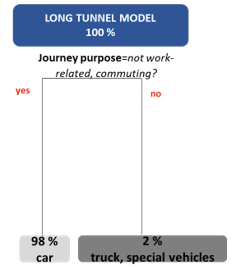
The accident tree in long tunnels included "journey purpose" as root node, split into two leaf nodes: cars, associated with the purpose of travel not related to work or commuting and trucks or special vehicles associated with driving on duty (Figure 6). Reliability was calculated by the confusion matrix, from the test set (10% or 5% of the original data set).
Figure 6. Road accident model. Short tunnels. Target variable: type of vehicle involved. Training dataset 90%, 95%. Italy. Years 2018–2020
The comparison between the two graphic results (Figures 5 and 6) shows a clear similarity regarding the two models. At the point where the root node splits branching into accidents in short tunnels located in rural roads and motorways (Figure 5) it branches out qualitatively repeating the model for accidents in long tunnels (Figure 6). Quantitatively, the ratio of the former to the latter is 1:2 (Figure 7). For the short tunnels we obtained 5 nodes, 6 predictive scenarios and 3 types of vehicles represented by the leaves of the tree. For long tunnels we obtained 1 node and 2 predictive scenarios and two types of vehicles.
Figure 7. Focus on similarities between short and long tunnels probabilities. Target: type of vehicle. Italy. Years 2018–2020
Source: Author’s processing on Istat data, R
According to Bassan [1], the risk of an accident in the tunnel is small compared to the open section (about half), while the severity of the accident in the tunnel is higher. Recent studies have shown that the length of the tunnel has a significant impact on the severity of injuries: a longer tunnel is associated with more severe accident consequences [9, 20-22]. Different tunnel types have distinct collision characteristics and therefore it makes sense to consider them separately for safety analysis. According to Xing [7], the vehicle type was decisive for the severity of the individual tunnel accidents. Compared to cars, trucks and special vehicles have a significantly lower accident risk. This result can be explained by the difference in structure and speed between heavy goods vehicles and passenger cars.
The study showed that in short tunnels, the involvement of passenger cars accounts for 92 per cent of the total (41 per cent on urban roads associated with distraction, distances between vehicles, speeding and normal driving and 51 per cent on rural roads and motorways and not related to "work" or "commuting"), motorbikes 7 per cent and trucks or special vehicles 1 per cent. The accident model in short tunnels included among the variables the type of road (main junction), the circumstances of the accident, the purpose of the trip, the type and time of the accident [5].
Xing et al. [9] observed that for the single accident, in short tunnels, the time at which the accident occurs is considered significant for the type of vehicle involved. We found that the time of the accident is a predictor only in the case of motorbike involvement (7%) in the morning and evening and for passenger cars (8%) in the afternoon and evening. For long tunnels, the tree includes the main node given by the “journey purpose” and includes as leaf nodes, cars (98%) associated with “non-work” or “commuting” journeys and trucks or special vehicles (2%), associated with “on-duty driving”. The algorithm "pruned" the " carriageway type". This result seems to contrast with the importance accorded by recent studies to carriageway type. Xing et al. [9] found that increasing the number of lanes increases the severity levels of accidents in tunnels, since changing lanes while overtaking would lead to high speed and high accident risk [9].
The model showed differences between short and long tunnels that partly confirm the results of previous studies [5, 18, 20], concerning the "root node" ("type of road" for the former and "purpose of travel" for the latter). The type of vehicle involved in the accident (target) was associated with a defined probability of being involved in the accident, because of a combination of the remaining scenario variables, which were found to be relevant in the development of the model. Some variables were “pruned” from the tree, while others were not considered at all by the algorithm, thus ensuring more reliable trees. Then, we excluded from the study variables such as road sections, tunnel geometry, traffic volumes and safety requirement of each tunnel as well as aspects related to the anomalous 2020 case history during the SARS-CoV-2 pandemic. In our study we left out parameters related to the characteristics of traffic and road network, thus introducing an error in the development of the model that can explain the metrics found by the confusion matrix. Instead, road traffic parameters can be considered in studies relating to limited road sections. Borghetti et al. [23] developed a risk assessment method applied to the A24 and A25 sections of Italian road network. According to Borghetti et al. [23] the aim of the Quantitative Risk Analysis (QRA) for road tunnels, performed in accordance with the European Directive (2004) on minimum safety requirements for tunnels belonging to the Trans-European Road Network, is to evaluate the risk for the specific “tunnel system”. This means that several parameters such as accident rate, traffic and speed characteristics, tunnel geometry, as well as infrastructure measures, equipment and management procedures have to be considered.
Subotić et al. [24] analysed the formula of regression of the mean arithmetic speed and of exceeding the speed limits in a road section as a function of the longitudinal slope, by vehicle type. The study shows a particular behaviour of drivers, linked to exceeding the speed indicated on the road in question. Cars experienced higher speeds, followed by light vehicles. Heavy vehicles experienced lower speeds. According to Xing et al. [9] in tunnels, trucks and heavy goods vehicles have a significantly lower accident risk than cars, which can partly be explained by the difference in speed between the two types of vehicles. These aspects affect the analysis of tunnel accidents where there is a "modified" perception of the distance between vehicles and the speed resulting from driving in a confined environment.
With the recent increase in trade between China and Europe, the emphasis is on the choice of the best transportation route in terms of cost, time and carbon dioxide emissions. Zhou et al. [25] studied multi-objective models to assess the most optimal transport pattern in relation to transport costs, time and carbon emissions. These models identified in rail-road combination transportation as the most optimal. Combined transport routes have an impact on reducing truck traffic volumes on the road network and on border tunnels. The optimisation of transport routes can have an impact on environmental sustainability, road safety and the prevention of disasters in tunnels caused by a domino effect.
Our study focused on the vehicles most involved in road accidents in tunnels, identifying two models where the separation between heavy vehicles and other vehicles was clear. The study highlighted scenario classes and similarities associated with target variables. The rpart-based model offered a probabilistic methodological approach on risk analysis focusing on the variables observed at the time of the accident. Results obtained from the short tunnel model in motorways and rural roads are comparable to those resulting from the long tunnel model (Figure 6). This finding indicates that the probability associated with the type of vehicle involved in an accident is strong linked to the type of road. Another aspect of great importance highlighted by the two models is that the variable that most of all affects the type of vehicle involved a tunnel road accident in rural sections (motorway and not) is the journey purpose: on commuting and not work-related journey or on-duty driving (Figures 5 to 7).
The study identified the parameters or variables most relevant to predicting the probability of an accident in the case of both short and long tunnels. The “type of road” involved in the accident was the best “predictor” for accidents in short tunnels, while “journey purpose” was the best “predictor” for long tunnels. The rpart algorithm provided two different accident models for short and long road tunnels. However, the models obtained showed similarities for specific road user segments, such as “cars during commuting or cars during non-work-related journeys” and “trucks and special vehicles on-duty”. These are road user segments common to both models (short and long tunnels) but are twice as probability in the case of long tunnels (Figure 7). These aspects represent the most important result of this work. The main limitations of the study, on the other hand, derive from the exclusion of variables such as road sections, traffic volumes, etc. and from the anomalous 2020 case history during the SARS-CoV-2 pandemic. These are aspects that we will analyse in future work considering road tunnels characterised by a high level of homogeneity in terms of vehicle traffic, geometry, construction, planimetric aspects, technologic and safety equipment of tunnels and based on a larger number of case studies. The added value offered by the two models consists in obtaining an accident probability associated with a class of vehicles and a combination of variables along a path leading to an accident. The result is useful for risk analysis and prioritisation of accident mitigation interventions in tunnels related to specific user segments.
[1] Bassan, S. (2016). Overview of traffic safety aspects and design in road tunnels. International Association of Traffic and Safety Sciences - IATSS Research, 40(1): 35-46. http://dx.doi.org/10.1016/j.iatssr.2016.02.002
[2] Amundsen, F.H. (1994). Studies of driver behaviour in Norwegian road tunnels. Tunnelling and Underground Space Technology, 9(1): 9-15. https://doi.org/10.1016/0886-7798(94)90004-3
[3] Amundsen, F.H., Ranes, G. (2000). Studies on traffic accidents in Norwegian road tunnels. Tunnelling and Underground Space Technology, 15(1): 3-11. https://doi.org/10.1016/S0886-7798(00)00024-9
[4] Amundsen, F.H., Engebretsen, A. (2009). Studies on Norwegian Road Tunnels II. An Analysis on Traffic Accidents in Road Tunnels 2001-2006. http://hdl.handle.net/11250/192582.
[5] Pireddu, A., Bruzzone, S. (2022). An analysis of road accident models based on tunnel lengths and accident variables. Proceedings of the Piarc 2nd International Conference on Road Tunnel Operations and Safety & VIII Spanish Symposium. Granada. Volume II, 372-388. (ISBN:978-84-95641-48-9).
[6] Nævestad, T.O., Meyer, S. (2014). A survey of vehicle fires in Norwegian road tunnels 2008–2011. Tunnelling and Underground Space Technology, 41: 104-112. https://doi.org/10.1016/j.tust.2013.12.001
[7] Pervez, A., Huang, H., Han, C., Wang, J., Li, Y. (2020). Revisiting freeway single tunnel crash characteristics analysis: A six-zone analytic approach. Accident Analysis & Prevention, 142: 105542. https://doi.org/10.1016/j.aap.2020.105542
[8] Hollò, P., Eksler, V., Zukowska, J. (2010). Road safety performance indicators and their explanatory value: A critical view based on the experience of Central European countries. Safety Science, 48(9): 1142-1150. http://dx.doi.org/10.1016/j.ssci.2010.03.002
[9] Xing, Y., Lu, J., Wang, C. (2015). Single vehicle traffic accidents in Shanghai river-crossing tunnels. Proceedings of the Information Technology and Mechatronics Engineering Conference (ITOEC 2015). http://dx.doi.org/10.2991/itoec-15.2015.45
[10] Istituto Nazionale di Statistica (Istat) e Automobile Club d’Italia (ACI). Incidenti stradali in Italia. (2018). Comunicato Stampa. Italia: Istat. https://www.istat.it/it/archivio/232366, accessed on Jan. 9, 2022.
[11] Istituto Nazionale di Statistica (Istat) e Automobile Club d’Italia (ACI). Incidenti stradali in Italia. (2019). Comunicato Stampa. Italia: Istat. https://www.istat.it/it/archivio/245757, accessed on Jan. 9, 2022.
[12] Istituto Nazionale di Statistica (Istat) e Automobile Club d’Italia (ACI). Incidenti stradali in Italia. (2020). Comunicato Stampa. Italia: Istat. https://www.istat.it/it/archivio/259825, accessed on Jan. 9, 2022.
[13] European Parliament. (2004). Directive 2004/54/EC of the European Parliament and of the Council of 29 April 2004 on minimum safety requirements for tunnels in the Trans-European Road Network.
[14] European Parliament. (2008). Directive 2008/96/EC of the European Parliament and of the Council on Road. Infrastructure Safety Management.
[15] Decreto Legislativo 5 ottobre 2006, n. 264: Attuazione della direttiva 2004/54/CE in materia di sicurezza per le gallerie della rete stradale transeuropea. (2006).
[16] Ministero delle Infrastrutture e dei Trasporti. (2006). Decreto 28 ottobre 2005. Sicurezza nelle gallerie ferroviarie.
[17] Breiman, L., Friedman, J.H., Olshen, R.A., Stone, C.J. (1984). Classification and regression trees. Biometrics, 40(3): 874. https://doi.org/10.2307/2530946
[18] Pireddu, A., Bruzzone, S. (2021). An analysis of the influence of tunnel length and road type on road accident variables. Rivista di Statistica Ufficiale, 2: 71-102. Roma, Italy: Istat. https://www.istat.it/it/files//2021/10/RSU_2_2021_Article-3.pdf.
[19] Pireddu, A., Bruzzone, S. (2019). Incidenti in Gallerie Stradali. Fact Sheet. Roma, Italia: Istituto Nazionale per l’Assicurazione contro gli Infortuni sul Lavoro. Inail. https://www.inail.it/cs/internet/docs/alg-pubbl-incidenti-in-gallerie-stradali.pdf.
[20] Caliendo, C., De Guglielmo, M.L., Russo, I. (2019). Analysis of crash frequency in motorway tunnels based on a correlated random-parameters approach. Tunnelling and Underground Space Technology, 85: 243-251. http://dx.doi.org/10.1016/j.tust.2018.12.012
[21] Lemke, K. (2000). Road safety in tunnels. Transportation Research Record: Journal of the Transportation Research Board, 1740(1): 170-174. https://doi.org/10.3141/1740-22
[22] Pireddu, A., Lombardi, M., Bruzzone, S., Berardi, D. (2022). Risk-based tunnel design for consequences of road accidents: The role of tunnel length. WIT Transactions on the Built Environment, 214: 71-81. https://doi.org/10.2495/SSR220061
[23] Borghetti, F., Frassoldati, A., Derudi, M., Lai, I., Trinchini, C. (2020). Safety in road tunnels: Accident data analysis of the Italian motorway A24 and A25. Chemical Engineering Transactions, 82: 307-312. https://doi.org/10.3303/CET2082052
[24] Subotić, M., Softić, E., Radičević, V., Bonić, A. (2022). Modeling of operating speeds as a function of longitudinal gradient in local conditions on two-lane roads. Mechatronics and Intelligent Transportation Systems, 1(1): 24-34. https://doi.org/10.56578/mits010104
[25] Zhou, J.M., Wei, H.X., Zhao, Y.Z., Ma, Y.J. (2023). China-Europe container multimodal transport path selection based on multi-objective optimization. Mechatronics and Intelligent Transportation Systems, 2(2): 72-88. https://doi.org/10.56578/mits020203