Virginia P. Sisiopiku*![]() | Wencui Yang
| Wencui Yang![]() | Justin Mason
| Justin Mason![]() | Brandy McKinney
| Brandy McKinney![]() | Seung Woo Hwangbo
| Seung Woo Hwangbo![]() | Sherrilene Classen
| Sherrilene Classen![]()
© 2023 IIETA. This article is published by IIETA and is licensed under the CC BY 4.0 license (http://creativecommons.org/licenses/by/4.0/).
OPEN ACCESS
Autonomous vehicles (AV) have the potential to improve mobility, enhance traffic safety, and provide societal benefits. To date, users’ attitudes toward the adoption of AVs have been mainly extracted from questionnaire surveys among participants that were not directly exposed to AVs. Thus, there is a need to (a) record users' opinions toward AVs before and after they are exposed to the technology, and (b) investigate how demographic factors affect these perceptions and attitudes. This paper compared the attitudes of drivers (N=101) toward AVs before and after being exposed to an interactive, high-fidelity driving simulator that replicated the AV user experience. The analysis examined differences within and between age groups (younger, middle-aged, and older adults) with respect to Intention to Use, Barriers, and Acceptance. Investigation of the gender-related impacts was also performed and documented. The results provided evidence that the perceptions and attitudes of AVs from older and middle-aged adults significantly improved after driving simulator exposure. Older participants and females showed the greatest positive changes in Intention to Use, Barriers, and Acceptance. The study further showcased the value of exposing users to an AV driving simulator as an efficient way to promote users’ acceptance of AV technology.
autonomous driving simulator, autonomous vehicle intention to use, barriers, acceptance, pre-post study, age differences, gender differences
Recent technological advancements in the area of Autonomous Vehicles (AVs) hold promise toward improving traffic congestion, safety, and the well-being of road users [1]. However, it remains unclear whether drivers will embrace AVs as a form of transportation of choice, especially given that drivers currently have limited to no exposure to AVs. Therefore, this study was designed to assess and quantify the drivers’ perceptions, insights, and attitudes of AVs before and after exposure to a driving simulator operating in an autonomous mode. Compared to surveys alone, a pre-post study with lived experiences of drivers experiencing a simulator in autonomous mode, in combination with surveys, can more accurately reveal the perceptions of drivers before and after “driving” the autonomous simulator [2-7].
The aim of the study is to understand the adoption practices of drivers from different age groups (younger, middle-aged, and older) and genders (male and female). Using statistical methods including t-tests and one-way analysis of variance (ANOVA) the study sheds light on the facilitators and barriers of each group in adopting the AV technology. Specifically, the study addresses the following research questions: (a) Are there gender-related differences in perceptions and attitudes of study participants toward AVs at the baseline as well as after exposure to driving simulator? (b) Are there age-related differences in perceptions and attitudes of participants toward AV at the baseline as well as after exposure to driving simulator? (c) Does Intention to Use; Perceived Barriers, and AV Acceptance change with exposure to autonomous driving simulator (pre-post analysis)? By addressing these questions, the study can inform engineers, and AV developers of facilitators and obstacles that affect drivers’ interaction with AV, and potential adoption of such technologies in the future.
The remainder of the paper is structured as follows: Section 2 reviews existing studies that examined the effects of age and gender on users’ acceptance of AV technologies. Section 3 introduces the data, materials, and methods used in the study. Section 4 presents the results of our analysis. Section 5 discusses the significance of our findings and the strengths and limitations of the study. Section 6 concludes with the implications for practice and policy-making.
To date, several studies that used questionnaire surveys to examine transportation users’ perceptions of AVs considered impacts of age and gender on users’ attitudes toward the adoption of AVs. Recent reviews by Gkartzonikas and Gkritza [8], and Becker and Axhausen [9], and other studies [10-21] identified links between age and/or gender and drivers’ acceptance of AVs, however, findings and conclusions vary from study to study.
2.1 Gender and AV acceptance
Hohenberger et al. [22] reported that males (vs females) were more likely to relate positive emotions with AVs; and that younger women and older men had more anxiety associated with willingness to use AVs. Becker and Axhausen [9] also reported that male drivers tend to show a more positive attitude toward AV technology use than females. Charness et al. [23] surveyed acceptance practices in 441 adults toward AVs and found that gender played a significant role in attitudes towards AVs. They reported that females (vs males) showed a lower eagerness to adopt AVs and males reported a greater willingness to relinquish driving control. Bansal et al. [13] reported that high-income males had more interest in AVs, compared to drivers from other demographic groups considered in the study. However, Schoettle and Sivak [24] found no significant gender differences pertaining to AV preferences.
2.2 Age and AV acceptance
Becker and Axhausen [9] summarized findings from a review of 10 studies that investigated the impact of age on AV acceptance. One study reported a positive correlation of AV acceptance with age [14] whereas other studies found no significant impacts from age differences [25, 26]. Moreover, Becker and Axhausen noted that younger adults in urban settings and those in possession of a vehicle with AV technologies showed a more positive attitude toward AV technology use [9]. Lee et al. [27] conducted a survey of 3,505 adults (16-75+ years of age), and found that older adults were less comfortable with higher levels of automation. Similar findings were reported by Abraham et al. [10] based on analysis of a survey of roughly 3,000 drivers which revealed that perceived comfort with AV technology decreased with age. Bansal and Kockelman [12] surveyed 1,088 adults in Texas and found that older people had a lower interest in accepting all levels of vehicle automation. Rovira et al. [28] conducted a survey of 138 participants (86 younger and 52 older adults) and concluded that there were few age differences in the measure of trust of AVs. Similarly, an online survey of 3,097 drivers conducted by the Texas A&M Transportation Institute found no correlation between age and acceptance or intent to use AVs [29]. Overall, the literature shows mixed findings on older driver acceptance of AVs. Some published studies suggest that old age is a negative predictor of AV acceptance practices [24, 30] while others indicate that older adults have the greatest level of acceptance for AVs, even if they are reluctant to adopt AVs [31]. A handful of studies found that middle-aged adults have greater acceptance of AVs compared to younger and older adults in the study [32].
2.3 Discussion
In addition to age and gender, other factors, such as technology readiness [33, 34] and AV exposure [6, 7, 35], may also affect people’s acceptance and willingness to use AVs. In a recent study, Dennis et al. [36] compared survey responses from 153 autonomous shuttle riders with 236 non-riders in Las Vegas and found that autonomous shuttle riders, young, and male participants had more positive perceptions about AVs than non-riders.
While the literature review provides some useful insights on age and gender as predictors of AV likely acceptance, many of the studies reported limitations related to unbalanced age groups, small sample sizes, and other study assumptions that make generalizations of study findings challenging. Another concern is that the majority of available studies lack exposure of study participants to AV technology. The handful of studies that exposed subjects to the technology used autonomous shuttles that are available only at limited markets.
The motivation behind this study was to address these gaps by using a realistic autonomous driving simulator to conduct a pre-post study of drivers’ perceptions and attitudes toward AVs. Being one of the first studies in the US to examine age and gender impacts on drivers’ attitudes and preferences toward AVs after exposure to a driver simulator, the study aims at revealing important foundational information about drivers’ intention to use AVs, perceived barriers to AV technology adoption, and acceptance practices across the driving lifespan and along gender lines.
This study obtained and analyzed information on the perceptions of Florida drivers (N=101) toward AVs before and after they had a lived experience with AV in an autonomous high fidelity driving simulator. An Autonomous Vehicle User Perception Survey (AVUPS) was used to collect the pre-post exposure responses of the participants [37]. The study received approval by the University of Florida Institutional Review Board (IRB#201801988; IRB#202000464) and participants provided their consent to participate in the study. We recruited participants through community partner interactions, flyers placed in community settings, and social media groups. Participation criteria included age (18 years of age or older), driving status (had driven in the last 6 months), residence location (North Central Florida), and cognitive ability (< 18 on the Montreal Cognitive Assessment).
To prevent, minimize, or mitigate the occurrence of simulator sickness, we implemented a standardized simulator sickness protocol as detailed in the study [38]. The research team offered dietary recommendations to participants prior to their participation in the driving simulator experiment, ensured a comfortable temperature-controlled environment (72℉), provided a 5-min acclamation period prior to the start of actual simulation ride, and used a Motion Sickness Assessment Questionnaire (MSAQ) for subjects to self-report symptoms of sweatiness, queasiness, dizziness, and nauseousness. Study participants did not experience any major discomforts when exposed to the driving simulator in this study and there was no attrition of participants due to simulation sickness.
Due to the pandemic, a COVID-19 protocol for participants’ visits to the simulator lab was developed to meet the Centers for Disease Control and Prevention guidelines. More specifically, participants wore personal protective equipment and practiced social distancing throughout the study visits. The driving simulator and other research equipment were sanitized before and after each use and disposable seat covers covered the driver’s seat in the driving simulator car cab. The research team conducted temperature checks of all participants and excluded from the study any participant that had a temperature of >98.6℉. As a result of the rigorous testing and precautions taken, there were no reported cases of COVID-19 during and/or after the data collection.
The study team used pre-visit and post-visit surveys to quantify the perceptions of drivers (N=101) before and after being exposed to “driving” a simulator in autonomous mode, with a scenario specifically designed for this study. Each participant completed a psychometrically sound baseline survey and a post-visit survey (same content as the baseline survey) after being exposed to the driving simulator in autonomous mode and was compensated for participation with a VISA gift card [39]. The study included three different age cohorts, i.e., younger (18-39 years of age; N=34), middle-aged (40-64 years of age; N=17), and older drivers (> 65 years of age; N=50). Trained project staff collected and entered the data into the Research Electronic Data Capture (REDCap) data management system [40].
Analysis of the responses identified differences before and after exposure, by age group, and by gender. The premise of the study was that overall Intention to Use will increase, perceived Barriers will reduce, and Acceptance of AV technology will increase across the lifespan after exposure to the AV technology. With respect to age effects, our hypothesis was that older drivers’ perceptions would show the greatest magnitude of change. Finally, we hypothesized that women participants would demonstrate more positive changes in acceptance of AV technology after exposure compared to men.
3.1 Driving simulator
The Realtime Technologies Inc. (RTI) high fidelity simulator was used in the study (Figure 1). This driving simulator is a multi-sensory simulator, integrated into a full car cab with 7 HD visual channels and 3 forward channels creating a 180° field of view. It offers additional visual display channels, high fidelity graphic resolution, component modeling, steering feedback, spatialized audio with realistic engine, transmission, wind and tire noises, and an autopilot feature to turn the simulator into AV mode.
Figure 1. RTI high fidelity simulator with operator’s station
3.2 Driving simulation scenario
The driving simulation scenario for this study started with a 5-minute acclimation drive for the adaptation to the driving simulation environment. The autopilot feature was used next, enabled for a 10-minute automated drive (SAE Level 4) in the driving simulator. Participants sat in the driver’s seat and were instructed to ride in the scenario without taking over manual control. The simulator environment represented a low to moderate speed (15-35 mph) residential and suburban area with realistic road infrastructure, buildings, ambient traffic— and the system handling all aspects of the designated driving task as detailed in the study [2]. An operator can control and monitor all aspects of the experiment.
3.3 Measures
Data collection occurred via capturing participants’ demographic data and survey responses using the Automated Vehicle User Perception Survey (AVUPS) [39]. Demographics included age, gender, ethnicity, education, marriage status, employment status, and health conditions. The AVUPS uses a visual analog scale consisting of 28 items (from 0; disagree to 100; agree) and four open-ended items. AVUPS measures nine subdomains (intention to use, trust, usefulness, ease of use, safety, control, and driving efficacy, cost, authority, and social influence) categorized into three subscales, i.e., Intention to Use, Barriers, and the total Acceptance score of AV technology. Intention to Use included items such as “I am open to the idea of using automated vehicles”, “I believe I can trust automated vehicles”, “I expect that automated vehicles will be easy to use”, and “I feel safe riding in an automated vehicle”. Barriers included items such as “I am suspicious of automated vehicles”, “My driving abilities will decline due to relying on an automated vehicle”, and “It will require a lot of effort to figure out how to use an automated vehicle”. Item responses were averaged into their respective dimensions which produced dimension scores ranging from 0 (negative perceptions of AVs) to 100 (positive perceptions of AVs). The total Acceptance score was a weighted sum of intention to use, barriers, and well-being. The construct of AVUPS is detailed in the study [39].
The AVUPS was administered twice, first for the baseline survey and a second time after participants’ exposure to the driving simulator in autonomous mode. Survey validation, AVUPS construct validity, and AVUPS test-retest reliability are detailed in the study [3, 41].
Descriptive statistics for participant demographics and driving habits were displayed as frequency (%), mean (M), and standard deviation (SD). Data analyzed by nonparametric tests were displayed as the median and interquartile range (IQR). Data analysis assumptions were assessed via box plot methods (outlier), Shapiro-Wilk test & QQ plot (normality), and Levene's test (homogeneity of variance). Violated assumptions were detailed in the results. Non-parametric tests, such as the Wilcoxon test and Kruskal-Wallis test, were used as the alternatives to a t-test and the ANOVA.
The analysis was performed in three steps: (a) analysis of responses from baseline survey (pre-exposure), (b) analysis of responses from survey after exposure to the driving simulator (AV mode), and (c) comparison before and after exposure to the driving simulator. A series of independent t-tests examined differences in responses between males and females across the three AVUPS scores (i.e., Intention to Use, Barriers, and Acceptance). A series of ANOVAs and one-way analysis of covariance (ANCOVAs) evaluated the age effects (young, middle-aged, older drivers) on the three AVUPS scores.
Post-hoc tests were deployed to study differences among age groups. A series of paired t-tests were used to explore the differences between the baseline and after exposure to the simulator for both age and gender groups. A series of three-way (age, gender, and time) mixed ANOVAs were conducted to investigate the interactions between gender and age at the baseline and after exposure to the simulator.
Data were analyzed in RStudio [42] using R version 4.0.2 [43], the tidyverse ecosystem [44] and rstatix package [45]. An alpha level of .05 was set a-priori and was not adjusted for multiple comparisons since the post-hoc tests were only conducted among the age group. A summary of demographic information of the study participants is provided in Table 1.
Table 1. Demographic data for study participants (N=101)
|
Factor |
Value |
Frequency (%) |
|
Age |
Young (18-39 years of age) |
34 (34%) |
|
Middle-aged (40-64 years of age) |
17 (17%) |
|
|
Older (65+ years of age) |
50 (49%) |
|
|
Gender |
Male |
45 (45%) |
|
Female |
56 (55%) |
|
|
Ethnicity |
African-American or Black |
10 (10%) |
|
Asian/Pacific Islander |
18 (18%) |
|
|
Caucasian or White |
64 (63%) |
|
|
Hispanic or Latino |
5 (5%) |
|
|
Multiracial |
1 (1%) |
|
|
Other |
3 (3%) |
|
|
Education |
High school graduate or equivalent |
3 (8%) |
|
Some college credits |
16 (16%) |
|
|
Trade/Technical/Vocational |
1 (1%) |
|
|
Associate’s degree |
11 (11%) |
|
|
Bachelor’s degree |
28 (28%) |
|
|
Master’s degree |
28 (28%) |
|
|
Doctorate/Professional degree |
14 (14%) |
|
|
Marital Status |
Single, never married |
34 (34%) |
|
Married/domestic partnership |
52 (51%) |
|
|
Widowed |
7 (7%) |
|
|
Divorced |
8 (8%) |
|
|
Employment |
Part-time |
12 (12%) |
|
Full-time |
15 (15%) |
|
|
Retired |
47 (47%) |
|
|
Student |
24 (24%) |
|
|
Unable to work |
3 (3%) |
4.1 Descriptive results
Acceptance at baseline and after exposure to the simulator are displayed in Table 2 and Table 3 for the gender group and the age group, respectively.
Table 2. Descriptive statistics of AVUPS by gender group
|
|
AVUPS |
Female |
Male |
||
|
Mean |
SD |
Mean |
SD |
||
|
Baseline |
Intention to Use |
68.80 |
13.86 |
71.02 |
13.80 |
|
Barriers |
66.65 |
19.73 |
66.74 |
16.49 |
|
|
Acceptance |
66.28 |
14.13 |
68.18 |
14.26 |
|
|
After AV Simulator Exposure |
Intention to Use |
73.76 |
14.69 |
70.99 |
16.70 |
|
Barriers |
75.48 |
16.58 |
67.24 |
18.25 |
|
|
Acceptance |
71.72 |
14.75 |
67.84 |
16.39 |
|
4.2 Baseline analysis results
A series of t-tests were conducted to examine differences between males and females for three AVUPS domains (i.e., Intention to Use, Barriers, and Acceptance) at baseline. In addition, a series of ANOVAs were performed to evaluate the age effect on the three AVUPS domains.
4.2.1 Intention to use
The t-tests revealed that there was no significant difference for Intention to Use between males and females: t (99)=-0.802, p=0.424. However, the one-way ANOVA revealed that there are significant differences among age groups: F (2,98)=3.397, p=0.037, ηg2=0.065. The Tukey post-hoc tests revealed that the older group had a greater Intention to Use score than the middle-aged group (p=0.031) while there were no differences between the young and middle-aged group (p=0.092), and the young and older group (p=0.908).
Table 3. Descriptive statistics of AVUPS for age group
|
AVUPS |
Young (18-39 years) |
Middle-aged (40-64 years) |
Older (65+ years) |
|||
|
Mean |
SD |
Mean |
SD |
Mean |
SD |
|
|
Baseline |
||||||
|
Intention to Use |
70.60 |
13.83 |
62.11 |
14.28 |
71.85 |
12.98 |
|
Barriers |
64.81 |
16.77 |
61.88 |
22.13 |
69.61 |
17.68 |
|
Acceptance |
66.74 |
14.19 |
58.88 |
13.96 |
70.19 |
13.26 |
|
After AV Simulator Exposure |
||||||
|
Intention to Use |
72.60 |
15.22 |
66.83 |
17.94 |
74.41 |
14.85 |
|
Barriers |
67.61 |
17.68 |
70.38 |
20.49 |
75.15 |
16.44 |
|
Acceptance |
68.40 |
15.30 |
63.69 |
16.74 |
73.22 |
14.75 |
4.2.2 Barriers
The t-tests for Barriers revealed no difference between males and females: t (99)=-0.026, p=0.979. Likewise, the one-way ANOVA revealed that there are no significant differences among age groups for Barriers: F (2,98)=1.418, p=0.247, ηg2=0.028.
4.2.3 Acceptance
The t-tests for Acceptance revealed that there is no significant difference between males and females: t (99)=-0.669, p=0.505. The one-way ANOVA revealed that there are significant differences among age groups for Acceptance: F (2,98)=4.346, p=0.016, ηg2 =0.081. The Tukey post-hoc tests revealed that the older group has a greater score than the middle-aged group (p=0.011); but no differences exist between the young and middle-aged group (p=0.135), and the young and older group (p=0.496).
4.3 Analysis results after exposure to driving simulator
A similar statistical analysis was performed for survey data collected after exposure to the driving simulator in AV mode. A series of Wilcoxon tests were conducted to examine the differences between males and females across the three AVUPS study domains (i.e., Intention to Use, Barriers, and Acceptance). Moreover, a series of one-way ANOVAs or ANCOVAs were performed to quantify the age effects across the three AVUPS domains.
4.3.1 Intention to use
The Wilcoxon tests for Intention to Use (Shapiro-Wilk test for males: p=0.016) revealed that there is no significant difference between males and females: p=0.456. The one-way ANCOVA revealed that, after adjusting for the baseline score of Intention to Use, there were no significant differences among age groups: F (2,97)=0.37, p=0.692, ηg2=0.008.
4.3.2 Barriers
The Wilcoxon tests for Barriers (Shapiro-Wilk test for males: p=0.028 and for females: p=0.023) revealed that females vs. males have a higher score (i.e., fewer barriers) after exposure to the driving simulator: p=0.022. The one-way ANOVA showed no significant differences among age groups: F (2,98)=1.928, p=0.151, ηg2=0.038.
4.3.3 Acceptance
The Wilcoxon tests for Acceptance (Shapiro-Wilk test for males: p=0.005) revealed that there is no significant difference between males and females: p=0.356. The one-way ANCOVA confirmed that, after adjusting for the baseline score of Acceptance, there are no significant differences among age groups: F (2,97)=0.529, p=0.591, ηg2=0.011.
4.4 AVUPS score comparisons before and after the AV driving simulator exposure
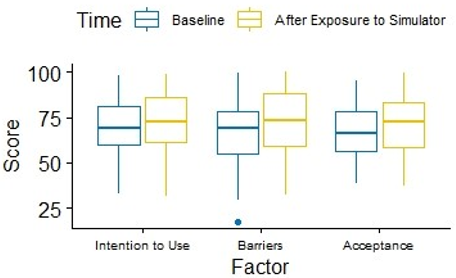
Comparisons between pre-exposure results and post-exposure results confirmed that study participants’ perceptions and attitudes changed after being exposed to “driving” the autonomous simulator. When considering responses of all participants combined (N=101), the Wilcoxon tests for Intention to Use (Shapiro-Wilk test: p=0.031) revealed that the scores after exposure to the driving simulator are significantly higher than those from the baseline (p < 0.001). Similarly, the t-tests for Barriers revealed that the scores after exposure to the simulator are significantly higher than the baseline: t (100)=-3.540, p < 0.001. The Wilcoxon tests for Acceptance (Shapiro-Wilk test: p=0.003) revealed that the scores after exposure to the simulator are significantly higher than the baseline: p < 0.001. Figure 2 displays the Intention to Use, Barriers, and Acceptance domain score differences before and after exposure to the driving simulator in AV Mode.
Figure 2. AVUPS domain score differences before and after exposure to AV simulator
4.4.1 Differences based on age group
The score change between baseline (pre-exposure) and post-exposure to the simulator in AV mode was examined for Intention to Use, Barriers, and Acceptance among the three age groups: young (n=34), middle-aged (n=17) and older drivers (n=50). The analysis showed that Barriers and Acceptance of AV technology of middle-aged and older users were positively impacted after exposure to the driving simulator. Moreover, older users reported higher scores on Intention to Use following exposure to the driving simulator compared to baseline. No significant changes were observed for young drivers.
More specifically, for the young age group, the t-tests revealed that there are no significant differences between the baseline and after the exposure to the simulator for Intention to Use: t (33)=-1.316, p=0.099 and for Barriers: t (33)=-1.166, p=0.126. Also, the Wilcoxon tests for Acceptance (Shapiro-Wilk test: p=0.002) revealed that there was no significant difference between the baseline and after the exposure to the simulator: p=0.072.
For the middle-aged group, the t-tests for Intention to Use revealed that there is no significant difference between the baseline and after the exposure to the driving simulator: t (16)=-1.543, p =0.071. However, the t-tests for Barriers revealed that the scores after exposure to the simulator are significantly higher than the baseline: t (16)=-1.936, p=0.035. The t-tests for Acceptance revealed that the scores after exposure to the simulator are significantly higher than the baseline: t (16)=-1.831, p=0.043.
For the older group, the t-tests for Intention to Use revealed that the scores after exposure to the driving simulator are significantly higher than the baseline: t (49)=-2.597, p=0.006. The Wilcoxon tests for Barriers (Shapiro-Wilk test: p=0.024) revealed that the scores after exposure to the simulator are significantly higher than the baseline: p=0.011. The t-tests for Acceptance revealed that the scores after exposure to the simulator are significantly higher than the baseline: t (49)=-2.745, p=0.004.
4.4.2 Differences based on gender
For males, the Wilcoxon tests (Shapiro-Wilk test for Intention to Use: p=0.009, for Barriers: p=0.042, and for Acceptance: p < 0.001) revealed that there are no significant differences between baseline and after exposure to the simulator for Intention to Use: p=0.228, for Barriers: p=0.604, and for Acceptance: p=0.579. For females, however, the t-tests revealed that the scores after exposure to the simulator are significantly higher than the baseline for Intention to Use: t (55)=-4.026, p < 0.001, for Barriers: t (55)=-4.541, p < 0.001, and for Acceptance: t (55)=-4.723, p < 0.001.
4.4.3 Differences based on age and gender groups
We also examined the percentage of score change between baseline (pre-exposure) and after exposure to the simulator in AV mode for Intention to Use, Barriers, and Acceptance among young, middle-aged, and older group; and between male and female participants. For age groups, the one-way ANOVA for Intention to Use revealed that there is no difference: F (2,98)=0.909, p=0.406, ηg2=0.018. The Kruskal-Wallis tests (Shapiro-Wilk test for Barriers: older group (p <0.001; Shapiro-Wilk test for Acceptance: older group (p=0.001) and young group (p=0.012)) displayed no differences for Barriers: X2(2)=2.366, p=0.306 or for Acceptance: X2(2)=0.914, p=0.633. For gender groups, a series of Wilcoxon tests were performed. These included Shapiro-Wilk tests for Intention to Use: males (p < 0.001), Shapiro-Wilk tests for Barriers: males (p=0.003) and females (p < 0.001), Shapiro-Wilk tests for Acceptance: males (p < 0.001).
Overall, the analysis revealed that the changes for female participants are greater than males for Intention to Use: p=0.005, for Barriers: p < 0.001, and for Acceptance: p < 0.001.
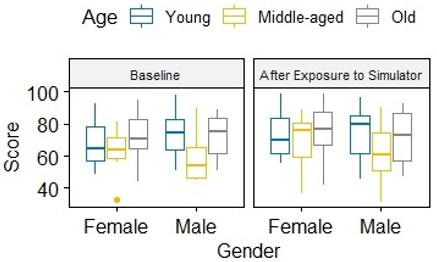
4.5 Interactions between gender and age before and after exposure to the AV simulator
Figure 3, Figure 4, and Figure 5 display scores for Intention to Use, Barriers, and Acceptance by gender and age at the baseline and after exposure to the simulator in AV mode, respectively.
The three-way mixed ANOVA revealed no interactions between gender and age at the baseline and after exposure to the simulator for Intention to Use: F (2,95)=0.129, p=0.879, ηg2 < 0.001, for Barriers: F (2,95)=2.304, p=0.105, ηg2=0.007, or for Acceptance: F (2,95)=0.856, p=0.428, ηg2=0.002.
Figure 3. Intention to use by gender and age at the baseline and after exposure to the simulator
Figure 4. Barriers by gender and age at the baseline and after exposure to the AV simulator
Figure 5. Acceptance by gender and age at the baseline and after exposure to the AV simulator
In this study, we examined differences in AVUPS scores (Intention to Use, Barriers, and Acceptance) at (a) baseline, and (b) after exposure to a driving simulator in AV mode for all study participants combined as well as by age group and gender. We also formulated and tested three hypotheses, based on inputs from the literature review and our past and current findings on drivers’ acceptance practices of AVs in the studies [2, 3, 39, 41].
The first hypothesis postulated that participants would demonstrate an increase in Intention to Use, a reduction in perceived Barriers, and an increase in Acceptance of AV technology after exposure to the AV technology (vs. pre-exposure). Our hypothesis was validated as the AVUPS scores after exposure to the simulator in AV mode are tested (the Wilcoxon tests for Intention to Use, t-tests for Barriers, and Wilcoxon tests for Acceptance) to be significantly higher than that at the baseline.
Our second hypothesis was that older drivers’ perceptions would have the greatest magnitude of change (vs. middle-aged and younger adults) after exposure to driving simulator in AV mode. The results from the analysis confirmed our assumption. We found that older adults have greater acceptance towards AVs when compared to other age groups (young and middle-aged drivers) after exposure to the simulator in AV mode. Moreover, for the older group, the t-tests for Intention to Use revealed that the scores after exposure to the driving simulator are significantly higher than the baseline: t (49)=-2.597, p=0.006, whereas no statistically significant differences were observed for middle-aged and young drivers. Compared to previous studies that were driven by surveys only (including but not limited to [19, 30, 41]), our study also confirmed that lived experiences with AVs have an impact on people’s understanding of the potential usefulness or ease of use of AVs, and that such impact varies among different age groups.
Our third hypothesis postulated that women participants would demonstrate more positive changes in acceptance of AV technology after exposure to the technology (vs. men). The findings validated the assumption. For female participants, the t-tests revealed that the scores after exposure to the driving simulator were significantly higher than those from the baseline for Intention to Use, Barriers, and Acceptance whereas no statistically significant differences were observed for male participants. Similar to the reported findings in the study [46, 47], our study also confirmed that gender differences do exist when different age cohorts are exposed to AV technology. We concluded that gender differences in the context of AV technology perceptions vary by age, and recommend that the gender-age impacts be further examined in follow-up studies to better understand their role in predicting AV acceptance.
5.1 Strengths
This study analyzed the perceptions of a larger sample of participants (N=101) than earlier studies, with a valid and reliable AVUPS. There was a good representation of participants in the three age group cohorts considered (young: 34%, middle-aged: 17%, and older: 49%) and among genders (male: 45%, female: 55%). There was no attrition as a result of driving simulation exposure and simulator sickness. Based on the rigorous COVID-19 protection protocol implemented for the participants and study personnel, no one reported being infected during or after this study. The study findings reveal important foundational information about Intention to Use AVs, Barriers to AV technology, and driver Acceptance of AV technology. Particularly, we have generated knowledge related to adults’ perceptions of AVs before and after exposure and the role of age and/or gender on Intention to Use, Barriers, and Driver Acceptance of AVs. The AVUPS developed and used in this study and the methods used for analysis and interpretation of findings can be replicated by researchers undertaking future studies to understand drivers’ perceptions, values, beliefs, and attitudes as determinants of AV use.
5.2 Limitations
The study demographics indicate that the participants had an uneven age distribution, were majorly white and highly educated. As such, estimates of the study could have been affected by the convenience sampling method and the selection bias of the participants. The study was conducted in the midst of the pandemic and the rigorous protocols implemented in the study, although protective, could have deterred some from participating. Likewise, others who would have enrolled, may have abstained as a result of fear of exposure to the COVID virus. Therefore, the study findings are only generalizable to study participants and settings that fit the demographic profile and context of this study.
5.3 Contributions
Compared to the use of questionnaire surveys alone, a pre-post study that exposures participants to AVs can more accurately reveal the perceptions, or hesitations of drivers before and after “driving” the autonomous simulator. This paper demonstrates this approach and describes procedures that can be used to collect, analyze, compare, and interpret information about drivers’ perceptions, values, beliefs, and attitudes pertaining to AV technologies throughout the lifespan. The study findings can inform scientists, manufacturers, and engineers of effective strategies to enhance AV acceptance and adoption practices among drivers, which, in turn, hold great promise toward increasing traffic safety and mobility of users.
5.4 Future work
Building on this effort, additional studies are encouraged to expand the scope of the research and validate study findings using data from other locations and research settings. In particular, it is recommended that future studies consider geographical differences of study participants as well as address limitations of the current work related to potential selection bias due to convenience sampling and uneven age distribution and homogeneity of the sample. Moreover, future research should consider examining other factors that may influence AV acceptance besides age and gender and employing longitudinal designs to track changes in perceptions over time. The scope of the work reported herein was limited to participants without disabilities. Future work should also examine perceptions and attitudes of adults with disabilities toward adoption of AV technologies to determine if disability status influenced perceptions of AV.
The aim of the study was to understand the AV adoption practices of drivers from different age groups (younger, middle-aged, and older) and genders (male and female). In doing so, we used a validated AVUPS to study the perceptions of 101 younger, middle-aged, and older drivers before and after being exposed to a driving simulator running in autonomous mode. Prior to exposure to AV technology, older adults had a greater score for Intention to Use and Acceptance compared to middle-aged participants. Other than that, no significant differences were observed between other combinations of age groups or genders. After exposure to the driving simulator operating in autonomous mode, female participants had fewer perceived barriers to accepting the AV technology compared to males. Comparison of scores for Intention to Use, Barriers, and Acceptance before and after the AV technology exposure for all participants combined, revealed that all scores increased after the exposure. Groups that showed greater positive changes in AVUPS scores after exposure to AV included older adults and females.
The findings can be useful to stakeholders of the AV industry as they imply that lived experiences via exposure to “driving” a simulator in autonomous mode can increase user acceptance and reduce perceived barriers pertaining to AV technology. This, in turn, is expected to result in an increased likelihood of the adoption of AV technologies and successful implementation. Thus, AV developers can consider the use of driving simulators to introduce AV technologies to skeptical users as part of their marketing practices to promote use of AV technologies in the future. The findings from the study can also help transportation planners and decision-makers to gain a better understanding of the factors that influence the acceptance and adoption of AVs and guide their efforts to develop plans and policies in support of AV deployment in the future. Exposure to AV technology along with education and encouragement initiatives targeting older adults and females are needed to remove current perceived barriers and better prepare users for future AV adoption.
The authors do not have any conflict of interest with other entities or researchers.
This work was sponsored by a grant from the US Department of Transportation (USDOT) through the Southeastern Transportation Research, Innovation, Development, and Education Center (STRIDE; Projects D2 and A3). The University of Florida Institute for Mobility, Activity and Participation (UF I-MAP) provided infrastructure and support for this study. The University of Alabama at Birmingham Transportation Engineering and Development (TREND) Lab provided support for the data analysis.
[1] DOT Chief Chao urges AV community to educate the public (Press release) (2018). UVSI News. https://www.auvsi.org/dot-chief-chao-urges-av-community-educate-public, accessed on Feb. 21, 2022
[2] Classen, S., Mason, J., Wersal, J., Hwangbo, S.W., Rogers, J. (2021). UF & UAB’s phase I demonstration study: Older driver experiences with autonomous vehicle technology (No. Project D2). Southeastern Transportation Research, Innovation, Development and Education Center (STRIDE).
[3] Classen, S., Mason, J., Wersal, J., Sisiopiku, V., Rogers, J. (2020). Older drivers' experience with automated vehicle technology: Interim analysis of a demonstration study. Frontiers in Sustainable Cities, 2: 27. https://doi.org/10.3389/frsc.2020.00027
[4] Hartwich, F., Witzlack, C., Beggiato, M., Krems, J.F. (2019). The first impression counts–A combined driving simulator and test track study on the development of trust and acceptance of highly automated driving. Transportation Research Part F: Traffic Psychology and Behaviour, 65: 522-535. https://doi.org/10.1016/j.trf.2018.05.012
[5] Mok, B., Sirkin, D., Sibi, S., Miller, D., Ju, W. (2017). Understanding driver–automated vehicle interactions through wizard of oz design improvision. Proceedings of the 8th International Driving Symposium on Human Factors in Driver Assessment, Training and Vehicle Design. http://dx.doi.org/10.17077/drivingassessment.1598
[6] Automotive emerging technologies study results (Press release). J.D. Power https://www.jdpower.com/business/press-releases/2013-us-automotive-emerging-technologies-study, accessed on Mar. 15, 2022.
[7] Xu, Z., Zhang, K., Min, H., Wang, Z., Zhao, X., Liu, P. (2018). What drives people to accept automated vehicles? Findings from a field experiment. Transportation Research Part C: Emerging Technologies, 95: 320-334. https://doi.org/10.1016/j.trc.2018.07.024
[8] Gkartzonikas, C., Gkritza, K. (2019). What have we learned? A review of stated preference and choice studies on autonomous vehicles. Transportation Research Part C: Emerging Technologies, 98: 323-337. https://doi.org/10.1016/j.trc.2018.12.003
[9] Becker, F., Axhausen, K.W. (2017). Literature review on surveys investigating the acceptance of automated vehicles. Transportation, 44(6): 1293-1306. https://doi.org/10.1007/s11116-017-9808-9
[10] Abraham, H., Lee, C., Brady, S., Fitzgerald, C., Mehler, B., Reimer, B., Coughlin, J.F. (2017). Autonomous vehicles and alternatives to driving: Trust, preferences, and effects of age. In Proceedings of the Transportation Research Board 96th Annual Meeting, Washington, DC: Transportation Research Board, pp. 8-12.
[11] Anania, E.C., Rice, S., Walters, N.W., Pierce, M., Winter, S.R., Milner, M.N. (2018). The effects of positive and negative information on consumers’ willingness to ride in a driverless vehicle. Transport Policy, 72: 218-224. https://doi.org/10.1016/j.tranpol.2018.04.002
[12] Bansal, P., Kockelman, K.M. (2018). Are we ready to embrace connected and self-driving vehicles? A case study of Texans. Transportation, 45: 641-675. https://doi.org/10.1007/s11116-016-9745-z
[13] Bansal, P., Kockelman, K.M., Singh, A. (2016). Assessing public opinions of and interest in new vehicle technologies: An Austin perspective. Transportation Research Part C: Emerging Technologies, 67: 1-14. https://doi.org/10.1016/j.trc.2016.01.019
[14] Haboucha, C.J., Ishaq, R., Shiftan, Y. (2017). User preferences regarding autonomous vehicles. Transportation Research Part C: Emerging Technologies, 78: 37-49. https://doi.org/10.1016/j.trc.2017.01.010
[15] Hulse, L.M., Xie, H., Galea, E.R. (2018). Perceptions of autonomous vehicles: Relationships with road users, risk, gender and age. Safety Science, 102: 1-13. https://doi.org/10.1016/j.ssci.2017.10.001
[16] Madigan, R., Louw, T., Dziennus, M., Graindorge, T., Ortega, E., Graindorge, M., Merat, N. (2016). Acceptance of automated road transport systems (ARTS): an adaptation of the UTAUT model. Transportation Research Procedia, 14: 2217-2226. https://doi.org/10.1016/j.trpro.2016.05.237
[17] Only 18 per cent of Britons believe driverless cars to be an important development for the car industry to focus on. Ipsos. https://www.ipsos.com/en-uk/only-18-cent-britons-believe-driverless-cars-be-important-development-car-industry-focus, accessed on Feb. 4, 2022.
[18] Pakusch, C., Stevens, G., Boden, A., Bossauer, P. (2018). Unintended effects of autonomous driving: A study on mobility preferences in the future. Sustainability, 10(7): 2404. https://doi.org/10.3390/su10072404
[19] Payre, W., Cestac, J., Delhomme, P. (2014). Intention to use a fully automated car: Attitudes and a priori acceptability. Transportation Research Part F: Traffic Psychology and Behaviour, 27: 252-263. https://doi.org/10.1016/j.trf.2014.04.009
[20] Rödel, C., Stadler, S., Meschtscherjakov, A., Tscheligi, M. (2014). Towards autonomous cars: The effect of autonomy levels on acceptance and user experience. In Proceedings of the 6th International Conference on Automotive User Interfaces and Interactive Vehicular Applications, pp. 1-8. https://doi.org/10.1145/2667317.2667330
[21] Venkatesh, V., Morris, M.G., Davis, G.B., Davis, F.D. (2003). User acceptance of information technology: Toward a unified view. MIS Quarterly, 27(3): 425-478. https://doi.org/10.2307/30036540
[22] Hohenberger, C., Spörrle, M., Welpe, I.M. (2016). How and why do men and women differ in their willingness to use automated cars? The influence of emotions across different age groups. Transportation Research Part A: Policy and Practice, 94: 374-385. https://doi.org/10.1016/j.tra.2016.09.022
[23] Charness, N., Yoon, J.S., Souders, D., Stothart, C., Yehnert, C. (2018). Predictors of attitudes toward autonomous vehicles: The roles of age, gender, prior knowledge, and personality. Frontiers in Psychology, 9: 2589. https://doi.org/10.3389/fpsyg.2018.02589
[24] Schoettle, B., Sivak, M. (2015). Motorists' preferences for different levels of vehicle automation. University of Michigan, Ann Arbor, Transportation Research Institute.
[25] Krueger, R., Rashidi, T.H., Rose, J.M. (2016). Preferences for shared autonomous vehicles. Transportation Research Part C: Emerging Technologies, 69: 343-355. https://doi.org/10.1016/j.trc.2016.06.015
[26] Kyriakidis, M., Happee, R., de Winter, J.C. (2015). Public opinion on automated driving: Results of an international questionnaire among 5000 respondents. Transportation Research Part F: Traffic Psychology and Behaviour, 32: 127-140. https://doi.org/10.1016/j.trf.2015.04.014
[27] Lee, C., Seppelt, B., Reimer, B., Mehler, B., Coughlin, J.F. (2019). Acceptance of vehicle automation: Effects of demographic traits, technology experience and media exposure. In Proceedings of the Human Factors and Ergonomics Society Annual Meeting, 63(1): 2066-2070. http://dx.doi.org/10.1177/1071181319631425
[28] Rovira, E., McLaughlin, A.C., Pak, R., High, L. (2019). Looking for age differences in self-driving vehicles: examining the effects of automation reliability, driving risk, and physical impairment on trust. Frontiers in Psychology, 10: 800. https://doi.org/10.3389/fpsyg.2019.00800
[29] Williams, T., Wagner, J., Morgan, C., Hall, K., Sener, I. N., Stoeltje, G., Pang, H. (2017). Transportation planning implications of automated/connected vehicles on Texas highways (No. FHWA/TX-16/0-6848-1). Texas A&M Transportation Institute.
[30] Kaye, S.A., Lewis, I., Buckley, L., Gauld, C., Rakotonirainy, A. (2020). To share or not to share: A theoretically guided investigation of factors predicting intentions to use fully automated shared passenger shuttles. Transportation Research Part F: Traffic Psychology and Behaviour, 75: 203-213. https://doi.org/10.1016/j.trf.2020.10.010
[31] Nordhoff, S., de Winter, J., Madigan, R., Merat, N., van Arem, B., Happee, R. (2018). User acceptance of automated shuttles in Berlin-Schöneberg: A questionnaire study. Transportation Research Part F: Traffic Psychology and Behaviour, 58: 843-854. https://doi.org/10.1016/j.trf.2018.06.024
[32] Liljamo, T., Liimatainen, H., Pöllänen, M. (2018). Attitudes and concerns on automated vehicles. Transportation Research Part F: Traffic Psychology and Behaviour, 59: 24-44. https://doi.org/10.1016/j.trf.2018.08.010
[33] Parasuraman, A. (2000). Technology Readiness Index (TRI) a multiple-item scale to measure readiness to embrace new technologies. Journal of Service Research, 2(4): 307-320. https://doi.org/10.1177/109467050024001
[34] Parasuraman, A., Colby, C.L. (2015). An updated and streamlined technology readiness index: TRI 2.0. Journal of Service Research, 18(1): 59-74. https://doi.org/10.1177/1094670514539730
[35] Helgath, J., Braun, P., Pritschet, A., Schubert, M., Böhm, P., Isemann, D. (2018). Investigating the effect of different autonomy levels on user acceptance and user experience in self-driving cars with a VR driving simulator. In: Marcus, A., Wang, W. (eds) Design, User Experience, and Usability: Users, Contexts and Case Studies. DUXU 2018. Lecture Notes in Computer Science, vol 10920. Springer, Cham. https://doi.org/10.1007/978-3-319-91806-8_19
[36] Dennis, S., Paz, A., Yigitcanlar, T. (2021). Perceptions and attitudes towards the deployment of autonomous and connected vehicles: Insights from Las Vegas, Nevada. Journal of Urban Technology, 28(3-4): 75-95. https://doi.org/10.1080/10630732.2021.1879606
[37] SAE On-Road Automated Vehicle Standards Committee. (2014). Taxonomy and definitions for terms related to on-road motor vehicle automated driving systems. SAE Standard J, 3016(1): 1-16.
[38] Classen, S., Hwangbo, S.W., Mason, J., Wersal, J., Rogers, J., Sisiopiku, V.P. (2021). Older drivers’ motion and simulator sickness before and after automated vehicle exposure. Safety, 7(2): 26. https://doi.org/10.3390/safety7020026
[39] Mason, J., Classen, S., Wersal, J., Sisiopiku, V. (2021). Construct validity and test–retest reliability of the automated vehicle user perception survey. Frontiers in Psychology, 12: 626791. https://doi.org/10.3389/fpsyg.2021.626791
[40] Harris, P.A., Taylor, R., Minor, B.L., Elliott, V., Fernandez, M., O'Neal, L., McLeod, L., Delacqua, G., Delacqua, F., Kirby, J., Duda, S.N., REDCap Consortium. (2019). The REDCap consortium: Building an international community of software platform partners. Journal of Biomedical Informatics, 95: 103208. https://doi.org/10.1016/j.jbi.2019.103208
[41] Mason, J., Classen, S., Wersal, J., Sisiopiku, V.P. (2020). Establishing face and content validity of a survey to assess users’ perceptions of automated vehicles. Transportation Research Record, 2674(9): 538-547. https://doi.org/10.1177/0361198120930225
[42] RStudio Team. (2020). RStudio: Integrated development for R. RStudio. PBC, Boston, MA. USA.
[43] R Core Team. (2020). R: A language and environment for statistical computing. R Foundation for Statistical Computing, Vienna, Austria.
[44] Wickham, H., Averick, M., Bryan, J., Chang, W., McGowan, L.D.A., François, R., Grolemund, G., Hayes, A., Henry, L., Hester, J., Kuhn, M., Pedersen, T.L., Miller, E., Bache, S.M., Müller, K., Ooms, J., Robinson, D., Seidel, D.P., Spinu, V., Takahashi, K., Vaughan, D., Wilke, C., Woo, K., Yutani, H. (2019). Welcome to the Tidyverse. Journal of Open Source Software, 4(43): 1686. https://doi.org/10.21105/joss.01686
[45] Kassambara, A. (2020). Rstatix: Pipe-friendly framework for basic statistical tests. R package version 0.6. 0.
[46] Loeb, H., Belwadi, A., Maheshwari, J., Shaikh, S. (2019). Age and gender differences in emergency takeover from automated to manual driving on simulator. Traffic Injury Prevention, 20(sup2): S163-S165. https://doi.org/10.1080/15389588.2019.1661677
[47] Sheng, S., Pakdamanian, E., Han, K., Kim, B., Tiwari, P., Kim, I., Feng, L. (2019). A case study of trust on autonomous driving. In 2019 IEEE Intelligent Transportation Systems Conference (ITSC), Auckland, New Zealand, pp. 4368-4373. https://doi.org/10.1109/ITSC.2019.8917251