Muhammad Alif Fauzi | Fanny Widadie | Isti Khomah*
© 2026 The authors. This article is published by IIETA and is licensed under the CC BY 4.0 license (http://creativecommons.org/licenses/by/4.0/).
OPEN ACCESS
This study examines the food security of aquaculture households in Brebes Regency, which is affected by coastal abrasion, where food security is defined as access to sufficient, safe, and nutritious food. Due to the impact of abrasion, coastal communities face difficulties in meeting their nutritional needs, prompting this research to investigate the proportion of food expenditure, energy consumption, and socioeconomic factors influencing energy consumption, and to evaluate the household food security status. A descriptive research method was employed, with purposive sampling for site selection and snowball sampling for respondent selection. Primary and secondary data were collected through interviews, record-keeping, 24-hour dietary recall, and documentation. The average proportion of food expenditure reached 59.84%, indicating that a substantial share of household expenditure was allocated to food consumption. However, household energy consumption was still inadequate at only 79.87%. Socio-economic factors that significantly influenced energy consumption included household size and income. A majority of the aquaculture households affected by coastal abrasion in Brebes Regency, amounting to 81.67%, had not yet achieved food security. This is primarily due to worsening coastal abrasion, which has led to the destruction of fishponds and a decline in primary aquaculture income. Limited income has compelled most households to prioritize food expenditures, ultimately restricting their access to adequate nutrition sources.
aquaculture livelihoods, coastal vulnerability, household resilience, environment, socio-economic conditions
To survive, humans require food, which is one of the most essential basic needs. This requirement is linked to household consumption behavior regarding food expenditure allocation, a factor heavily influenced by income levels [1]. In the context of Law Number 18 of 2012, the term “food security” refers to a condition in which households can access sufficient food, both in quantity and quality, at affordable prices. Food must also be safe for consumption and culturally acceptable following social and cultural norms, to promote a productive and healthy lifestyle. This aligns with the Sustainable Development Goals (SDGs) program, which emphasizes the importance of food security. Food security is a global issue under SDG 2, which is a key goal of Sustainable Development [2]. This aligns with the SDGs program, which emphasizes the importance of food security. Robust food security is a condition in which the entire population has physical, social, and economic access to sufficient, safe, and nutritious food [3]. Nutritional adequacy in the household can be seen from the quality and ability of the household to access the food [4].
Oceans around the world contribute approximately 70% to the provision of living food sources, such as fish, which supply protein to the human population [5]. This means a strong dependence on marine resources, and this pressure poses a risk to food security in the region [6]. Small-scale fisheries act as a cornerstone of food security and socio-economic resilience in coastal areas of developing countries, supporting both livelihoods and family nutrition [7].
Indonesia is one of the countries endowed with abundant marine and coastal resources. This attracts human attention due to the diverse products provided by coastal and marine ecosystems [8]. Its coastal and shoreline areas cover approximately 95,181 km², with mangrove forests spanning 3,489,140.68 hectares [9]. The abundance of natural resources provides significant benefits to various economic sectors, such as fisheries, tourism, forestry, and others. The availability of rich marine and fishery resources greatly supports food security and the growth of the fisheries sector [10, 11]. As an archipelagic country, Indonesia’s fisheries sector has a substantial economic impact on society, contributing not only to food security but also to job creation.
The OECD further states that by 2030, developing countries are expected to enhance the economic benefits derived from the sustainable use and management of fisheries and aquaculture, where sustainability indicators serve as the backbone for monitoring progress toward the SDGs at the local, national, and global levels [12]. Globally, consumption of protein from marine animals is projected to continue to increase, in part due to public health awareness, making aquaculture a key industry [13]. This significant potential to meet national food needs can be found in both capture fisheries and aquaculture.
Central Java Province has extensive potential for aquaculture in both brackish and marine waters. Its strategic location has led many coastal communities in Central Java to rely on aquaculture and fishing as their primary sources of livelihood. Common aquaculture commodities cultivated in the region include shrimp, milkfish, snapper, mullet, and crab [10].
In 2022, Brebes Regency recorded the highest volume of brackish water aquaculture production in Central Java, reaching 74,996 kg. Overall, this aquaculture production was documented in the Central Java 2024 report. The high availability of production potentially serves as an indicator of regional protein sufficiency and food security. However, such conditions do not necessarily guarantee a household’s food security. In line with Rachman’s research, food security at the regional level does not always ensure food security within households [14].
Coastal communities generally rely on the fisheries sector for their livelihoods, particularly aquaculture households. On the other hand, global warming has emerged as a pressing environmental issue in recent years. One of the impacts experienced by coastal communities, especially in Brebes Regency, is coastal abrasion. Abrasion is a process of erosion caused by waves and wind, which can damage the shoreline, lead to coastal degradation, and potentially trigger natural disasters such as tidal flooding. Coastal environments are highly vulnerable to the negative impacts of abrasion. This situation is particularly concerning considering that small-scale aquaculture is the main foundation for coastal food security, livelihoods, and social resilience [15]. Coastal abrasion, particularly along the northern coast of Java (Pantura), has caused significant changes to the shoreline due to continuous erosion by ocean currents and waves [16]. This phenomenon has adversely affected aquaculture farmers, yet it is unavoidable. Furthermore, extreme environmental changes such as abrasion continue to increase the vulnerability of this sector, threatening the long-term sustainability of this resource, which is a primary source of protein and income for the community [17]. Such conditions compel the farmers to adapt to survive amid the uncertainty of their livelihoods [10].
The area most severely affected by abrasion along the northern coast of Java is Brebes Regency, with a total of 2,218.23 hectares lost since 1995. Abrasion has undoubtedly caused severe damage to coastal regions. The losses experienced by residents extend beyond environmental degradation and have significantly impacted the local economy, particularly in areas such as Brebes Regency, where the loss of productive land due to abrasion has brought considerable hardship to many residents [18]. The data indicate that most of the land has been lost due to abrasion, particularly affecting agricultural areas, including aquaculture land. This situation has inevitably disrupted aquaculture production for the farmers in Brebes Regency.
The impact of abrasion is most severely felt by coastal communities exposed to large waves, as it can cause substantial losses through the destruction of local fish ponds. Year after year, abrasion reveals a significant correlation between the level of vulnerability to coastal erosion and the degree of food security in a region. Households located in coastal areas typically experience food insecurity [19]. Damage to fish ponds experienced by aquaculture farmers leads to a decline in income. This occurs due to the reduction in the availability of fish pond land [20].
The level of food security is affected by limited access to sustainable income, as natural phenomena can lead to a sudden drop in food prices, quickly triggering an acute food security emergency [21]. Low productivity among fishers results in low household income, which in turn affects household expenditure patterns, making it difficult to meet basic needs, both food-related and non-food essentials such as education and healthcare [22]. This condition not only threatens the food security of aquaculture households but also negatively impacts the quality of food consumed. The ability of aquaculture farmers to access nutritious and diverse food is directly affected by declining income levels. Low income can lead to inadequate living conditions and make it more difficult to meet basic nutritional needs. Food security often becomes a major challenge for households facing poor economic conditions, as the majority of their income is spent on food and other basic necessities. Economic growth, according to demand theory, is supported by the recovery of consumption driven by declining inflation, increased income, social transfers, and rising investment [23]. Food security is a key indicator that must be addressed globally as part of mechanisms to ensure household income levels are sufficient to purchase food, guarantee food supply, and protect the ecological environment of agriculture [24]. Therefore, a household’s income level significantly influences the ability to choose nutritious food.
2.1 Basic research method and location selection
Descriptive analysis serves as the fundamental methodology in this study. This method aims to provide an objective and accurate depiction based on the data collected. The descriptive study was conducted by identifying and describing the characteristics that form the focus of the research within a specific context [25].
The research location was selected purposively, namely in Brebes Regency. Purposive sampling is a technique in which the researcher selects samples based on specific criteria and considerations [25]. The villages chosen for this study were Kaliwlingi Village, Randusanga Wetan Village, and Randusanga Kulon Village, all located in Brebes Subdistrict. These locations were selected because of their significant contribution to the total area most affected by coastal abrasion.
2.2 Sampling and data collection
Respondents were then selected using a snowball sampling method, as a clear sampling frame for abrasion-affected aquaculture farmers was not available. Initial respondents were selected based on predetermined criteria: residents of abrasion-affected areas, those who had experienced the impacts of abrasion directly, and those familiar with conditions in the surrounding communities. Furthermore, initial respondents provided recommendations to other respondents who met the research criteria. The process continued through participant referrals until the desired sample size was achieved [26, 27]. A total of 60 respondents were selected, with each village represented by 20 respondents. The samples were chosen based on the criterion that at least one household member works as an aquaculture farmer and owns a pond affected by abrasion. The sample size of 60 respondents provides adequate statistical power for the multiple linear regression, exceeding the minimum requirement of 35 observations for seven independent variables. Although this sample cannot be generalized to all farmers in Brebes Regency, it accurately represents the targeted sub-population of highly vulnerable households in the most severely abraded villages. To mitigate referral bias from a single social network, initial respondents were purposefully selected from diverse socio-economic backgrounds and different hamlets to create multiple independent referral chains.
In this study, a household was classified as affected by coastal erosion if it owned or managed a fish farm that experienced physical impacts due to shoreline erosion, including partial or complete loss of the farm area, damage to the farm embankment, or seawater intrusion that disrupted fish farming activities. Identification of affected households was based primarily on respondents' direct experiences and confirmed during field observations and discussions with village officials and local community leaders familiar with the history of erosion in the study area.
This study used questionnaires to obtain primary data. Secondary data were collected from references, such as books, online sources, the Central Bureau of Statistics (BPS), and relevant government agencies, including the Department of Fisheries and Marine Affairs and the Department of Food and Security. Data collection methods included interviews, observation, data record-keeping, 24-hour recall, and document analysis. Methode 24-hour recall has been widely used in academic circles working in the field of food security and nutrition, especially in developing countries [28].
2.3 Data analysis
The first analysis was the calculation of the proportion of food consumption expenditure to total household expenditure, using the following formula in Eq. (1) [29].
$P F=\frac{P P}{T P} \times 100 \%$ (1)
where,
PF: Proportion of food consumption expenditure in total household expenditure (%).
PP: Food consumption expenditure (idr/month).
TP: Total household expenditure on food and non-food items in abrasion-affected households (IDR/month).
A cross-classification comparing the percentage of food expenditure and household energy adequacy can be used to analyze household food security. The calculation of household energy adequacy was conducted using the following formula Eq. (2) [30]:
$G e j=\frac{B j}{100} \times \frac{B D D j}{100} \times K G e j$ (2)
where,
Gej: Amount of energy consumed from food item j (kcal).
Bj: Weight of food item j consumed (grams).
BDDj: Edible portion percentage of food item j.
KGej: Energy content of food item j per 100 grams, based on the Indonesian food composition table (DKBM) (kcal/gram).
In the assessment of quantitative food consumption, the energy consumption level (ECL) as Eq. (3) was used as a parameter, calculated using the following formula:
$E C L=\frac{\sum Energy \,\, consumption }{ Recommended \,\, energy \,\, intake \,({REI})} \times 100 \%$ (3)
The classification of energy adequacy levels is as follows:
Adequate: ECL ≥ 100% REI
Moderate: ECL 81–99% REI
Insufficient: ECL 70–80% REI
Deficit: ECL < 70 REI
The next stage of analysis involved multiple linear regression, which includes classical assumption testing and hypothesis testing as part of the analytical method. The classical assumption tests covered normality, multicollinearity, and heteroscedasticity. These tests ensured that the samples were representative and that the analysis results were accurate. Multicollinearity was detected through the values of the Variance Inflation Factor (VIF) and tolerance, with the criteria for no multicollinearity of VIF < 10 and tolerance >0.1. A random spread of points on the scatterplot indicated the absence of heteroscedasticity. Hypothesis testing included the coefficient of determination (R²), the F-test, and the t-test. The coefficient of determination reflects the ability of the independent variables to explain the variation in the dependent variable [25]. The purpose of the F-test is to evaluate the simultaneous effect of all independent variables on the dependent variable, while the t-test assesses the partial effect of each independent variable in Eq. (4).
$Y=\beta 0+\beta 1 X 1+\beta 2 X 2+\beta 3 X 3+\beta 4 X 4+\beta 5 X 5+\beta 6 X 6+\beta 7 D 7+e^{\prime \prime}$ (4)
where,
Y: Energy consumption of the aquaculture farmer household affected by abrasion (kcal)
β0: constanta
β1…βn: Regression coefficients
X1: Household size (persons)
X2: Household income (idr/month)
X3: Age of housewife (years old)
X4: Education level of housewife (years)
X5: Pond area (m2)
X6: Area affected by abrasion (m2)
D: Dummy variable, knowledge of balanced nutrition (1 = understands balanced nutrition, 0 = does not understand balanced nutrition)
e: Standard error
After understanding the proportion of household food expenditure and energy consumption, household food security was then analyzed using the cross-classification method [30], as shown in Table 1.
Table 1. Cross-classification of food security
|
Energy Consumption Per Unit |
Share of Food Expenditure |
|
|
Low (<60% of Total Expenditure) |
High (≥60% of Total Expenditure) |
|
|
Adequate (>80% of REI) |
Food secure |
Food vulnerable |
|
Inadequate (≤80% of REI) |
Food insufficient |
Food insecure |
3.1 Household income
The total amount of money earned by each family member through their work is referred to as household income. This income may come from both primary occupations and side jobs, which are among the many ways families generate earnings. The following section presents a comparison of farmers’ income from aquaculture and non-aquaculture activities, as shown in Table 2.
The average monthly income from aquaculture activities was IDR 4,591,333, accounting for 71.54% of total household income. However, the phenomenon of coastal abrasion forced respondents, who are coastal communities, to diversify their income sources. Damage to fish ponds caused by abrasion led to crop failure and the loss of fish fingerlings, directly reducing income from aquaculture. As a result, additional income from non-aquaculture sources, amounting to IDR 1,826,327 per month (28.46%), became crucial for sustaining livelihoods. These additional income sources included self-employment (such as traders and tailors), factory workers, construction laborers, civil servants, and private sector employees. Household income significantly influences food consumption patterns. High-income households tend to prioritize food quality alongside quantity to enhance their family members' nutritional intake. Consequently, such households are more likely to achieve food security [31].
Table 2. Comparison of aquaculture household income
|
Income Source |
Average Income (IDR/Month) |
Percentage (%) |
|
Income from aquaculture |
4,591,333.00 |
71.54 |
|
Income from non-aquaculture |
1,826,327.00 |
28.46 |
|
Total |
6,417,660.00 |
100 |
3.2 Household food and non-food expenditure
Household expenditure refers to the total amount of money spent to meet the needs of all family members. These expenditures are generally categorized into two types: food-related expenses and non-food-related expenses.
Based on Table 3, the highest food expenditure was on tobacco and betel, amounting to IDR 638,305 or 31.76% of total food spending. The second highest was on cereals, with an average of IDR 273,983 per month, or 13.63%. The total average monthly food expenditure per household was IDR 2,009,780, accounting for 59.84% of total household spending. Notably, spending on tobacco and betel exceeded that on basic necessities, particularly rice and protein sources [32]. This indicates that farmers' awareness of nutritious foods is still very low [33].
Table 3. Food expenditures of respondent households
|
No. |
Food Expenditure |
Average (IDR/Month) |
Percentage (%) |
|
1. |
Cereals |
273,983.00 |
13.63 |
|
2. |
Tubers |
34,325.00 |
1.71 |
|
3. |
Fish |
90,333.00 |
4.49 |
|
4. |
Meats |
125,300.00 |
6.23 |
|
5. |
Eggs and dairy |
190,483.00 |
9.48 |
|
6. |
Vegetables |
108,000.00 |
5.37 |
|
7. |
Legumes |
95,617.00 |
4.76 |
|
8. |
Fruits |
55,133.00 |
2.74 |
|
9. |
Oils and fats |
35,483.00 |
1.77 |
|
10. |
Beverages |
82,067.00 |
4.08 |
|
11. |
Spices and seasonings |
62,042.00 |
3.09 |
|
12. |
Other food items |
61,908.00 |
3.08 |
|
13. |
Processed food and beverages |
156,800.00 |
7.80 |
|
14. |
Tobacco and betel |
638,305.00 |
31.76 |
|
Total Food Expenditure |
2,009,780.00 |
100 |
|
Referring to Table 4, the highest non-food household expenditure was on education, amounting to IDR 367,972 per month or 27.28% of total non-food spending. The second highest was on various goods and services, with an average of IDR 313,406 per month or 23.24%. The total average monthly non-food expenditure per household was IDR 1,348,831, representing 40.16% of total household expenditure.
Table 4. Non-food expenditures of respondent households
|
No. |
Non-Food Expenditure |
Average (IDR/Month) |
Percentage (%) |
|
1. |
Housing |
297,044.00 |
22.02 |
|
2. |
Various goods and services |
313,406.00 |
23.24 |
|
3. |
Education expenses |
367,972.00 |
27.28 |
|
4. |
Healthcare expenses |
134,334.00 |
9.96 |
|
5. |
Clothing |
45,900.00 |
3.40 |
|
6. |
Durable goods |
40,483.00 |
3.00 |
|
7. |
Taxes and insurance |
66,392.00 |
4.92 |
|
8. |
Social needs |
83,300.00 |
6.18 |
|
Total Non-Food Expenditure |
1,348831,00 |
100 |
|
3.3 Proportion of household food expenditure
The comparison between food expenditure and total household expenditure reflects the percentage of income spent on food consumption. A previous study [34] indicated that high-income households allocate a smaller proportion of their spending to food compared to non-food expenditure.
Table 5. Proportion of respondent household expenditure
|
Expenditure |
Average (IDR/Month) |
Proportion (%) |
|
Food expenditure |
2,009,780.00 |
59.84 |
|
Non-food expenditure |
1,348,831.00 |
40.16 |
|
Total |
3,358,611.00 |
100 |
Table 6. Distribution of food expenditure proportion categories among respondent households
|
Category |
Proportion of Food Expenditure |
Number of Households |
Percentage (%) |
|
High |
≥60% of total household expenditure |
37 |
61.66 |
|
Low |
≤60% of total household expenditure |
23 |
38.34 |
|
Total |
60 |
100 |
|
As shown in Table 5, the total household expenditure of respondents amounted to IDR 3,358,611, with 59.84% allocated to food expenses (IDR 2,009,780) and 40.16% to non-food expenses (IDR 1,348,831). The percentage of expenditure allocated to food decreases as income rises [35]. Households with high economic status are able to purchase adequate food for their families, whereas low-income households face limited purchasing power regarding both quantity and quality, leading to food insecurity [19]. Therefore, households need to manage their finances wisely to avoid such a condition. This aligns with Engel’s Law, which shows a negative correlation with food security: the higher the proportion of food expenditure in total spending, the lower the level of food security [36].
The distribution of food expenditure proportions in Table 6 showed that 37 households, or 61.66%, fell into the high-expenditure category. Field observations revealed that food spending accounted for a larger share of total household expenditure compared to non-food spending. This phenomenon indicates that the respondent aquaculture households are still experiencing relatively low levels of welfare. A household’s economic access to food is significantly influenced by its overall well-being, which in turn affects both the quantity and quality of food consumed.
3.4 Household energy consumption level
Food consumption is measured by analyzing the household ECL, which is based on the amount of food consumed by individuals to meet both their basic food needs and the energy requirements derived from that food. The assessment of food consumption was conducted within a 24-hour recall period following the respondents' food intake. The data were then converted into energy values using portion size estimation and the Indonesian Food Composition Table.
Based on the data in Table 7, the respondents' ECL was 79.87%, which fell into the “insufficient” category according to the Nutritional Consumption Level classification set by the Ministry of Health [37]. Respondent households were categorized as having insufficient consumption because their energy intake reached only 70-80% of the recommended energy intake. While the recommended daily energy intake for a household was 7,231.78 kcal, the actual average daily energy consumption among the respondent households was only 5,747.91 kcal. The actual daily per capita energy consumption reached only 1,704.74 kcal, whereas the recommended energy intake per person was 2,146.69 kcal. Most of the household energy needs were met through cereals, particularly rice, serving as the primary energy source. However, other nutritional needs remained inadequately fulfilled, resulting in overall energy consumption that fell below the required energy intake.
The independent t-test analysis functions as a comparative test to determine whether there is a statistically significant difference in the means [25]. The data analysis using SPSS produced a significance value (2-tailed) of 0.000, which is less than 0.05. This indicates a significant difference between the recommended energy intake and the actual energy consumption at both the household and individual respondent levels.
Table 7. Recommended energy intake, energy consumption, and energy consumption level (ECL) of households
|
Description |
Energy (kcal/day) |
|
|
Household |
Individual |
|
|
Recommended energy intake |
7,231.67 |
2,146.78 |
|
Respondents’ energy consumption |
5,747.91 |
1,704.74 |
|
ECL (%) |
79.87 |
79.87 |
|
Paired Sample t-test Sig. (2-tailed) |
0.000 |
0.000 |
Table 8. Recommended energy intake and actual energy consumption by age group in respondent households
|
Group |
Age |
Respondent |
Recommended Energy Intake |
Average Actual Energy |
Energy Consumption Level |
|
Children |
1–3 |
4 |
1,350.00 |
1,307.13 |
96.82 |
|
4–6 |
7 |
1,400.00 |
1,420.86 |
101.49 |
|
|
7–9 |
7 |
1,650.00 |
1,637.69 |
99.25 |
|
|
Male |
10–12 |
2 |
2,000.00 |
1,632.15 |
81.61 |
|
13–15 |
2 |
2,400.00 |
1,682.90 |
70.12 |
|
|
16–18 |
4 |
2,650.00 |
1,556.90 |
58.75 |
|
|
19–29 |
16 |
2,650.00 |
1,878.25 |
70.88 |
|
|
30–49 |
32 |
2,550.00 |
1,733.59 |
67.98 |
|
|
50–64 |
28 |
2,150.00 |
1,822.60 |
84.77 |
|
|
65–80 |
2 |
1,800.00 |
1,370.95 |
76.16 |
|
|
Female |
10–12 |
4 |
1,900.00 |
1,660.55 |
87.40 |
|
13–15 |
5 |
2,050.00 |
1,752.24 |
85.48 |
|
|
16–18 |
12 |
2,100.00 |
1,763.14 |
83.96 |
|
|
19–29 |
18 |
2,250.00 |
1,874.88 |
83.33 |
|
|
30–49 |
38 |
2,150.00 |
1,674.31 |
77.88 |
|
|
50–64 |
19 |
1,800.00 |
1,629.17 |
90.51 |
|
|
65–80 |
1 |
1,550.00 |
1,189.60 |
76.75 |
Table 9. Distribution of household energy consumption level (ECL)
|
No. |
Category |
Energy Consumption Level |
Number of Households |
Percentage (%) |
|
1. |
Adequate |
ECL ≥ 100% REI |
4 |
6.67 |
|
2. |
Moderate |
ECL 81–99% REI |
22 |
36.67 |
|
3. |
Insufficient |
ECL 70–80% REI |
21 |
35.00 |
|
4. |
Deficit |
ECL < 70% REI |
13 |
21.67 |
|
Total |
60 |
100 |
||
The average energy intake across all age groups remained below the recommended level, as shown in Table 8. However, only the group of children aged four to six years consumed an adequate amount of energy. On average, children’s ECLs reached around 90% of the recommended intake. Female respondents, on average, reached 80% of the recommended energy intake, which fell into the “moderate” category. Meanwhile, the average ECL among male respondents was above 70% of the recommended intake, placing them in the “insufficient” category.
Table 9 shows that the majority of respondent households (36.67%) fell into the moderate category (ECL < 81–99% of REI), followed by 35.00% in the insufficient category (ECL 70–80% of REI), 21.67% in the deficit category (ECL < 70% of REI), and only 6.67% in the adequate category (ECL ≥ 100% of REI). These findings indicate that the ECL of most respondent households remains below the optimal threshold. Income instability and limited dietary diversity were the main factors contributing to low energy consumption. This aligns with Engel’s Law, which suggests that as income increases, individuals tend to shift toward food with higher nutritional quality, even though such foods often come at a higher cost per unit of nutrition [38].
3.5 The impacts of socioeconomic factors on household energy consumption in coastal households
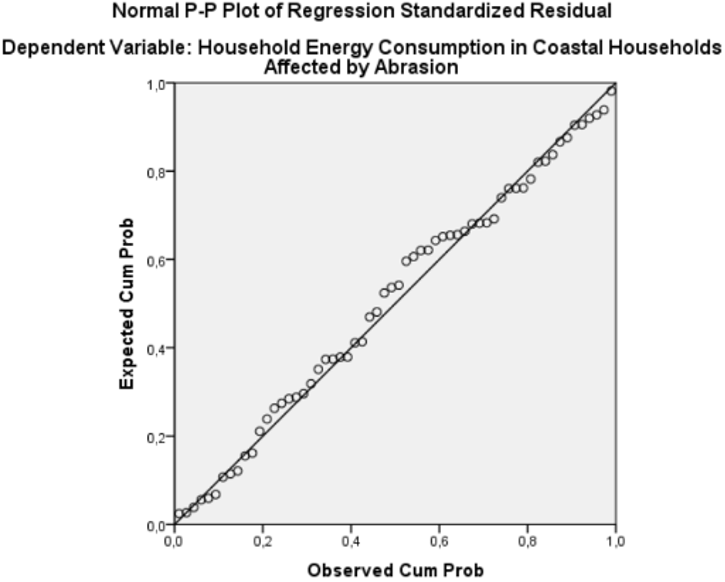
The normality test was used to determine whether the residuals, or disturbance variables, in the regression model were normally distributed. This was assessed using a normal P-Plot. The following figure presents the graphical results of the normality test using a P-P plot.
Figure 1. Normal P-P plot of normality test results
Table 10. Results of the One-Sample Kolmogorov-Smirnov (K-S) test
|
Test Statistic |
Unstandardized Residual |
|
Asymp. Sig. (2-tailed) |
0.200 |
The P-P plot (Figure 1) showed that the sample points were scattered along the diagonal line, indicating that the data were normally distributed. The fulfillment of the normality assumption in the regression model was reflected in the distribution of errors around the straight line. To ensure the validity of the test, the One-Sample Kolmogorov-Smirnov (K-S) test was also employed (Table 10).
The significance level for decision-making was set at α = 5% or 0.05. Based on the decision-making criteria using the Asymp. Sig. (2-tailed) value, if Asymp. Sig. (2-tailed) > α, then the data are considered to be normally distributed. The analysis results showed that the Asymp. Sig. (2-tailed) value was 0.200, which was greater than α. Therefore, it could be concluded that the data were normally distributed.
An ideal regression model should not exhibit perfect or near-perfect correlation among the independent variables. To assess the presence of multicollinearity in the regression model, the tolerance and VIF values can be seen in the table of coefficients.
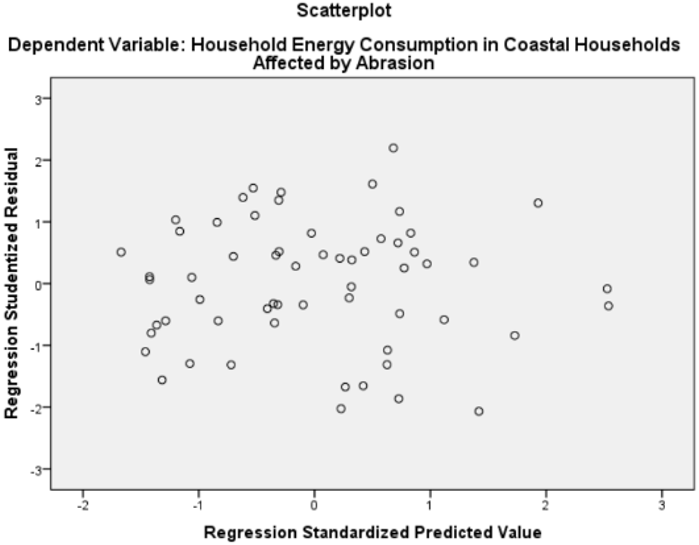
The test results in Table 11 show that all independent variables yielded tolerance and VIF values that met the acceptable criteria, indicating the absence of multicollinearity. The heteroscedasticity test was conducted by analyzing the scatterplot pattern, as illustrated in Figure 2. The data are considered free from heteroscedasticity if the data points are randomly scattered and do not form a specific pattern, indicating that the variance of the residuals is stable across observations.
The analysis results indicate that the points in the scatterplot were randomly scattered without forming a specific pattern. This distribution suggests that the data were free from heteroscedasticity. The dispersion of points around zero on the horizontal axis further confirmed the absence of heteroscedasticity.
Table 11. Results of the multicollinearity test
|
No |
Variable |
Collinearity Statistics |
|
|
Tolerance |
VIF |
||
|
1 |
Household size |
0.879 |
1.138 |
|
2 |
Income |
0.793 |
1.260 |
|
3 |
Age of the housewife |
0.787 |
1.270 |
|
4 |
Education level of the housewife |
0.825 |
1.211 |
|
5 |
Pond area |
0.460 |
2.173 |
|
6 |
Area affected by abrasion |
0.435 |
2.301 |
|
7 |
Knowledge of balanced nutrition |
0.912 |
1.096 |
Figure 2. Scatterplot of heteroscedasticity test results
This test assesses the proportion of the dependent variable that can be explained by the independent variables in the regression model. It measured the extent to which factors such as income, age of the housewife, number of family members, level of education of the housewife, pond area, pond abrasion area, and balanced nutrition knowledge influenced the energy consumption of abrasion-affected aquaculture households in Brebes Regency. The coefficient of determination ranges between 0 and 1 [25]. The closer the value is to 1, the stronger the influence of the independent variables on the dependent variable.
As shown in Table 12, the Adjusted R² value of 0.833 indicates that 83.3% of the variation in household energy consumption among aquaculture households affected by abrasion in Brebes Regency was explained by the independent variables: household size, income, age of the housewife, education level of the housewife, pond area, area affected by abrasion, and knowledge of balanced nutrition. The remaining 16.7% was influenced by other factors not included in the regression model, such as food prices, food availability, and government assistance.
The F-test (Table 13) was conducted to analyze the overall influence of the independent variables, including household size, income, age of the housewife, education level of the housewife, pond area, area affected by abrasion, and knowledge of balanced nutrition, on household energy consumption. The hypothesis is accepted if the significance value (Sig. F) is less than 0.05, indicating that the independent variables collectively have a statistically significant effect on the dependent variable.
The analysis results showed a significance value of 0.001, which was less than 0.05. This indicates that the independent variables collectively have a significant effect on the dependent variable.
A t-test (Table 14) is conducted to analyze the individual influence of each independent variable on the dependent variable. A hypothesis is accepted if the significance value is less than 0.05, indicating that the respective independent variable has a statistically significant effect on the dependent variable.
The results of the t-test identified the significance values and coefficients of each variable, which were used to analyze the influence of the independent variables and to formulate the regression equation. Two independent variables were found to have a statistically significant individual effect on the energy consumption of aquaculture households affected by abrasion in Brebes Regency. The significance values for both variables were less than 0.05, indicating that the hypotheses were accepted.
Table 12. Results of the coefficient of determination (Adjusted R²) test
|
R |
R2 |
Adjusted R² |
Std. Error of the Estimate |
|
0.924 |
0.853 |
0.833 |
838.0591 |
Table 13. Results of F-test
|
Model |
Sum of Squares |
DF |
Mean Square |
F |
Sig. |
|
Regression |
212323901.74 |
7 |
30331985.963 |
43.187 |
0.001 |
|
Residual |
36521837.103 |
52 |
702343.021 |
|
|
|
Total |
248845738.85 |
59 |
|
|
|
Table 14. Results of t-test
|
Variable |
Unstandardized Coefficients |
Standardized Coefficients |
Sig |
|
|
B |
Std. Error |
Beta |
|
|
|
(Constanta) |
-2192.296 |
944.508 |
|
0.024 |
|
Household size |
1752.543 |
112.041 |
0.886 |
<0.001 |
|
Income |
8.924E-5 |
0.000037 |
0.145 |
0.018 |
|
Age of the housewife |
17.450 |
13.660 |
0.076 |
0.207 |
|
Education level of the housewife |
38.860 |
35.771 |
0.064 |
0.282 |
|
Pond area |
0.002 |
0.13 |
0.013 |
0.869 |
|
Area affected by abrasion |
0.003 |
0.19 |
0.013 |
0.871 |
|
Knowledge of balanced nutrition |
440.891 |
256.144 |
0.096 |
0.091 |
Household size had a significant impact on the energy consumption of aquaculture households, as indicated by the significance value of less than 0.05. The number of individuals living under one roof affects household energy consumption; the greater the number of household members, the higher the household’s energy consumption. An increase in the number of family members living under the same roof leads to an increase in household expenditure on energy consumption [39].
Household energy consumption was partly influenced by income. Based on the regression results, the unstandardized coefficient for income is 0.00008924. This indicates that, assuming all other variables remain constant, a 1,000,000 IDR increase in income is associated with an increase in predicted household energy consumption by 89.24 kcal. In line with Keynes’ hypothesis, although energy consumption increases with income, its growth rate is lower. This is in line with the report of a previous study [40] that household income has a positive effect on family energy consumption. As household income increases, energy consumption also rises, indicating that low-income families often allocate a significant portion of their income to meet their energy needs.
The age of the housewife did not have a partial effect on household energy consumption. It did not influence the quality of energy consumption within a household. Furthermore, the analysis showed no linear relationship between household energy consumption and the age or educational level of the housewife [41].
The education level of the housewife did not show a significant effect. This result may be attributed to the generally low educational attainment among housewives in aquaculture households, leading them to follow traditions passed down within the local community. The education level of the housewife was found to have only a minor influence on household energy consumption [42]. This finding aligns with Duesenberry’s theory, which suggests that household consumption preferences vary across families. In other words, household energy consumption expenditures are strongly influenced by the consumption patterns of neighbors and close family members. This indicates that household energy consumption behavior is heavily shaped by environmental factors.
The variable of pond area was found to have no partial effect on household energy consumption. The respondents owned an average pond area of 18,200 m² that could be cultivated, serving as the primary source of income for aquaculture households.
The variable of pond area affected by abrasion was also identified to have no partial effect on household energy consumption. On average, respondents reported 6,577 m² of pond area affected by abrasion, rendering it unsuitable for cultivation as usual. Environmental abrasion poses a serious threat to the sustainability of aquaculture production in coastal areas [43]. This phenomenon leads to economic uncertainty for coastal communities, particularly for aquaculture households, who then adapt by developing various survival strategies, including taking on side jobs. Engaging in side jobs significantly supports and alleviates household financial burdens when affected by coastal abrasion [44]. Income from such side jobs is primarily used to meet basic needs, especially food.
The variable of balanced nutrition knowledge was confirmed to have no partial effect on household energy consumption. A housewife’s nutritional knowledge was partly influenced by her level of education. In aquaculture households, housewives tend to base household consumption decisions on established community habits. The insignificant effect indicates that greater nutritional knowledge does not necessarily correlate with higher levels of household energy consumption [45]. Educational efforts through empowerment initiatives to enhance women’s understanding of environmental phenomena and their connection to food security must also be prioritized. In conclusion, addressing this policy area will provide a comprehensive framework to support women's adaptive strategies in response to food insecurity, thereby improving the sustainability and resilience of affected communities [46].
3.6 Household food security
The level of food security among aquaculture households affected by abrasion was identified in this study using the cross-classification method. Household food security was assessed by comparing energy consumption and food expenditure as a proportion of total household expenditure. Distinguish four categories: food secure, food vulnerable, food insufficient, and food insecure, as shown in Table 15.
Table 15. Household food security status of respondents
|
Criteria |
Food Security |
Number of Households |
Percentage (%) |
|
Food secure |
>80% energy adequacy, <60% proportion of food expenditure |
11 |
18.33 |
|
Food vulnerable |
>80% energy adequacy, ≥60% proportion of food expenditure |
17 |
28.33 |
|
Food insufficient |
≤80% energy adequacy, <60% proportion of food expenditure |
12 |
20.00 |
|
Food insecure |
≤80% energy adequacy, ≥60% proportion of food expenditure |
20 |
33.33 |
|
Total |
60 |
100 |
|
Coastal abrasion in Brebes Regency had significantly impacted aquaculture households. Abrasion was considered one of the highest national risks in coastal areas, leading to physical damage, business disruption, increased operational costs, and even the loss of aquaculture land in affected areas, ultimately resulting in decreased income [47]. This decline in income directly impacted household food security by limiting the ability to access and choose nutritious food. Overall, this phenomenon creates a negative impact on the livelihoods and sustainability of aquaculture households.
The results in Table 15 indicate that the highest proportion of households fell into the food-insecure category, comprising 20 households or 33.33% of the total. This was followed by the food-vulnerable category, with 17 households (28.33%). The food-insufficient category ranked third, consisting of 12 households (20%). The remaining 11 households (18.33%) were classified as food-secure, representing the lowest proportion.
It can be concluded that 49 aquaculture households (81.67%) affected by coastal abrasion in Brebes Regency have not yet achieved food security. This condition is primarily attributed to the low level of household income. Environmental abrasion has directly disrupted the sustainability of aquaculture activities [48]. The destruction of ponds due to abrasion has led to significant losses, particularly the collapse of embankments, which causes fish seedlings to be swept away by currents and ultimately hinders optimal harvesting. This situation has led to a decline in the income of aquaculture households, resulting in difficulties in meeting basic household needs and limited choices of food consumed [49]. Efforts to improve food security must include the provision of alternative livelihoods, enhancement of both the quality and quantity of food, and improved access to nutritious food for aquaculture households affected by coastal abrasion in Brebes Regency [50]. This aligns with previous studies, which emphasize that household food security and sustainability cannot be achieved without prioritizing access and affordability, both of which are key to ensuring long-term food resilience [51].
Based on the research findings, household expenditure on food accounted for 59.84% of the total household expenditure, amounting to IDR 2,009,780.00 per month. This large proportion allocated to basic food needs indicates a relatively high level of economic vulnerability. Furthermore, with an energy consumption rate of 79.87% and an average daily energy intake of 1,704.74 kcal per person, the level of consumption is considered insufficient. Socio-economic factors such as household size and income influence the energy consumption of aquaculture households. The food security condition of most aquaculture households affected by abrasion, amounting to 81.67%, has not yet reached a food-secure status. This is primarily due to the worsening coastal abrasion, which has damaged fishponds and reduced the households’ main source of income. Limited income has forced the majority of households to prioritize food expenditure, which in turn restricts their access to adequate sources of nutrition.
The findings of this study suggest several recommendations. Aquaculture households are advised to maximize secondary occupations, as household income is highly dependent on fishpond yields. This variation ensures that farmers have alternative income sources in the event of tidal flooding. Households are also encouraged to diversify their food consumption and adopt passive strategies such as reducing non-essential expenditures, like cigarette purchases, so that more funds can be allocated to meet daily energy needs. The government of Brebes Regency is urged to provide training on value-added aquaculture products and to increase and properly document capital assistance programs to help raise household income levels.
The authors are grateful to the Agribusiness Management and Innovation RG of the Agribusiness Study Program, Faculty of Agriculture, Universitas Sebelas Maret, Surakarta.
[1] Artama, I.M.O.S., Darmawan, D.P., Widhiantini, W. (2026). Income, food expenditure, and household food consumption: Evidence from urban communities in Denpasar City. Tennessee Research International of Social Sciences, 8(1): 195-200.
[2] Oktavilia, S., Firmansyah, Hidayah, Z., Adzim, F., Prajanti, S.D.W., Fafurida. (2026). Mapping poverty and food security: A spatial correlation analysis in central java. World Development Sustainability, 8: 100284. https://doi.org/10.1016/j.wds.2026.100284
[3] Ruddin, M.F., Mohd Noor, N.H. (2025). Food security in Indonesia: Achieving SDG target 2.2—End all forms of malnutrition. International Journal of Politics, Public Policy and Social Works, 7(17): 1-22. https://doi.org/10.35631/ijppsw.717001
[4] Yuliantini, E., Sukiyono, K., Yuliarso, M.Z., Sulistyo, B. (2022). Food security and stunting incidences in the coastal areas of Indonesia. Open Access Macedonian Journal of Medical Sciences, 10(F): 454-461. https://doi.org/10.3889/oamjms.2022.9335
[5] Muneenam, U., Suwannattachote, P. (2025). Consumption of environmentally marine friendly products by Thai tourists. International Journal of Sustainable Development and Planning, 20(4): 1431-1441. https://doi.org/10.18280/ijsdp.200407
[6] Painter, S.C., Popova, E., Roberts, M.J. (2022). An introduction to East African coastal current ecosystems: At the frontier of climate change and food security. Ocean & Coastal Management, 216: 105977. https://doi.org/10.1016/j.ocecoaman.2021.105977
[7] Sunardi, Rihmi, M.K., Sulkhany, E., Fuad, Kadhafi, M. (2026). Risk and safety assessment of purse seine operations in small fishing ports of East Java. International Journal of Safety and Security Engineering, 16(1): 55-63. https://doi.org/10.18280/ijsse.160105
[8] Mutanda, G.W., Nhamo, G. (2026). Livelihoods vulnerability and adaptive strategies for coastal communities. A systematic review. Marine Policy, 189: 107094. https://doi.org/10.1016/j.marpol.2026.107094
[9] Sinabang, I., Waruwu, K.D., Pauliana, G., Rahayu, W., Harefa, M.S. (2022). Analisis pemanfaatan keanekaragaman mangrove oleh masyarakat di pesisir Pantai mangrove paluh getah. J-CoSE: Journal of Community Service & Empowerment, 1(1): 10-21.
[10] Riptanti, E.W., Harisudin, M., Kusnandar, Khomah, I., Setyowati, N., Qonita, R.R.A. (2025). Examining the impact of abrasion on the livelihood of fishermen and aquaculture farmers: Empirical study on the North Coast of Central Java Province. International Journal of Sustainable Development and Planning, 20(6): 2509-2518. https://doi.org/10.18280/ijsdp.200619
[11] Akter, S., Kaya, F., Sumon, S.A., Hassan, M.M., Das, M.K. (2025). Exploring the impact of income, aquaculture production, protein supply, and food production on life expectancy. Green Technologies and Sustainability, 3(4): 100237. https://doi.org/10.1016/j.grets.2025.100237
[12] Hoque, M.Z. (2021). Sustainability indicators for sustainably-farmed fish in Bangladesh. Sustainable Production and Consumption, 27: 115-127. https://doi.org/10.1016/j.spc.2020.10.020
[13] Tien Ho, N.D., Charoenratana, S., Rosset, P.M., Maung, T.W. (2026). Factors explaining the diversification of livelihood strategies by households engaged in bivalve aquaculture in Thailand. Environmental and Sustainability Indicators, 31: 101264. https://doi.org/10.1016/j.indic.2026.101264
[14] Rachman, H.P.S. (2010). Aksesibilitas pangan: Faktor kunci pencapaian ketahanan pangan di Indonesia. Pangan, 19(2): 147-156. https://doi.org/10.33964/jp.v19i2.128
[15] Rihmi, M.K., Yulianto, E.S., Fuad, Sunardi, Kadhafi, M. (2025). Ecological selectivity and socio-economic sustainability in small-scale fisheries: Lessons from nature for sustainable design in Southern Java. International Journal of Design & Nature and Ecodynamics, 20(11): 2623-2632. https://doi.org/10.18280/ijdne.201113
[16] Suhardi, I., Saraswati, R. (2020). Perubahan Garis Pantai Pesisir Utara Jawa. Departemen Geografi FMIPA Universitas Indonesia.
[17] Setyohadi, D., Pamungkas, R.S., Purwanto, H., et al. (2024). Enhancing fisheries management and sustainability: A stowage factor analysis of fish species at Mayangan Port, Indonesia. International Journal of Design and Nature & Ecodynamics, 19(6): 1939-1949. https://doi.org/10.18280/ijdne.190610
[18] Adam, C.K., Walpa, J.A., Octavia, V. (2020). Pertanggungjawaban Pemerintah Republik Indonesia terhadap hilangnya hak atas tanah milik warga masyarakat yang terkena abrasi di wilayah Kabupaten Brebes Jawa Tengah. Cepalo, 4(2): 129-142. https://doi.org/10.25041/cepalo.v4no2.1943
[19] Hastuti, V.N., Afifah, D.N., Sugianto, D.N., Anjani, G., Noer, E.R. (2024). The sociodemographic factors on food insecurity among household living in disaster-prone area in Central Java, Indonesia. Jurnal Gizi Indonesia (The Indonesian Journal of Nutrition), 12(2): 136-142. https://doi.org/10.14710/jgi.12.2.136-142
[20] Azhari, O., van der Veer, S., Hamon, K.G., et al. (2026). Socio-economic opportunities and challenges of seaweed (Gracilaria sp.) farming in polyculture systems in Brebes regency, Indonesia. Aquaculture, 610: 742944. https://doi.org/10.1016/j.aquaculture.2025.742944
[21] Ahmadzai, A.K., Akbay, C. (2020). The factors affecting food security in the eastern region of Afghanistan. KSU Journal of Agriculture and Nature, 23(2): 467-478. https://doi.org/10.18016/ksutarimdoga.vi.596442
[22] Utami, D.C., Mamilianti, W. (2021). Analysis of household food security of fishermen in Coastal Area, Bangil District, Pasuruan Regency. ECSOFiM: Journal of Economic and Social of Fisheries and Marine, 9(1): 16-29. https://doi.org/10.21776/ub.ecsofim.2021.009.01.02
[23] Kida, N., Smajli, R., Hashani, M., Morina, V., Morina, J., Miftari, F. (2025). The impact of trade and consumption on Kosovo GDP growth: An analysis based on the Cobb-Douglas model. International Journal of Sustainable Development and Planning, 20(2): 503-526. https://doi.org/10.18280/ijsdp.200205
[24] Xu, M., Zhao, J.H., Lei, T., et al. (2025). The influence mechanism of environmental regulations on food security: The mediating effect of technological innovation. Environmental Sciences Europe, 37(1): 83. https://doi.org/10.1186/s12302-025-01137-2
[25] Sekaran, U., Bougie, R. (2010). Research Methods for Business: A Skill Building Approach (5th ed.). John Wiley & Sons Ltd.
[26] Creswell, J.W., Plano Clark, V.L. (2017). Designing and Conducting Mixed Methods Research (3rd ed.). SAGE Publications.
[27] Bryman, A. (2016). Social Research Methods. Oxford University Press, pp. 231-244.
[28] Ibrahim, S.B., Aminu, R.O., Arowolo, A.O., Musa, A.S. (2023). Does access to basic services and productive assets influence agricultural households' dietary diversity and food security? Evidence from Ogun State, Nigeria. Sarhad Journal of Agriculture, 39(4): 787-799. https://doi.org/10.17582/JOURNAL.SJA/2023/39.4.787.799
[29] DINAS KETAHANAN PANGAN KABUPATEN LEBAK (2021). Peta Ketahanan dan Kerentanan Pangan. https://disketapang.lebakkab.go.id/public/deploy/pdf/1737431190_9e454c8bc4b486f4bbd7.pdf.
[30] Maxwell, D.G., Levin, C.E., Armar-Klemesu, M., Ruel, M.T., Morris, S.S., Ahiadeke, C. (2000). Urban livelihoods and food and nutrition security in Greater Accra, Ghana. IFPRI Research Report 112, International Food Policy Research Institute, Washington, DC. http://orcid.org/0000-0002-9506-348X
[31] Khanh Ngoc, Q.T., Xuan, B.B., Nam, P.K. (2026). The dual role of small-scale fisheries on food security and poverty eradication in Vietnam: A latent profile analysis. World Development, 200: 107300. https://doi.org/10.1016/j.worlddev.2025.107300
[32] Lestari, E., Sarana, J. (2018). Determinants of household’s food and nutrition security in Indonesia. Jurnal Ekonomi Dan Pembangunan, 26(2): 105-115. https://doi.org/10.14203/JEP.26.2.2018.105-115
[33] Rosmalah, S., Hartati, Harianti, et al. (2025). Implementation model of dryland rice business supporting food security Buton Utara, Indonesia. Sarhad Journal of Agriculture, 41(1): 184-197. https://doi.org/10.17582/journal.sja/2025/41.1.184.197
[34] Baladina, N., Toiba, H., Hanani, N., Suhartini, S., Widarjono, A. (2024). Do income levels affect the food consumption pattern of households? Evidence from Indonesia. Asian Economic and Financial Review, 14(9): 695-711. https://doi.org/10.55493/5002.v14i9.5158
[35] Martina, Shamadiyah, N., Praza, R. (2018). The contribution of revenue and consumption cost of soybean farmers in Muara Batu Subdistrict Aceh Utara. In Emerald Reach Proceedings Series, Emerald Publishing Limited, pp. 289-294. https://doi.org/10.1108/978-1-78756-793-1-00014
[36] Wang, J.Y., Tong, M.Y. (2025). Shanxi province food security evaluation research. Scientific Reports, 15(1): 897. https://doi.org/10.1038/s41598-024-84725-1
[37] Arida, A., Sofyan, Fadhiela, K. (2015). Analisis Ketahanan Pangan Rumah Tangga berdasarkan Proporsi Pengeluaran Pangan dan Konsumsi Energi (Studi Kasus pada Rumah Tangga Petani Peserta Program Desa Mandiri Pangan di Kecamatan Indrapuri Kabupaten Aceh Besar). Agrisep, 16(1): 20-34. https://jurnal.usk.ac.id/agrisep/article/view/3028/2890.
[38] Clements, K.W., Si, J. (2018). Engel’s law, diet diversity, and the quality of food consumption. American Journal of Agricultural Economics, 100(1): 1-22. https://doi.org/10.1093/ajae/aax053
[39] Handayani, S., Yulistiyono, H. (2023). Pengaruh pendapatan, jumlah anggota keluarga dan pendidikan terhadap konsumsi rumah tangga miskin di Kabupaten Banyuwangi. Neo-Bis, 12(1): 32-47. https://doi.org/10.21107/nbs.v12i1.21671
[40] Alfiati, S. (2018). Analisis faktor-faktor yang mempengaruhi pola konsumsi pangan rumah tangga. Journal of Economic, Business and Accounting (COSTING), 2(1): 76-83. https://doi.org/10.31539/costing.v2i1.369
[41] Heni, H. (2012). Hubungan faktor sosial ekonomi dengan konsumsi sayur-sayuran di Kecamatan Amuntai Tengah Kabupaten Hulu Sungai Utara. Rawa Sains: Jurnal Sains Stiper Amuntai, 2(1): 26-31. https://doi.org/10.36589/rs.v2i1.12
[42] Faradina, R., Iskandarini, I., Lubis, S.N. (2018). Analisis faktor-faktor yang mempengaruhi pengeluaran konsumsi pangan rumah tangga (Studi kasus: Desa karang gading, kecamatan secanggang, kabupaten langkat). Talenta Conference Series: Local Wisdom, Social, and Arts (LWSA), 1(1): 284-295. https://doi.org/10.32734/lwsa.v1i1.178
[43] Cantos, G., Fuentes, C., Fernández-Segovia, I., Fuentes, A. (2025). Study of consumer perceptions of sustainable fishery products. Aquaculture, 610: 742926. https://doi.org/10.1016/j.aquaculture.2025.742926
[44] Manggabarani, I. (2016). Kajian sosial ekonomi masyarakat nelayan yang bermukim di pesisir pantai (Studi kasus lingkungan Luwaor Kecamatan Pamboang, Kabupaten Majene). Agrovital: Jurnal Ilmu Pertanian, 1(1): 27-33. http://dx.doi.org/10.35329/agrovital.v1i1.81
[45] Taenasah, E., Dasipah, E., Gantini, T. (2024). Faktor-faktor yang mempengaruhi pola konsumsi pangan di Kabupaten Garut (Suatu kasus pada rumah tangga peserta program pekarangan pangan Lestari). OrchidAgri, 4(1): 34-47. https://doi.org/10.35138/orchidagri.v4i1.729
[46] Yunindyawati, Lidya, E., Rinto, Azni, U.S. (2025). Women’s adaptation strategies for ensuring food security to response climate change: Good practice from rural swamp in Indonesia. International Journal of Sustainable Development and Planning, 20(3): 1207-1217. https://doi.org/10.18280/ijsdp.200326
[47] Rezagama, A., Hartono, D.M., Soesilo, T.E.B., Hasibuan, H.S. (2025). Developing a system dynamics model for water resource management in urban coastal areas: A case study of Semarang City, Indonesia. International Journal of Sustainable Development and Planning, 20(5): 2029-2043. https://doi.org/10.18280/ijsdp.200520
[48] Garlock, T.M., Asche, F., Anderson, J.L., et al. (2024). Environmental, economic, and social sustainability in aquaculture: The aquaculture performance indicators. Nature Communications, 15(1): 5274. https://doi.org/10.1038/s41467-024-49556-8
[49] Zenbaba, O.S., Ketema, M., Jaleta, M., Jemal, K. (2025). Impact of wheat production technology packages adoption on smallholder farmers’ food security and income in Horo Guduru Wollega Zone, Ethiopia. Journal of Innovation and Entrepreneurship, 14(1): 48. https://doi.org/10.1186/s13731-025-00495-8
[50] Zahir, A., Hamdard, E. (2025). Update on the state of food security and safety in Afghanistan: A review. Food and Humanity, 5: 100650. https://doi.org/10.1016/j.foohum.2025.100650
[51] Papargyropoulou, E., Ingram, J., Poppy, G.M., et al. (2025). Research framework for food security and sustainability. NPJ Science of Food, 9(1): 1-5. https://doi.org/10.1038/s41538-025-00379-x