Nuri Setyo Taufiqqurrahman | Adithya Sudiarno*
© 2026 The authors. This article is published by IIETA and is licensed under the CC BY 4.0 license (http://creativecommons.org/licenses/by/4.0/).
OPEN ACCESS
Power plants are vital infrastructures vulnerable to emergencies. This research presents a variable isolation study to compare evacuation effectiveness between underground and above-ground powerhouse architectures. Using an identical baseline geometry and agent-based simulation (Pathfinder), the impact of vertical movement was exclusively isolated. Results from the Ideal Scenario (163 agents) reveal that despite identical travel distances, the underground architecture consistently produced a 60.7% longer Required Safe Egress Time (RSET) (448.8 s) than the above-ground facility (279.3 s) due to slower upward biomechanical speeds. Crucially, Braess’s Paradox was exclusively confirmed in the underground architecture. Blocking the main stair route increased travel distance by 40.4% but paradoxically improved the underground RSET by 4.5%, whereas the above-ground RSET worsened by 12.4%. This confirms the extreme vulnerabilities triggered by selfish routing behavior. Implementing a guided evacuation system proved four times more effective in terms of absolute time savings when applied to the underground facility, substantially reducing RSET by 41.4% and narrowing the performance gap from 1.61 times to 1.13 times delay ratio. Ultimately, dynamic route management interventions, such as a Dynamic Evacuation Routing System (DERS), are crucial to compensate for inherent vulnerabilities caused by human behavior interactions in underground facilities.
Braess's Paradox, evacuation simulation, Pathfinder, power plant, Required Safe Egress Time, selfish routing
Personnel safety is a fundamental aspect in the operation of high-risk vital infrastructure facilities such as power plants, which are highly vulnerable to emergency incidents like fires [1]. Unlike commercial buildings, powerhouses feature unique industrial architectures with massive machinery layouts and complex piping systems that create non-standard evacuation routes [2, 3]. This research highlights two contrasting facility architectural orientations. First, above-ground facilities, where evacuation is dominated by downward vertical movement [4]. Second, underground facilities characterized by specific risks, where evacuation fundamentally involves upward vertical movement against gravity, inherently creating a convergent evacuation flow toward limited surface access points [5]. Effective emergency response planning is crucial in these complex facilities to mitigate fatalities [6, 7].
Evacuation efficiency in these high-risk environments is determined by more than just individual movement speeds. Studies in underground environments reveal that fatigue caused by upward evacuation significantly reduces movement speed [8]. Furthermore, the Required Safe Egress Time (RSET) is heavily influenced by spatial layouts and the presence of bottlenecks [9]. Because conducting full-scale evacuation drills in operating facilities incurs high costs and severe safety risks, computational simulations using Agent-Based Modeling (ABM) are essential [10]. Moreover, virtual simulation approaches are widely recognized as highly effective and safe media for evaluating new evacuation routing system prototypes prior to physical implementation [11]. Simulation software such as Pathfinder has proven to be an effective tool for simulating individuals as autonomous agents and identifying potential congestions [12-14].
Although numerous evacuation studies have been conducted, previous research tends to focus on single-case analyses, examining either above-ground or underground facilities separately [2, 15, 16]. Currently, there is a distinct literature gap regarding the lack of head-to-head comparative studies that isolate architectural variables in an apple-to-apple manner. Comparing two structurally different buildings obscures whether evacuation delays are caused by the differing layouts or purely by the vertical movement direction (upward vs. downward). This research gap leads to a lack of empirical understanding of the true magnitude of the real-time performance "penalty" caused exclusively by gravitational effects and underground architectures.
To bridge this gap, the present study introduces a strict variable isolation methodology that fundamentally differs from existing Pathfinder-based evacuation research. Unlike previous studies that compare inherently different buildings with varying corridor widths, stair configurations, and occupant loads [2, 15, 16], our approach uses a single 100% identical geometric model and manipulates only the building's functional orientation-the floor nearest to the assembly point (Floor 1) remains at the exit level, while the deepest operational floor (Floor 3) is positioned at the top in above-ground facilities and at the bottom in underground facilities, forcing evacuation to proceed upward against gravity rather than downward.
This study aims to quantitatively measure and compare the evacuation route effectiveness-including RSET, travel distance, and personnel density levels-through a variable isolation approach. Utilizing a 100% identical architectural layout and agent profile, this research exclusively manipulates the vertical movement direction to represent both above-ground and underground conditions. Through this controlled comparative approach, the study specifically analyzes the impact of the Ideal Scenario, route failure conditions, and guided evacuation interventions. The findings are expected to provide a robust empirical foundation for industrial facility designers to evaluate safety designs and formulate optimal emergency response procedures.
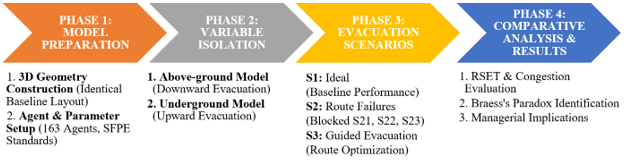
This research employs a quantitative approach based on Performance-Based Design (PBD) to evaluate evacuation route effectiveness [17]. The evacuation modeling and simulation were conducted using Pathfinder, an agent-based simulation software [12]. The research methodology flowchart is systematically illustrated in Figure 1.
Figure 1. Research methodology flowchart
2.1 Facilities description and variable isolation approach
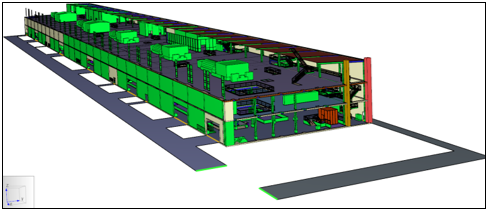
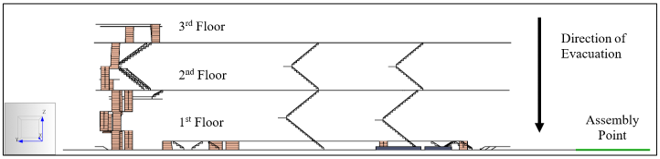
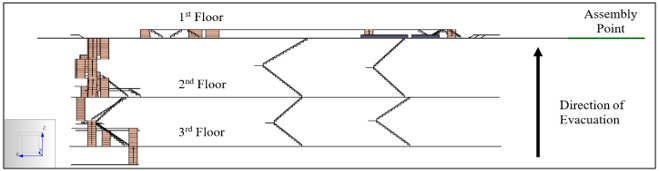
To ensure a valid and pure apple-to-apple comparison, this study adopted a variable isolation approach. The geometric model was constructed based on the original as-built drawing of a powerhouse with three operational floors. The spatial layout of the rooms, massive machinery, door positions, and stair dimensions were utilized as a 100% identical baseline model for both testing configurations. The exclusively manipulated variable was the "Vertical Evacuation Direction". In the first model (Above-Ground), the assembly point was located on the ground floor, dictating a downward vertical evacuation. In the second model (Underground), the building's functional orientation was inverted, forcing agents to evacuate vertically upward against gravity toward a surface assembly point. Furthermore, all basic operational parameters were assumed identical for both facility types, as visualized in Figure 2. The side elevation profiles of both models (Figures (2b) and (2c)) further illustrate the identical multi-flight stair arrangements and confirm that the only geometric difference lies in the vertical evacuation direction relative to the assembly point.
While this inversion approach represents a controlled experimental construct (ceteris paribus) to mathematically isolate the impact of vertical movement, it accurately reflects the core operational reality of industrial hydroelectric power plants (HEPP). In typical HEPP installations, the powerhouse hall containing turbines and generators shares a similar functional layout regardless of whether it is built on the surface or excavated underground [2, 3]. The primary operational difference lies in the vertical access direction: surface facilities evacuate downward to ground-level assembly points, while underground hall requires upward evacuation through vertical shafts to reach the surface. This geometric inversion therefore captures the essential architectural distinction while ensuring the internal validity of the comparative analysis.
(a) Three-dimensional Pathfinder model of the above-ground powerhouse
(b) Side elevation view of the above-ground model
(c) Side elevation view of the underground model
Figure 2. Variable isolation approach
2.2 Agent-based simulation and parameters
The simulation was configured using the Steering Mode with the locally quickest path planning algorithm in Pathfinder [12, 18], which has been validated through supporting research on agent-based wayfinding techniques [18]. The total simulation population was identically set to 163 personnel. This number represents the average historical personnel involved in the last two major overhaul maintenance projects at the facility. The overhaul phase population was selected because it represents the peak operational occupancy inside the powerhouse, making it suitable for stress-testing the capacity limits of evacuation routes. To maintain strict experimental control, agent placement was randomized to ensure even distribution across all floors. Critically, the initial (x, y, z) coordinates of all 163 agents were locked to be identical in both the above-ground and underground models. The simulation focused exclusively on evacuation movement time without integrating fire or smoke spread dynamics. Additionally, agents were modeled with uniform physical capabilities, excluding complex psychological panic behaviors.
It is important to note that this study deliberately employed a single deterministic simulation configuration rather than Monte Carlo-style repeated sampling. Since the initial (x, y) positions and floor assignments of all 163 agents were absolutely locked to be identical in both models, running repeated simulations with randomized placements would have violated the strict variable isolation methodology. Different random seeds would produce different agent starting positions, introducing stochastic placement variability that would confound the pure architectural comparison. The deterministic approach ensures that any measured performance difference is attributable solely to the vertical movement direction, not to random variations in agent distribution.
Agent physical characteristics and movement profiles were validated against the Society of Fire Protection Engineers (SFPE) standards [4]. The horizontal walking speed was set at 1.19 m/s. Stair speeds were differentiated to represent biomechanical constraints (configured using Speed Fraction Up and Speed Fraction Down adjustments in the software): the downward stair speed in the above-ground model was set to 0.70 m/s, whereas the upward stair speed in the Underground model was heavily reduced to 0.40 m/s based on empirical data [8, 19]. Details of the speed parameters applied to the model are presented in Table 1.
The effective widths of narrowing elements (such as doors and stairs) were verified through design document (CAD) calibration and direct field measurements.
Table 1. Agent profile and movement speed parameters
|
Agent Parameter |
Assigned Value |
Reference |
|
Shoulder width |
0.458 m |
SFPE Standard |
|
Horizontal walking speed |
1.19 m/s |
|
|
Downward speed on stairs |
0.70 m/s |
Empirical data |
|
Upward speed on stairs |
0.40 m/s |
2.3 Simulation scenarios
To comprehensively measure the RSET and congestion levels, three main scenarios were simulated on both powerhouse architectures. The selection of evacuation scenarios in this study follows the PBD framework as outlined in the SFPE Handbook of Fire Protection Engineering [4]. These three scenarios were systematically designed to represent a complete risk analysis cycle: (1) baseline measurement of basic performance efficiency, (2) resilience testing against worst-case scenarios caused by route failures, and (3) formulation of intervention strategies as mitigation solutions for the identified architectural weaknesses. The scenarios are:
(1) Scenario 1/S1 (Ideal Scenario)
A mandatory baseline scenario in PBD evaluation to measure basic performance efficiency when all emergency doors, stairs, and evacuation routes function normally without obstacles. This scenario was designed to record natural human instincts during emergencies modeled via the locally quickest algorithm. This condition represents a User Equilibrium (UE), where agents act selfishly to find the shortest route (selfish routing).
(2) Scenario 2/S2 (blocked route scenario)
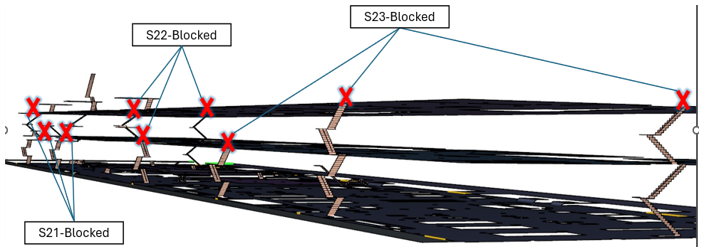
Serving as a resilience or stress test, this scenario aligns with the National Fire Protection Association (NFPA) 101 and NFPA 850 standards, which strictly mandate the availability of redundant evacuation routes. Intentionally blocking the most preferred routes is a standard experimental control method to uncover structural vulnerabilities and empirically identify network inefficiencies, such as the manifestation of Braess's Paradox [20]. The spatial mapping of these blocked route scenarios to test architectural resilience is illustrated in Figure 3, which includes failures at the building's front end (S21-Blocked), central area (S22-Blocked), and rear end (S23-Blocked).
(3) Scenario 3/S3 (guided evacuation scenario)
This scenario serves as an administrative engineering intervention a non-structural intervention designed to resolve critical congestions and the observed selfish routing anomalies (Braess's Paradox) [20]. Based on the occupational health and safety (OHS) hierarchy of controls, permanently altering the massive concrete structure of an underground facility is unfeasible both economically and technically. Thus, implementing active evacuation management-such as using dynamic digital signs or deploying trained fire wardens-is recommended to prevent selfish routing behavior and proactively distribute the crowd load toward a System Optimum (SO) condition.
Figure 3. Blocked route areas for Scenario 2
2.4 Statistical data analysis
In addition to the analysis of time and Density Maps (Level of Service (LOS)), this research utilized the non-parametric Mann-Whitney U statistical test to examine the significance of evacuation time differences, as the data were not normally distributed. The effect size (rank-biserial correlation) was also calculated using the r parameter, derived from the ratio of the z-score to the square root of the total sample size ($r=z / \sqrt{N}$), to measure the magnitude of the intervention scenarios’ impact [21].
3.1 Variable isolation proof and baseline evacuation performance (Ideal Scenario)
To ensure that the evacuation performance comparison is methodologically valid, the validity of this variable isolation was first evaluated through the average travel distance of agents in Scenario 1 (Ideal Scenario). As presented in Table 2, the baseline data provide empirical evidence of a perfectly isolated geometric environment.
Table 2. Variable isolation proof and baseline (Scenario 1)
|
Metric |
Above Ground |
Underground |
Ratio |
|
RSET (s) |
279.3 |
448.8 |
1.61× |
|
Average travel distance (m) |
148.2 |
148.6 |
1.00× |
|
Average evacuation time (s) |
153.0 |
205.9 |
|
Although the basic architectural layout and the initial coordinate placement of the 163 agents were absolutely controlled (100% identical), the simulation showed a marginal difference of 0.3% (approximately 0.4 meters) in the average travel distance between the above-ground model (148.2 m) and the underground model (148.6 m). This minor difference proves the validity of the computational mechanics of the Steering Mode in ABM, which models physical interactions realistically [12]. This physical travel distance difference did not stem from geometric differences. Rather, it emerged due to the different vertical speeds of the agents (0.70 m/s downward versus 0.40 m/s upward), which triggered distinct queuing formations at stair entrances. In the underground facility, the slow upward speed triggered a massive bottleneck at the stair's neck. This static crowd condition forced agents to continuously perform collision avoidance maneuvers, proxemic shifts, and lane formations while squeezing to wait their turn [18]. These dynamic micro-movement maneuvers cumulatively contributed to the additional 0.4 meters of average distance, empirically confirming that the simulation authentically captured the physical dynamics of a crowd squeezing in narrow spaces.
Based on this geometric equivalence, despite the identical spatial constraints, the Ideal Scenario revealed an extreme performance disparity. The underground architecture produced a RSET of 448.8 seconds, which is 60.7% slower than the above-ground model, which only required 279.3 seconds. Since the layout and travel distances were 100% identical, this 1.61 times delay ratio represents a pure time penalty caused exclusively by the biomechanical limitations of upward vertical movement against gravity (0.40 m/s versus 0.70 m/s) [8]. This speed reduction triggered a non-linear congestion effect, causing agents to pile up much faster at the base of the underground facility's stairs. This congestion was further exacerbated by selfish routing behavior; recent research has demonstrated that when multiple staircases are available, agents overwhelmingly converge toward the shortest option rather than the locally quickest one, creating severe load imbalances [22]. This behavioral tendency is precisely what was observed in the current simulation, where 59.5% of agents concentrated on a single stair despite the availability of alternatives.
3.2 Identification of Braess's Paradox through route failure scenarios
Table 3 quantifies a counter-intuitive phenomenon known as Braess's Paradox, which manifested exclusively in the underground facility during the S21-Blocked scenario. In this simulation, the stair route that most dominated the evacuation flow (used by 97 agents or 59.5% of the population in the Ideal Scenario) was intentionally blocked. This blockage forced agents to seek detour routes, causing the average travel distance in both models to surge by 40.4% (from 148.2 m to 208.1 m).
In the above-ground model, this increased travel distance logically led to decreased performance. The RSET worsened by 12.4%, increasing from 279.3 seconds to 313.8 seconds. However, a statistically significant anomaly emerged exclusively in the underground model. Counter-intuitively, closing the main stair-despite increasing travel distance by 40.4%-actually improved the underground RSET by 4.5% (from 448.8 seconds to 428.6 seconds). This phenomenon, known as Braess's Paradox, is quantified in Table 3.
This phenomenon confirms the fundamental principle of Braess's Paradox in crowd theory [20, 23], which demonstrates that under UE conditions, where agents selfishly choose the shortest route (selfish routing), the system actually reaches maximum inefficiency. In the underground model, the extremely slow upward stair speed created a much more severe bottleneck than in the above-ground facility. Consequently, forcing agents to walk a long detour toward alternative routes unraveled the critical congestion at the main stair, so the resulting total flow smoothness compensated for the time penalty of the longer distance. Stair blockages at S22 and S23 did not trigger significant impacts (the RSET ratio remained at 1.61 times), proving that Braess's Paradox is highly sensitive to the location of the main bottleneck in the network. Similar efficiency paradoxes in deeply buried underground facilities have also been independently documented in recent studies on subway station evacuation [24], reinforcing that underground architectures are uniquely susceptible to counter-intuitive routing inefficiencies.
Table 3 presents the complete blockage analysis across all three stair locations. When stair at S22-Blocked scenario was blocked, neither facility showed any RSET change (0.0%), confirming that this stair carries negligible traffic under the locally quickest routing algorithm. When stair at S23-Blocked scenario was blocked, both facilities experienced minor degradation (Above-ground: +2.4%; Underground: +2.6%), following the expected logical pattern where removing capacity worsens performance. The paradoxical improvement (-4.5%) was observed exclusively when stair at S21-Blocked scenario-the primary bottleneck-was blocked in the underground model. This location-specific sensitivity confirms that the observed phenomenon constitutes a genuine Braess's Paradox rather than a generalized rerouting effect.
To comprehensively validate the significance of the intervention and the emergence of Braess's Paradox, a non-parametric Mann-Whitney U statistical test was conducted across all main scenarios. The statistical summary, including z-scores, p-values, and the effect size (rank-biserial correlation, r), is presented in Table 4. This quantitative evaluation strongly confirms the asymmetrical impact of route failures between the two contrasting architectures.
Beyond measuring the absolute RSET reduction percentage, the results of the non-parametric Mann-Whitney U statistical analysis (Table 4) confirm that the Braess's Paradox anomaly in the underground architecture (S21-Blocked Scenario) is statistically significant (p = 0.002). The effect size calculation shows a value of r = 0.171 (z = 3.087), which falls into the small effect category [21]. Mathematically, this effect size is considered small because the majority of agents (the median) were forced to take a detour that prolonged their individual times (the median increased from 171.2 seconds to 215.1 seconds). However, in the macro system, this individual time sacrifice successfully unraveled the lethal bottleneck at the tail of the queue, resulting in a faster overall system (RSET). This sharply contrasts with the above-ground architecture, where the exact same route blockage significantly worsened the evacuation performance (p < 0.001) with a medium effect size (r = 0.357, z = 6.452). This statistical evidence robustly justifies that Braess's Paradox is purely a unique characteristic stemming from the vulnerabilities of underground architectures.
Table 3. Quantitative evidence of Braess’s Paradox
|
Facility |
Scenario |
RSET (s) |
Avg. Distance (m) |
Change in RSET |
|
Above Ground |
Ideal |
279.3 |
148.2 |
Baseline |
|
S21-Blocked |
313.8 |
208.1 |
+12.4% (Worse) |
|
|
S22-Blocked |
279.3 |
148.4 |
0.0% (No change) |
|
|
S23-Blocked |
285.9 |
148.3 |
+2.4% (Worse) |
|
|
Underground |
Ideal |
448.8 |
148.6 |
Baseline |
|
S21-Blocked |
428.6 |
208.6 |
-4.5% (Better) |
|
|
S22-Blocked |
448.8 |
148.8 |
0.0% (No change) |
|
|
S23-Blocked |
460.5 |
148.7 |
+2.6% (Worse) |
Table 4. Summary of non-parametric statistical analysis (ideal vs. S21-Blocked)
|
Facility |
Z-Score |
p-Value |
Effect Size (r) |
Interpretation |
|
Above Ground |
6.452 |
<0.001 |
0.357 |
Significant (Medium effect) |
|
Underground |
3.087 |
0.002 |
0.171 |
Significant (Small effect) |
3.3 Guided evacuation optimization (Scenario 3)
Responding to the critical inefficiency validated by the emergence of Braess's Paradox in the underground facility, Scenario 3 was implemented by proactively distributing the personnel flow. The number of agents at the main stair (Stair 56) was forcefully reduced from 97 agents to 36 agents. This number of 36 agents is not arbitrary, but rather a systematic output derived from the redistribution of 9 instruction zone groups (Behaviors) within the Pathfinder software module. Out of the 97 agents who initially piled up due to selfish routing behavior, 61 agents whose operational positions were in the building's perimeter zones were forcibly rerouted to alternative stairs. Meanwhile, the 36 agents maintained at Stair56 were personnel geographically located purely in the zone closest to that stair. This spatial load distribution was proven to break up congestion and was designed to push the system toward a SO condition [25].
In practical implementation, achieving this guided compliance in real emergency conditions requires a combination of active and passive interventions. Dynamic emergency route signage systems, linked directly to the fire alarm network, can automatically illuminate alternative escape routes and deactivate signage pointing toward the congested main stair. Additionally, trained floor wardens stationed at key decision points can physically redirect personnel away from the bottleneck zone during the critical first minutes of an evacuation. Previous research on emergency signage compliance has demonstrated that when dynamic signs are combined with verbal instructions from authority figures, occupant compliance rates exceed 85% even under stress conditions [19]. The mathematical redistribution modeled in this scenario therefore represents an achievable operational target rather than a purely theoretical construct.
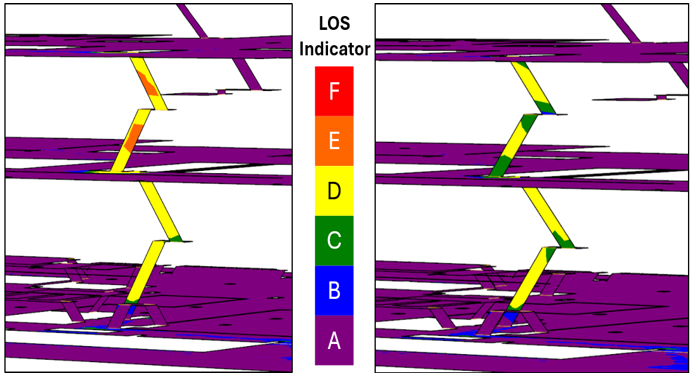
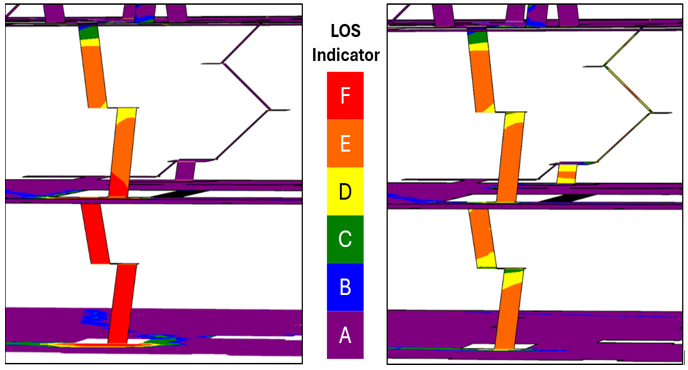
This quantitative improvement is visually confirmed by the LOS heatmaps in Figures 4 and 5. The heatmap of the Ideal Scenario revealed a severe bottleneck (LOS E-F, indicated by a solid orange/red color) formed at the base of the stairs due to the agents' instinctual selfish routing behavior. After the guided evacuation intervention was implemented, the critical red zone was entirely eliminated and replaced by LOS A-C (green/yellow zones). Furthermore, stair usage was distributed more evenly in Scenario 3. In the stairway LOS heatmap, the critical red zones that previously occurred on two stairs were eliminated and spread to other stairs, resulting in a much more balanced distribution. This proves that dynamic route management successfully resolved congestion and narrowed the performance gap between the underground and above-ground facilities from 1.61 times delay ratio to only 1.13 times.
Figure 4. Level of Service (LOS)queuing maximum comparison at Above-ground architecture; Scenario 1 (left), Scenario 3 (right)
Figure 5. Level of Service (LOS) stairway maximum comparison at underground architecture; Scenario 1 (left), Scenario 3 (right)
Table 5. Impact of guided evacuation (Scenario 3)
|
Metric (s) |
Architecture |
Ideal |
Guided (S3) |
Change |
|
RSET |
Above-ground |
279.3 |
233.9 |
-16.3% |
|
Underground |
448.8 |
263.2 |
-41.4% |
|
|
StdDev of time |
Above-ground |
62.4 |
48.8 |
-21.8% |
|
Underground |
114.4 |
54.2 |
-52.6% |
Table 6. Summary of non-parametric statistical analysis (ideal vs. guided evacuation)
|
Facility |
Z-Score |
p-Value |
Effect Size (r) |
Interpretation |
|
Above Ground |
1.285 |
0.198 |
0.071 |
Not Significant (Negligible) |
|
Underground |
2.805 |
0.005 |
0.155 |
Significant (Small effect) |
The RSET in the above-ground architecture decreased by 45.4 seconds (from 279.3 seconds to 233.9 seconds), whereas the underground architecture experienced a massive reduction of 185.6 seconds (from 448.8 seconds to 263.2 seconds). This conclusively demonstrates that guided evacuation provides asymmetrical benefits. In terms of absolute time savings, the intervention was four times more effective in the underground facility (185.6 seconds saved) compared to the above-ground facility (45.4 seconds saved), and 2.5 times more effective when measured by percentage improvement (41.4% versus 16.3%).
The data in Table 5 demonstrate the asymmetrical effectiveness of the guided evacuation intervention (Scenario 3). By proactively redistributing the agent population and reducing the queue load on the stairs, the system was pushed closer to a SO condition. The underground architecture gained the massive benefit, recording a drastic RSET reduction of 41.4% (from 448.8 seconds down to 263.2 seconds). Conversely, the above-ground model only experienced a 16.3% improvement. Furthermore, the standard deviation of evacuation time in the underground model plummeted by 52.6% (from 114.4 seconds to 54.2 seconds), indicating that this intervention successfully eliminated extreme individual delays and created a highly predictable evacuation flow.
The success of the guided evacuation intervention in the underground facility is confirmed through the Mann-Whitney U statistical test (Table 6), which shows a statistically significant improvement difference (p = 0.005). The effect size value was recorded at r = 0.155 (z = 2.805), classified as a small effect. Although the effect size is statistically small (due to the high overlap in time rankings of the majority of agents unaffected by the initial congestion), the significance of this p-value provides empirical proof that dynamic route management consistently succeeded in cutting the queue's tail end without penalizing the majority of agents. Conversely, in the above-ground facility, the same intervention proved to yield no statistically significant difference in evacuation times (p = 0.198) with a negligible effect size (r = 0.071, z = 1.285). This statistical comparison provides strong empirical evidence that guided evacuation delivers asymmetrical benefits. The intervention is essential for underground architectures where selfish routing triggers critical congestion, yet it yields no statistically meaningful impact on above-ground facilities, which inherently possess sufficient stair capacity to accommodate unmanaged flows. Ultimately, these findings strongly justify the absolute necessity of dynamic route management interventions in underground facilities. This conclusion aligns with recent empirical evidence demonstrating that implementing a Dynamic Evacuation Routing Systems (DERS) through intelligent digital signages or active warden guidance is highly effective in reducing errors and significantly accelerating personnel reaction times during a crisis [11].
3.4 Managerial implications
The comparative findings from this simulation provide a robust empirical basis for facility management to make strategic decisions. The key managerial implications include:
1. The absolute necessity of DERS in underground facilities
Underground architectures have proven to be highly vulnerable to critical inefficiencies triggered by selfish routing behavior. The interaction between crowds scrambling for the shortest route and slow upward stair speeds exclusively triggers the manifestation of Braess's Paradox, where the freedom to choose routes actually paralyzes the entire system. Investing in a dynamic digital signage system is crucial, as it has been proven capable of reducing underground RSET by 41.4% without any physical structural modifications. The implementation of such a DERS has also been empirically proven valid and effective in directing crowds and preventing congestion in high-rise building infrastructures [11], with supporting evidence from virtual reality-based evacuation experiments assessing human cognitive workload [26]. Furthermore, integrating such simulation findings with system safety frameworks such as FRAM and RAG [27] can strengthen the overall operational resilience assessment of the facility.
2. Development of proactive emergency response plans
Conventional evacuation procedures that generally instruct personnel to "exit via the nearest route" must be evaluated and further developed when applied to underground facilities. Based on the simulation results, leaving evacuation decisions to natural human instincts (selfish routing) is empirically demonstrated to trigger lethal bottlenecks due to the Braess's Paradox anomaly. Therefore, the formulation of an emergency response plan for underground architectures must incorporate proactive strategies, where fire wardens are instructed to immediately break up and lock personnel flows into secondary (detour) routes from the very first minute the evacuation begins.
This research quantitatively proves the pure impact of vertical architecture on evacuation effectiveness through an apple-to-apple variable isolation approach. The main conclusion of this study is that under 100% identical geometric layout and travel distance conditions (0.3% difference), the underground facility inherently produced a RSET 60.7% longer than the above-ground facility (448.8 seconds vs. 279.3 seconds). This time penalty is purely driven by the reduction in agents' biomechanical speed when moving against gravity, which triggers non-linear movement congestion effects on the vertical stair structures.
The most academically significant finding in this study is the identification of Braess's Paradox, which occurred exclusively in the underground architecture. The slow upward vertical evacuation flow created a critical bottleneck, such that when the shortest route was blocked and agents were "forced" to use a route that was 40.4% longer, the overall system evacuation time paradoxically improved by 4.5%. Conversely, the same route restriction intervention in the above-ground facility worsened the evacuation performance by 12.4%.
To overcome the lethal inefficiency of this selfish routing behavior, the implementation of guided evacuation proved to be crucial. This intervention was four times more effective in terms of absolute time savings when applied to the underground facility compared to the above-ground facility, successfully leveling the congestion load and substantially reducing the RSET by 41.4%. The significance of this research justifies that underground facilities require an active and dynamic evacuation route management system to compensate for the physical limitations of their vertical routes and narrow their performance gap from 1.61 times delay ratio to merely 1.13 times.
This study acknowledges several limitations that should be considered when interpreting the findings. First, to maintain strict ceteris paribus variable isolation, the underground geometry was constructed by inverting the functional orientation of the baseline above-ground model rather than replicating a specific existing underground facility. While this approach ensures internal validity for the comparative analysis, it may not capture site-specific topological constraints such as extended access tunnels found in certain underground installations. Second, the simulation exclusively modeled evacuation movement time without integrating fire dynamics, smoke propagation, toxic gas spread, or pre-movement time. Consequently, the results do not constitute a complete available safe egress time assessment; future studies should integrate fire dynamics simulator coupling to evaluate safety margins under realistic fire scenarios. Third, all 163 agents were modeled with uniform physical capabilities (walking speed 1.19 m/s, shoulder width 45.58 cm), deliberately excluding demographic variability such as age, fatigue, equipment carrying, or psychological panic responses. This uniform assumption serves as a controlled experimental mechanism to ensure that any measured performance difference is attributable solely to building topology rather than population heterogeneity. Fourth, each scenario was executed as a single deterministic run; randomizing agent placements across repeated iterations would violate the variable isolation requirement since agents would no longer occupy identical (x, y) positions and floor assignments in both models. Despite these constraints, the controlled methodology ensures that the comparative conclusions between above-ground and underground architectures remain internally valid, as both models were subjected to identical assumptions. As a direction for future research, experimental validation of Braess's Paradox and human compliance sensitivity is highly recommended. Future research may also integrate agent-based evacuation models with Safety-II frameworks such as Functional Resonance Analysis Method (FRAM) and Resilience Analysis Grid (RAG) to extend the analysis toward socio-technical resilience assessment, complemented by Virtual Reality (VR)-based experimental validation of human evacuation behavior and cognitive workload.
This research is supported by the System and Technology Innovation Study Program, School of Interdisciplinary Management and Technology, Institut Teknologi Sepuluh Nopember (ITS), Surabaya. The authors gratefully acknowledge PT PLN Nusantara Power for providing the Pathfinder simulation software license and the power plant facility management for providing the as-built drawing documents and operational data, which were crucial for validating the simulation modeling geometry in this research.
|
ABM |
Agent-Based Modelling |
|
DERS |
Dynamic Evacuation Routing System |
|
LOS |
Level of Service |
|
N |
Total number of samples |
|
NFPA |
National Fire Protection Association |
|
OHS |
Occupational Health and Safety |
|
PBD |
Performance-Based Design |
|
r |
Effect size (rank-biserial correlation) |
|
RSET |
Required Safe Egress Time, s |
|
SO |
System Optimum |
|
StdDev |
Standard deviation |
|
UE |
User Equilibrium |
|
z |
z-score |
[1] Kwegyir-Afful, E., Hassan, T.O., Kantola, J.I. (2022). Simulation-based assessments of fire emergency preparedness and response in virtual reality. International Journal of Occupational Safety and Ergonomics, 28(2): 1316-1330. https://doi.org/10.1080/10803548.2021.1891395
[2] Cho, Y.S., Kim, D.M., Im, G.T. (2021). Risk assessment through fire and evacuation simulation in the main control room of a domestic thermal power plant. Fire Science and Engineering, 35(6): 68-74. https://doi.org/10.7731/kifse.74b49af9
[3] Benseghir, H., Ibrahim, A.B., Nurul Islam Siddique, M., Nomani Kabir, M., Alginahi, Y.M. (2020). Modelling emergency evacuation from an industrial building under spreading fire using a social force model with fire dynamics. Materials Today: Proceedings, 41: 38-42. https://doi.org/10.1016/j.matpr.2020.10.999
[4] Hurley, M.J., Gottuk, D.T., Hall Jr., J.R., Harada, K., et al. (2015). SFPE Handbook of Fire Protection Engineering Fifth Edition. Springer, pp. 1-3493. https://doi.org/10.1007/978-1-4939-2565-0
[5] Usman, F., Banuar, N. (2006). Risk analysis of hydroelectric power station considering identified risk factors based on condition distress rating. ARPN Journal of Engineering and Applied Sciences, 12(1): 115-120.
[6] Georgiadou, P.S., Papazoglou, I.A., Kiranoudis, C.T., Markatos, N.C. (2007). Modeling emergency evacuation for major hazard industrial sites. Reliability Engineering and System Safety, 92(10): 1388-1402. https://doi.org/10.1016/j.ress.2006.09.009
[7] Wang, Z., Wilson, P., Wang, Q.S. (2016). Evacuation simulation of confined spaces in petrochemical facilities. Process Safety Progress, 35(3): 270-275. https://doi.org/10.1002/prs.11792
[8] Augustine, P.C., Moniri-Morad, A., Shahsavar, M., Sattarvand, J. (2024). Investigating the effect of human factors on the underground mine evacuation process using agent-based simulation. Applied Sciences (Switzerland), 14(24): 11773. https://doi.org/10.3390/app142411773
[9] Li, X.J., Chen, W.B., Wang, C., Kassem, M.A. (2022). Study on evacuation behavior of urban underground complex in fire emergency based on system dynamics. Sustainability, 14(3): 1343. https://doi.org/10.3390/su14031343
[10] Gasparetto, F.C., Pilz, S.E., Pavan, R.C., Costella, M.F. (2018). Computer simulation and fire drill in an educational building. International Journal of Advanced Engineering Research and Science, 5(7): 247-255. https://doi.org/10.22161/ijaers.5.7.32
[11] Sudiarno, A., Amanullah, D.A., Akbar, R.A. (2022). The measurement of evacuation effectiveness regarding dynamic evacuation routing system (DERS) in high-rise building using virtual reality simulation. International Journal of Safety and Security Engineering, 12(1): 115-122. https://doi.org/10.18280/ijsse.120114
[12] Thunderhead Engineering. (2023). Pathfinder - Technical Reference Manual (2023.1). https://www.thunderheadeng.com/docs/2023-1/pathfinder/technical-reference-manual/.
[13] Xiao, M.F., Zhou, X.H., Han, Y.C., Bai, G., Wang, J., Li, X.L., Sunya, S. (2021). Simulation and optimization of fire safety emergency evacuation in university library. AIP Advances, 11(6): 065323. https://doi.org/10.1063/5.0056046
[14] Kong, S.L., Guo, W.X., Wang, W. (2023). Research on evacuation simulation of university teaching building based on pathfinder. In Proceedings of the 3rd International Conference on Big Data Economy and Information Management, BDEIM 2022, Zhengzhou, China, pp. 1-9. https://doi.org/10.4108/eai.2-12-2022.2328684
[15] Lu, L.G., Ji, J.W., Yang, S.F., Xie, X.L. (2015). A study on personnel safety evacuation in underground commercial space based on EXODUS. In 2015 International Conference on Mechatronics, Electronic, Industrial and Control Engineering (MEIC-15), pp. 247-251. https://doi.org/10.2991/meic-15.2015.59
[16] Yaman, M., Kurtay, C. (2025). Analysis of fire evacuation scenarios in children's cultural centers. Journal of Safety Science and Resilience, 6(1): 114-123. https://doi.org/10.1016/j.jnlssr.2024.08.002
[17] Hadjisophocleous, G.V., Bénichou, N. (2001). Development of performance-based codes, performance criteria and fire safety engineering methods. International Journal on Engineering Performance-Based Fire Codes, 2(4): 127-142.
[18] Thornton, C., O’Konski, R., Klein, B., Hardeman, B., Swenson, D. (2013). New wayfinding techniques in pathfinder and supporting research. In Pedestrian and Evacuation Dynamics 2012, pp. 1315-1322. https://doi.org/10.1007/978-3-319-02447-9_108
[19] Kuligowski, E.D., Peacock, R.D., Reneke, P.K., Weiss, E., et al. (2014). Movement on stairs during building evacuations. NIST Technical Note 1839. https://doi.org/10.6028/NIST.TN.1839
[20] Braess, D., Nagurney, A., Wakolbinger, T. (2005). On a paradox of traffic planning. Transportation Science, 39(4): 446-450. https://doi.org/10.1287/trsc.1050.0127
[21] Fritz, C.O., Morris, P.E., Richler, J.J. (2012). Effect size estimates: Current use, calculations, and interpretation. Journal of Experimental Psychology: General, 141(1): 2-18. https://doi.org/10.1037/a0024338
[22] Hua, Y., Zhao, J.C., Li, H.T., Duan, L.P. (2024). Shortest or locally quickest? A prediction-based approach for evacuation choice simulation between multiple staircases. Journal of Safety Science and Resilience, 5(3): 281-294. https://doi.org/10.1016/j.jnlssr.2024.04.001
[23] Wang, J.H., Lv, W. (2025). Exploring Braess' paradox in pedestrian evacuation traffic: Experiment and modeling. arXiv preprint arXiv:2509.11736. https://doi.org/10.48550/arXiv.2509.11736
[24] He, S.S., Wang, Q., Chen, J., Ding, H., Ma, J. (2025). Efficiency paradox and robustness of elevator-assisted evacuation in a deeply buried subway station. Physica A: Statistical Mechanics and Its Applications, 680: 131035. https://doi.org/10.1016/j.physa.2025.131035
[25] Roughgarden, T. (2005). Selfish Routing and the Price of Anarchy. The MIT Press.
[26] Sudiarno, A. and Wahyuni, A.D. (2020). Analysis of human factors and workloads in earthquake disaster evacuation simulations using virtual reality technology. IOP Conference Series: Materials Science and Engineering, 1003: 012082. https://doi.org/10.1088/1757-899X/1003/1/012082
[27] Sudiarno, A., D Ma’arij, A.M. (2023). System safety assessment of the warehouse operation using functional resonance analysis method and resilience analysis grid. Kesmas, 18(4): 271. https://doi.org/10.21109/kesmas.v18i4.7396