Muhammad Fathur Rouf Hasan![]() | Adi Susilo*
| Adi Susilo*![]() | Eko Andi Suryo
| Eko Andi Suryo![]() | Putera Agung Maha Agung
| Putera Agung Maha Agung![]() | Kevin Ciputra
| Kevin Ciputra![]() | Mohammad Singgih Purwanto
| Mohammad Singgih Purwanto![]() | Mustaffa Anjang Ahmad
| Mustaffa Anjang Ahmad![]() | Adnan Zainorabidin
| Adnan Zainorabidin![]()
© 2025 The authors. This article is published by IIETA and is licensed under the CC BY 4.0 license (http://creativecommons.org/licenses/by/4.0/).
OPEN ACCESS
Landslides are known to cause significant infrastructure damage and subsequently generate substantial economic losses. One area that is particularly susceptible to such events is the roadway connecting Malang-Kediri and Batu City, Indonesia. This corridor carries a high volume of traffic; therefore, any landslide occurrence has severe implications, including the complete disruption of transportation access. This study investigates the slope factor of safety (FS) to evaluate landslide potential along the Malang-Kediri connecting road using Cone Penetration Test (CPT) data. The FS of the existing slopes was assessed using CPT results as the primary field data to estimate soil physical and mechanical properties. Numerical simulations were conducted using GeoStudio (GeoSlope) Version 8.0 to compute FS values for natural, dry, and saturated (rainy-season) conditions. All analyses were performed under at-rest conditions, without including ground improvement measures. The results indicate that 4 out of 9 modeled scenarios exhibit instability: Slope S-1 under scenarios 2 and 3, and Slopes S-2 and S-3 under scenario 3. In general, slopes became unstable in scenario 3, where the combined effects of traffic loading and elevated pore water pressures substantially reduced shear resistance. Under these conditions, slopes demonstrated failure potential when FS < 1.07. The calculated FS values at points S-1, S-2, and S-3 were 0.55, 0.59, and 0.74, respectively, indicating critical instability. Field observations reveal that soft, organic, clay-rich soils in the upper layers dominate the unstable slope sections. These materials possess low shear strength and are highly susceptible to deformation under excessive loads. Consequently, under scenario 3 loading conditions, the inherent weakness of these soil layers contributes significantly to slope failure. Further investigations are necessary to design appropriate soil improvement strategies and slope reinforcement measures to mitigate future landslide risks along this critical transportation corridor.
Bishop method, CPT, hillslope, landslide, Malang-Kediri road, factor of safety
Natural disasters such as landslides can generate a wide range of adverse impacts, including structural damage, economic disruption, agricultural losses, and even fatalities [1, 2]. Landslides occur worldwide, particularly in mountainous regions [3]. Their potential increases with high rainfall intensity and steep slope conditions [4]. During the rainy season, elevated water discharge increases the load acting on slopes, degrades soil structure, and reduces soil bearing capacity, ultimately triggering slope failures [5]. Slope stability is directly related to the occurrence of landslides and mass movements [6], defined as the natural displacement of soil material from a higher to a lower elevation. Several factors may induce ground movement, including steep topography, slope modification for roadway construction, and weak soil layers [7].
Batu City, Indonesia, is widely known as a tourism destination; however, one of its main access routes, the Malang-Kediri road, is highly prone to landslides. According to the Batu City Disaster Management Agency (BPBD), 78 landslide events were recorded in 2022 alone [8]. The most frequently affected area is the Malang-Kediri road segment, which lies within a hilly terrain with slope gradients ranging from 40º to 50º [9, 10]. This region also experiences high rainfall intensity. Moreover, the roadway serves as a primary transportation corridor between the two cities, resulting in high traffic density. Consequently, landslides in this area cause severe disruption, as road repairs require considerable time, leading to complete isolation of transportation access [11].
Although landslides cannot be entirely prevented, various measures as mitigation strategies can be implemented to minimize risks in landslide-prone areas [12, 13]. One such approach is conducting landslide potential assessments as part of disaster mitigation strategies. Investigating landslide susceptibility requires an understanding of subsurface soil stratigraphy at the study location. Traditionally, landslide boundary identification and characterization rely on borehole investigations (direct methods) [14]. Several geotechnical in-situ tests commonly used to determine soil layer properties include the Pressuremeter Test (PMT), Standard Penetration Test (SPT), Cone Penetration Test (CPT), and others [15]. This study utilizes CPT because it offers several advantages over alternative in-situ tests, including high accuracy in characterizing soft soils, minimal disturbance to soil structure, and the ability to evaluate soft soils that are difficult to sample using conventional methods [16].
Previous research by Potvin et al. [17] used CPT to assess reworked soil formation following a landslide event at Mud Creek, Ottawa. Their findings demonstrated that slip surfaces can be identified through changes in cone resistance, marking the transition between reworked material above the slip surface and intact soil below it. Ryan et al. [18] used CPT to test the hypothesis that water-saturated clay-rich basal layers act as slip planes. The results confirmed that smectite-rich clay layers served as the slip surface, and the CPT profile also showed strength reduction at depths corresponding to the smectite horizon. Champi et al. [19] conducted a slope stability assessment in the Palapye region, Botswana, using CPTu data coupled with limit equilibrium analysis. Their use of random variable parameters and probability density functions showed that factors of safety yielded by limit equilibrium and finite element methods were consistent, with an average difference of ±5.28%. Building on these findings, the present study provides a slope stability analysis using CPT data complemented by factor-of-safety calculations for multiple conditions, enabling the identification of the most critical scenarios that trigger landslide potential along the Malang-Kediri road.
CPT results can be utilized to determine the physical and mechanical properties of soils at various depths, providing essential input for soil structure modelling. Therefore, this study aims to analyze the slope factor of safety (FS) to evaluate landslide potential along the Malang-Kediri (Trunojoyo road) corridor based on CPT data. The outcomes of this research are expected to serve as a reference for relevant stakeholders—such as road authorities, planners, engineers, and local communities—in future development and maintenance of this critical transportation route [20].
2.1 CPT equipment
The sounding instrument used is a Dutch Cone Penetrator with a capacity of 2,500 kg, using the Biconus standard cone of 10 cm². Resistance measurements are taken every 20 cm. Penetration rate, testing protocol, data sampling frequency, and procedures for stopping/advancing in soil layers are typically 20 mm/s. Based on geological data and preliminary investigations, the soil conditions at the site are generally homogeneous laterally and vertically. Therefore, four CPT points are considered sufficient to represent the variation in soil conditions in the analyzed area, and the soil layers are relatively homogeneous. The study area is small (< 1,000 to 3,000 m²), and 3 CPT points are often considered adequate; they can provide a proper geotechnical picture of the study area.
2.2 Data collection
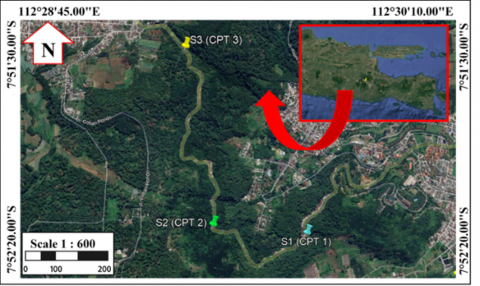
The field investigation using CPT was conducted on the Malang-Kediri (Trunojoyo) road, which is heavily trafficked from Malang to Kediri and vice versa. There were 3 points (S-1, S-2, and S-3) for the investigation of CPT with a capacity of 2.5 tons at Trunojoyo road of Batu City (Figure 1). The penetration process was conducted continuously and stopped when the cone or tip resistance (qc) exceeded 250 kg/cm² [21], indicating the hard soil layer. The standard operational procedure adopted the ASTM D-3441 [22]; the CPT tool consists of a steel biconus, 2 manometers, and rods. The values of qc (cone penetration) and fs (friction sleeve) were obtained during the penetration process. Friction ratio (Rf) is the ratio of sleeve friction to tip resistance, expressed as a percentage. Physical and mechanical properties were predicted using some correlations [23]. The location of the S-1 point at the gate of Batu City from the Kediri direction, and the Slope at the S-1 location were identified as similar to those of S-2 and S-3. All slopes were classified as steep and susceptible to landslides. In the study area, the type slope consists of the natural slope, which constantly changes due to slope-sliding phenomena that occur each year. The steep slope eventually turns into a gentle slope, and surface water can flow at the top layer during the rainy season. Therefore, the water flow caused by precipitation must be regulated to prevent it from becoming dangerous and overflowing onto the highway.
Figure 1. Overview of research location
2.3 Determination of soil parameters
The results of the correlation of CPT data in determining physical and mechanical parameters were obtained from tip resistance (qc) and friction ratio (Rf). Soil layer types or soil classification uses the correlation [24]. Geotechnical engineers commonly classify underground geomaterials using CPT results with the classification diagrams [25]. The soil type’s weight volume is determined using the method [26]. Strength parameters (c;f) are defined from the correlation method [27], and several parameter is determined by some references [28]. Some important parameters to evaluate the FS of slope stability analysis were (c) or cohesion (kN/m2), (γ) or unit weight soil (kN/m3), and ϕ = internal friction angle (°) [29]. A correlation between the CPT test data and the soil geometry parameters is required to obtain these parameters [30].
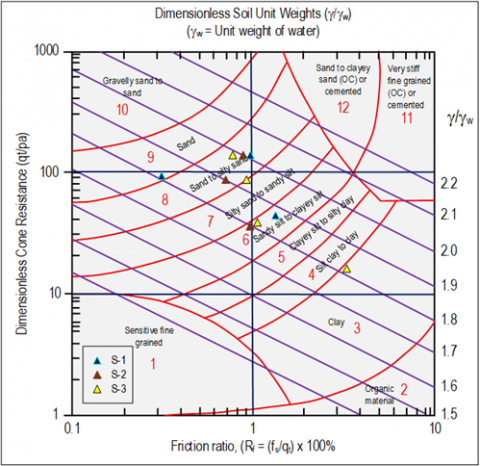
Soil classification can be determined by dimensionless correlation cone tip or resistance (qt) and friction ratio (Rf) [31], as shown in Figure 2, where (qt) is cone resistance (qc) divided by the atmospheric pressure. This prediction of soil classification may have some deviations [32]. However, the figure could be used to approach the name of the soil layer. These physical and mechanical parameters could be used to simulate and analyze landslide potential and determine the FS. The slope with FS < 1.07 may be unstable and is potentially prone to sliding. Simulation analysis used 3 scenarios on each slope to evaluate slope stability. Scenario 1 was an existing condition without traffic load; scenario 2 was identified as the existing slope with traffic load during dry conditions, and scenario 3 was the existing slope with traffic load during rainy conditions.
Figure 2. Determination of unit weight using (Rf) [33]
2.4 Slope stability analysis in determining factor of safety
Parameters of cohesion (c) and internal shear angle (f) could be defined by Mohr-Coulomb’s theory [34]. These parameters would be used to simulate the slope stability using the Bishop Simplified Method. This method would divide the soil slope plane in the existing area into several slices. The forces acting on each slice were obtained from mechanical equilibrium calculations. Each slice is analyzed separately, and the interaction between slices is ignored because the resultant force is parallel to each slice. Table 1 shows the classification of stable and unstable slopes.
Table 1. Factors of safety reviewed from landslide intensity [35]
|
FS |
Landslide Intensity |
|
FS ˂ 1.07 |
Landslides occurred regularly/frequently (unstable slope) |
|
FS between 1.07-1.25 |
Landslide case (critical slope) |
|
FS > 1.25 |
Rare landslide (relatively stable slope) |
Geoslope software (Version 8.0) is used to evaluate the FS analysis. Bishop’s method, as one of the methods of stability analysis, could be applied to simulate the stability of all slopes in a short time [36]. The advantage of the Geoslope program is that it can analyze landslide potential at once, thereby shortening the analysis time [37]. The working principle of the Geoslope program using the Bishop method is the limit equilibrium equation, which divides the slope into slices and analyzes the forces acting on each slice [38]. All soil parameters, including physical and mechanical properties for each layer, can be entered into the Geoslope program. The modeling and soil parameters for the most critical slope could be applied and yield the FS. After the program is run, the factors of safety and slip surface are obtained. The next step uses the limit equilibrium analysis type with the Bishop method [39]. The calculation method is based on the assumption that the slip surface of the slope is cylindrical, due to its suitability to field reality and its simplicity in calculation [40].
3.1 CPT data processing
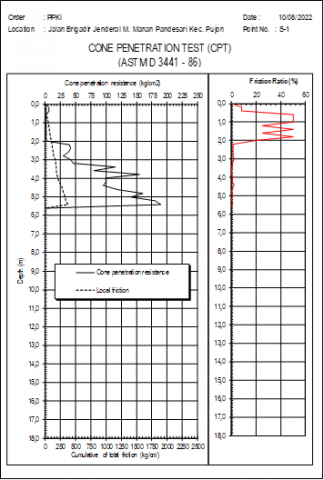
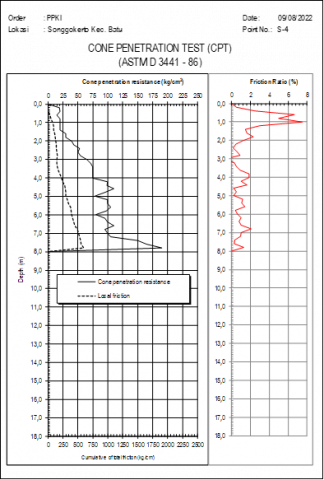
The CPT test data (Figure 3) is presented graphically to identify landslide potential, with the blue line showing the qc fluctuation. It is concluded that the change in cone price is due to changes in soil layer type; therefore, the bearing capacity of each soil layer will differ. The preparation of parameters at this depth uses additional existing data (SPT and laboratory data). CPT testing has the advantage of providing accurate data on the penetration of soft (shallow) soils. Still, it is not effective for determining the bearing capacity of deep soils due to tool limitations, and the test tool will stop if small rocks hold the steel cone, even though the test tool has not reached the depth of hard soil [40]. Figure 3 shows the differences in soil layers from S-1 to S-3 and the plotting results used to determine soil classification.
(a) S-1 CPT test result
(b) S-2 CPT test result
(c) S-3 CPT test result
Figure 3. CPT test data
Generally, soil classification (Figure 4) consists of the topsoil from organic soil to the deeper layers, from non-cohesive, coarse-grained to cohesive, fine-grained [41]. These layers are susceptible to sliding during the rainy season. The non-cohesive coarse-grained material that exists between the cohesive fine-grained material can trigger movement of the soil towards the foot of the slope. Meanwhile, fine-grained soils are classified as high to moderate landslide susceptibility [42]. Large external loads acting on the pavement layer further accelerate ground movement. The change in water content is possible as part of the alternate shear strength of soil layers.
Figure 4. Soil classification using the CPT data [43]
There were some correlations in determining physical and mechanical properties from CPT data (qc; fs; Rf). The geotechnical parameters used to analyze the slope stability of each slope are shown in Table 2. Sometimes, the physical and mechanical parameters must be defined by the soil layer type data only from (qc) and (Rf) parameters because the cohesion (c) and internal shear angle (ϕ) could not be determined from (qc) and or (fs) only or (Rf) parameters as the baseline, soil layer from classification from prediction data graphically classified as silty sand and sandy silt layers could be used the other geotechnical parameters, such as saturated weight volume (γsat), unsaturated weight volume (γunsat), elastic modulus (Es), etc. In one case shown in Figure 2, the correlation analysis was used to determine weight volume (γ/γw) and soil classification using (qt or qc) and (Rf).
Table 2. Soil parameter correlation result
|
Slope S-1 |
|||||
|
Parameter |
Layer 1 |
Layer 2 |
Layer 3 |
Layer 4 |
Unit |
|
Depth (m) |
0.0-2.0 |
2.2-3.2 |
3.4-4.2 |
4.4-5.4 |
(m) |
|
Soil Classification |
Organic |
Sandy Silt |
Sand |
Sand |
- |
|
Unit Weight Soil Unsaturation (γunsat) |
16 |
18 |
19 |
19 |
kN/m3 |
|
Unit Weight Soil Unsaturation (γsat) |
17 |
19 |
20 |
20 |
kN/m3 |
|
Friction Angle (ϕ) |
3 |
35 |
39 |
42 |
(°) |
|
Cohesion (c) |
0 |
20 |
5 |
5 |
kN/m2 |
|
Slope S-2 |
|||||
|
Parameter |
Layer 1 |
Layer 2 |
Layer 3 |
- |
Unit |
|
Depth (m) |
0.0-1.4 |
1.6-7.2 |
7.4-7.6 |
- |
(m) |
|
Soil Classification |
Silty sand to Sandy Silt |
Sand to Silty Sand |
Sand |
- |
- |
|
Unit Weight Soil Unsaturation (γunsat) |
17 |
19 |
20 |
- |
kN/m3 |
|
Unit Weight Soil Unsaturation (γsat) |
18 |
20 |
21 |
- |
kN/m3 |
|
Friction Angle (ϕ) |
35 |
38 |
42 |
- |
(°) |
|
Cohesion (c) |
15 |
10 |
5 |
- |
kN/m2 |
|
Slope S-3 |
|||||
|
Parameter |
Layer 1 |
Layer 2 |
Layer 3 |
Layer 4 |
Unit |
|
Depth (m) |
0.0-1.4 |
1.6-2.6 |
2.8-7.0 |
7.2-7.8 |
(m) |
|
Soil Classification |
Silty Clay to Clay |
Silty Sand to Sandy Silt |
Sand to Silty Sand |
Sand |
- |
|
Unit Weight Soil Unsaturation (γunsat) |
17 |
18 |
19 |
19 |
kN/m3 |
|
Unit Weight Soil Unsaturation (γsat) |
18 |
19 |
20 |
20 |
kN/m3 |
|
Friction Angle (ϕ) |
25 |
35 |
38 |
42 |
(°) |
|
Cohesion (c) |
25 |
15 |
10 |
5 |
kN/m2 |
Results of the correlation analysis between CPT data, unit weight, and soil classification. Based on the graph above, in addition to obtaining the soil classification, (γ/γw) is also obtained (γ/γw), where the soil content weight is determined by pulling the intersection point of (qt) and (Rf) down to get (γ/γw). The weight of the soil content is obtained from (γ/γw)multiplied by (γw). The average slope gradient is larger than 60%, meaning a steep slope. Based on the results of the correlation of CPT data and geotechnical parameters, the unit weight soil (γ), internal friction angle (ϕ), and cohesion (c) for each soil layer were obtained.
The sounding tool is handy for predicting landslides because it provides detailed soil layer profiles, estimates shear strength parameters, and detects weak zones and pore water pressures, which play significant roles in slope failure. In practical analysis some pay attention should be given in determining soil bulk density or weight volume (γ); overburden stress (σv0) and (σ’v0); undrained cohesion (cu) and internal shear angle (f); and deformation modulus (Es) especially for cohesive fine grained; and finally for non-cohesive in determining density relative (Dr) during simulation using the finite element analysis or software for genotechnical analysis (geostudio or slope W).
3.2 Discussion
Landslide potential analysis was conducted for 3 scenarios on each slope to determine the lowest FS. Scenario 1 simulates the slope not receiving any load. The study of scenario 1 was intended to determine the primary FS of the hill. Scenario 2 slopes received dead and live loads. Scenario 2 slopes were simulated under normal traffic conditions and in dry conditions. Scenario 3 slope receives dead load, live load, and pore water pressure—scenario 3 slope condition with normal traffic during rainy conditions. Scenario 3 was chosen because landslides in research locations occur more frequently during the rainy season. Scenario 2: to determine the slope that is already in critical condition and even unstable during dry conditions. Scenario 1 is to determine whether the foundation soil layer on the road body is stable or unstable. The analysis with 3 slope scenarios aims to simulate the actual conditions as accurately as possible. Rainfall conditions were added to assess landslide potential.
Figure 5. Slope analysis result
The slope analysis found that 4 of 9 scenarios are unstable: Slope S-1 in scenarios 2 and 3, and Slopes S-2 and S-3 in scenario 3. Based on Figure 5, the unstable slope at the point of S-1 was more caused by the composition of the organic layer failure at the top layer. This layer was very soft and could not withstand traffic loads. The FS value at the S-1 point decreased drastically from 1.744 to 1.049 between scenario 1 and scenario 2. Then, scenario 3 at the S-1 point reached the lowest FS (around 0.55) during rainy conditions. Some references stated that an FS value lower than 1.07 would be classified as an unstable slope.
According to some references, if the FS < 1.07, the slope is unstable. The slip surface obtained from the analysis can be used to simulate the slope collapse. Slope loading scenarios can weaken the slope’s strength and cause the slope’s condition to become unstable. Further research is required to design and improve the topsoil on this scene based on the slip surface. Mainly, the S-2 and S-3 points consisted of sandy silt and silty sand. Based on scenarios 1 and 2, S-2 and S-3 were stable with an FS > 1.07. However, S-2 and S-3 points became unstable or FS < 1.07 during scenario 3 (rainy session). The unstable slope was caused by the accumulation of water from the crest to the toe, and all soil layers near the phreatic line became saturated during the rainy season. Finally, the pore water pressure would increase due to water infiltration, thereby influencing the total stress. Furthermore, the presence of water in rocks reduces the coefficient of friction and cohesion between mineral particles [44]. Then, the effective stress would decrease, and soil layers could move to the toe of the slope because the effective stress would not be able to retain the soil grains around the slope.
Slopes with natural soil conditions without loads are stable with FS > 1.25; when they receive traffic loads, they tend to remain stable even though the FS has decreased. The determination of this value was based on considerations of the external loads (in this case, the traffic load) acting on the slope area, and the slope remains stable along the FS for a few moments. However, in scenario 3, when the slope is subjected to traffic loads and pore water pressure, the slope becomes unstable and has the potential for landslides when FS < 1.07. This study found the FS equals 0.55, 0.59, and 0.74, respectively, according to S-1, S-2, and S-3. Furthermore, the depth of the slip surface can be determined from changes in the qc value during the penetration process. According to some references, the slip plane location can be inferred from the (qc) value, which is higher in the layer above the slip plane than in the layer below it [17]. More in-depth analysis is needed to determine a more accurate slip surface; one approach is to use Geostudio or slope-W software.
Generally, the soil layers in the study area are dominated by sandy silt and silty sand layers. From some references, both soil types have low cohesion (c) and high internal friction angles [45]. The type of soil layers and parameters result in different types of landslides. An unstable slope with toppling failure and a rotational slip surface is more likely to occur because cohesion (c) is very small and cannot resist the movement of soil grains when subjected to external loads around the slope. On the contrary, a translational landslide occurs when the internal shear angle is minimal, resulting in soil movement. Slopes with organic material can be weak, susceptible to landslides, or have a low FS. Soil replacement and ground improvement systems would be needed to stabilize these slopes. Pore water pressure increases during rainy periods and triggers soil movement from the crest to the toe of the slope. Slope instability can be caused by water infiltration from the slope crest due to rainfall intensity and duration. Pore water pressure can be reduced by installing drainage channels along the slope and/or replanting vegetation to prevent soil movement from the slope crest.
The CPT can effectively predict slope stability in hilly terrain and determine FS, as it is the easiest tool to mobilize at the study site. However, sometimes the CPT cannot penetrate the hard layers because soil layers contain some gravel fractions between the grains of the soft soil. Advanced CPT tools, such as CPTU, can measure pore water pressure directly during penetration into soft soil and evaluate soil parameters, providing more accurate estimates of the FS value.
CPT equipment can be used to assess pore pressure and shear strength, two critical factors that regulate slope stability. CPT devices were deployed in undisturbed soil layers of the body slope. CPT devices were placed in the main body of the slide, across the toe of the slope, and in undisturbed slope soil layers. Cone resistance of the body slope, which ranges between 10 and 1765 kPa, will correspond to undrained shear strengths from 5.0 to 25 kPa.
Despite the evidence for landslide features in the study area, the gravity core description alone cannot unambiguously distinguish between the undisturbed and soil-layer deposits. The deposit represents primary sedimentary rock and, therefore, the Landslide is either older and was not reached by the CPT data. Since we were unable to perform long-term pore-pressure dissipation experiments, we cannot safely propose the physical trigger mechanism for the landslide types [46]. Scientific assessment methods for evaluating soil strength are still lacking. Thus, future research should focus on predicting the spatial distribution of the physical and mechanical parameters of slope soils from the top to the toe.
The result of FS for the S-1 point of CPT based on slope stability analysis shows instability during dry and rainy sessions, especially for scenarios 2 and 3, respectively, with the values of FS = 1.04 and FS = 0.55. The slope near the S-1 is not stable in dry conditions because the upper soil (organic soil) layer is capable of receiving the traffic load at the top of the slope. But slopes near S-2 and S-3 points are stable in dry conditions and unstable in rainy conditions. The FS for dry conditions (scenario 2) equals 1.33 and 1.35, and during rainy conditions (scenario 3), FS equals 0.59 and 0.74, respectively. Seepage of rainwater into the soil layer at the top of the slope reduces the effective stress due to pore water pressure. All slopes will be unstable during the rainy seasons and are at risk of landslides. The contents of gravel fractions in the soft soil grain also contribute to soil movement toward the toe of the slope in the study area.
This work is supported by the Directorate of Research, Technology, and Community Service (DRTPM) through funding for doctoral dissertation research (Grant No.: 045/E5/PG.02.00.PL/2024 and Derivative Grant No.: 00309.9/UN10.A0501/B/PT.01.03.2/2024).
|
FS |
Factor of safety |
|
qc |
Cone resistance (kg/cm² / kPa) |
|
fs |
Friction sleeve |
|
fr |
Sleeve resistance |
|
Rf |
Friction ratio |
|
qt |
Tip resistance |
|
c |
Cohesion (kN/m²) |
|
Greek symbols |
|
|
ϕ |
Internal friction angle, ° |
|
γ |
Unit weight soil, kN/m³ |
|
γsat |
Saturated unit weight, kN/m³ |
|
γunsat |
Unsaturated unit weight, kN/m³ |
|
Es |
Elastic modulus |
|
γw |
Unit weight of water, kN/m³ |
|
γ/γw |
Soil-to-water unit weight ratio |
[1] Idrus, I.A., Kamal, K., Syah, S. (2025). Challenges and development of disaster mitigation policies in North Luwu Regency: Strengthening post-disaster resilience. International Journal of Safety and Security Engineering, 15(3): 491-498. https://doi.org/10.18280/ijsse.150308
[2] Hasan, M.F.R., Salimah, A., Susilo, A., Rahmat, A., Nurtanto, M., Martina, N. (2022). Identification of landslide area using geoelectrical resistivity method as disaster mitigation strategy. International Journal of Advanced Science, Engineering and Information Technology, 12(4): 1484-1490. https://doi.org/10.18517/ijaseit.12.4.14694
[3] Ghiasi, V., Pauzi, N.I.M., Karimi, S., Yousefi, M. (2023). Landslide risk zoning using support vector machine algorithm. Geomechanics and Engineering, 34(3): 267-284. https://doi.org/10.12989/gae.2023.34.3.267
[4] Hasan, M.F.R., Susilo, A., Suryo, E.A., Agung, P.A.M., Pratiwie, D.L., Dewi, N.M. (2024). Assessment and simulation of potential landslide caused by the rainfall intensity in Batu City during 2021. IOP Conference Series: Earth and Environmental Science, 1314: 012017. https://doi.org/10.1088/1755-1315/1314/1/012017
[5] Alhadi, Z., Rahman, A., Yusran, R., Eriyanti, F., Antomi, Y., Permana, I. (2025). Dynamics of flood and landslide risk governance policy in Solok Regency, Indonesia. International Journal of Safety and Security Engineering, 15(6): 1197-1217. https://doi.org/10.18280/ijsse.150611
[6] Das, B.M., Sivakugan, N. (2017). Fundamentals of Geotechnical Engineering. Boston: Cengage Learning. https://researchonline.jcu.edu.au/42286.
[7] Bachri, S., Shrestha, R.P., Yulianto, F., Sumarmi, Utomo, K.S.B., Aldianto, Y.E. (2021). Mapping landform and landslide susceptibility using remote sensing, GIS and field observation in the Southern Cross Road, Malang Regency, East Java, Indonesia. Geosciences, 11(1): 1-15. https://doi.org/10.3390/geosciences11010004
[8] BPBD Batu City. (2023). Data on Disaster Events in Batu City (Data Kejadian Bencana Kota Batu). Batu City Government: Regional Agency for Disaster Management.
[9] Agung, P.A.M., Hasan, M.F.R., Baidhowy, M.S., Susilo, A., Suryo, E.A., Pramusandi, S., Adinegara, A.W., Pradiptiya, A. (2025). Soil shear strength analysis to determine landslide potential based on UU triaxial test. IOP Conference Series: Earth and Environmental Science, 1439: 012002. https://doi.org/10.1088/1755-1315/1439/1/012002
[10] Agung, P.A.M., Hasan, M.F.R., Dwiyasa, A.P., Susilo, A., Suryo, E.A., Pradiptiya, A. (2024). Slope failure lines analysis to determine landslide potential based on standard penetration test method. IOP Conference Series: Earth and Environmental Science, 1351(1): 012029. https://doi.org/10.1088/1755-1315/1351/1/012029
[11] Liu, Q., Zhang, B., Tang, A. (2023). Landslide risk of regional roads: Consider the road mileage of expected losses. Transportation Research Part D: Transport and Environment, 120: 103771. https://doi.org/10.1016/j.trd.2023.103771
[12] Agung, P.M., Hasan, M.R., Susilo, A., Ahmad, M.A., Ahmad, M.J.B., Abdurrahman, U.A., Sudjianto, A.T., Suryo, E.A. (2023). Compilation of parameter control for mapping the potential landslide areas. Civil Engineering Journal, 9(4): 974-989. https://doi.org/10.28991/CEJ-2023-09-04-016
[13] Hasan, M.F.R., Susilo, A., Haji, A.T.S., Suryo, E.A., Agung, P.M., Idmi, M.H., Musta, B. (2025). Subsurface mapping and geotechnical design for landslide mitigation. Civil Engineering Journal, 11(9): 3811-3825. https://doi.org/10.28991/CEJ-2025-011-09-015
[14] Costales-Iglesias, D., Jaya-Montalvo, M., Solórzano, J., Carrión-Mero, P. (2025). Geophysical investigations for the characterisation of the landslide zone, Pungalapampa-Puninhuayco-Alao, Chimborazo, Ecuador. International Journal of Safety and Security Engineering, 15(2): 233-245. https://doi.org/10.18280/ijsse.150204
[15] Akca, N. (2003). Correlation of SPT-CPT data from the United Arab Emirates. Engineering Geology, 67(3-4): 219-231. https://doi.org/10.1016/S0013-7952(02)00181-3
[16] Agung, P.A.M., Ahmad, M.A., Hasan, M.F.R. (2022). Probability liquefaction on silty sand layer on Central Jakarta. International Journal of Integrated Engineering, 14(9): 48-55. https://doi.org/10.30880/ijie.2022.14.09.007
[17] Potvin, J.J., Woeller, D., Sharp, J., Take, W.A. (2022). Stratigraphic profiling, slip surface detection, and assessment of remolding in sensitive clay landslides using the CPT. Canadian Geotechnical Journal, 59(7): 1146-1160. https://doi.org/10.1139/cgj-2019-0171
[18] Ryan, P.C., Mahmud, D., Derenoncourt, K.L., Nerbonne, L.F., Perez-Martin, I.L., Collovati, J.R., Junaid, M., Cerovski-Darriau, C. (2025). Smectite-rich horizons in Inceptisols trigger shallow landslides in tropical granitic terranes. Geoderma Regional, 40: e00897. https://doi.org/10.1016/j.geodrs.2024.e00897
[19] Champi, T., Verma, R., Lebitsa, G., Suglo, R.S. (2022). Modelling slope stability of slurry dams using cone penetration method. European Journal of Advanced Engineering and Technology, 9(5): 30-38.
[20] Luat, N.V., Do, T.N., Nguyen, L.C., Kien, N.T. (2024). Assessing landslide susceptibility along the Halong-Vandon expressway in Quang Ninh province, Vietnam: A comprehensive approach integrating GIS and various methods. Geomechanics and Engineering, 37(2): 135-147. https://doi.org/10.12989/gae.2024.37.2.135
[21] Ardi, P.G. (2018). Cone penetration test and pile recomendation in the rice field: A case study at Bogor Agricultural University outside domicile study program development area of Sukabumi, West Java. Russian Journal of Agricultural and Socio-Economic Sciences, 78(6): 519-524. https://doi.org/10.18551/rjoas.2018-06.61
[22] ASTM D-3441. (2016). Standard test method for mechanical cone penetration testing of soils. United States: American Standard Testing and Material.
[23] Eslami, A., Moshfeghi, S., Molaabasi, H., Eslami, M.M. (2019). Piezocone and cone penetration test (CPTu and CPT) applications in foundation engineering. Oxford: Butterworth-Heinemann.
[24] Roberson, P.K. (1990). Soil classification using the cone penetration test. Canadian Geotechnical Journal, 27: 151-158. https://doi.org/10.1139/t90-014
[25] Park, J., Cho, S.H., Lee, J.S., Kim, H.K. (2023). A study on data mining techniques for soil classification methods using cone penetration test results. Geomechanics and Engineering, 35(1): 67-80. https://doi.org/10.12989/gae.2023.35.1.067
[26] Robertson, P.K., Cabal, K.L. (2010). Estimating soil unit weight from CPT. In 2nd International Symposium on Cone Penetration Testing, pp. 1-8.
[27] Zein, A.K.M. (2017). Estimation of undrained shear strength of fine grained soils from cone penetration resistance. International Journal of Geo-Engineering, 8(9): 1-13. https://doi.org/10.1186/s40703-017-0046-y
[28] Robertson, P.K. (2011). Interpretation of cone penetration test-A unified approach. Canadian Geotechnical Journal, 46(11): 1337-1355. https://doi.org/10.1139/T09-065
[29] Hasan, M.F.R., Agung, P.A.M., Susilo, A., Suryo, E.A., Zainorabidin, A.B., Hermawan, A.R. (2024). Wedge slope failure of natural sedimentary rock formation based on weathering potential. International Journal of Design & Nature and Ecodynamics, 19(2): 387-396. https://doi.org/10.18280/ijdne.190204
[30] da Silva, E.M., Neto, J.C.D.S.P., da Silva, M.M., dos Santos, R.M., Lima, T.P. (2023). Stability analysis of talude of areal Morro Branco by simulating geoslope software. Seven Editora, 164: 1-9. https://doi.org/10.56238/tfisdwv1-164
[31] Agung, P.A.M., Sultan, R., Idris, M., Sudjianto, A.T., Ahmad, M.A., Hasan, M.F.R. (2023). Probabilistic of in situ seismic soil liquefaction potential based on CPT-data in Central Jakarta, Indonesia. International Journal of Sustainable Construction Engineering and Technology, 14(1): 241-248. https://doi.org/10.30880/ijscet.2023.14.01.021
[32] Erharter, G.H., Oberhollenzer, S., Fankhauser, A., Marte, R., Marcher, T. (2021). Learning decision boundaries for cone penetration test classification. Computer-Aided Civil and Infrastructure Engineering, 36(4): 489-503. https://doi.org/10.1111/mice.12662
[33] Robertson, P.K. (2016). Cone penetration test (CPT)-based soil behaviour type (SBT) classification system—an update. Canadian Geotechnical Journal, 53(12): 1910-1927.
[34] Jorat, M.E., Kreiter, S., Mörz, T., Moon, V., de Lange, W. (2014). Utilizing cone penetration tests for landslide evaluation. In Submarine Mass Movements and Their Consequences: 6th International Symposium, pp. 55-71. https://doi.org/10.1007/978-3-319-00972-8_6
[35] Bowles, J.E. (1981). Physical and Geotechnical Properties of Soils. New York: McGraw-Hill Book Company.
[36] Bishop, A.W. (1955). The use of the slip circle in the stability analysis of slopes. Geotechnique, 5(1): 7-17. https://doi.org/10.1680/geot.1955.5.1.7
[37] Dahale, P.P., Nalgire, T., Mehta, A.A., Hiwase, P.D. (2020). Slope stability analysis by GeoSlope. Helix, 10(1): 71-75. https://doi.org/10.29042/2020-10-1-71-75
[38] Troncone, A., Pugliese, L., Parise, A., Conte, E. (2023). Analysis of a landslide in sensitive clays using the material point method. Geotechnical Research, 10(2): 67-77. https://doi.org/10.1680/jgere.22.00060
[39] Harabinová, S., Kotrasová, K., Kormaníková, E., Hegedüsová, I. (2021). Analysis of slope stability. Civil and Environmental Engineering Journal, 17(1): 192-199. https://doi.org/10.2478/cee-2021-0020
[40] Reale, C., Gavin, K., Librić, L., Jurić-Kaćunić, D. (2018). Automatic classification of fine-grained soils using CPT measurements and artificial neural networks. Advanced Engineering Informatics, 36: 207-215. https://doi.org/10.1016/j.aei.2018.04.003
[41] Jaksa, M.B., Kaggwa, W.S., Brooker, P.I. (2000). An Improved Technique for Evaluating the CPT Friction Ratio. Department of Civil and Environmental Engineering, University of Adelaide.
[42] Agung, P.A.M., Pramusandi, S., Pradiptiya, A., Adinegara, A.W., Idris, M., Sultan, R., Hasan, M.F.R., Zainorabidin, A. (2025). Expansive residual soil stability behavior during wetting and drying process. International Journal of Safety and Security Engineering, 15(1): 127-139. https://doi.org/10.18280/ijsse.150114
[43] Lunne, T., Peter, K.R., John, P.J.M. (1997). Cone Penetration Testing in Geotechnical Practice (1st ed.). London: CRC Press.
[44] Hasan, M.F.R., Frastika, M.Y., Agung, P.A.M., Susilo, A., Suryo, E.A., Zaika, Y., Juwono, A.M., Zulaikah, S. (2024). Influence of rock weathering and saturation on compressive strength and slope stability: A uniaxial test analysis. International Journal of Safety and Security Engineering, 14(1): 145-153. https://doi.org/10.18280/ijsse.140114
[45] Roy, S., Bhalla, S.K. (2017). Role of geotechnical properties of soil on civil engineering structures. Resources and Environment, 7(4): 103-109. https://doi.org/10.5923/j.re.20170704.03
[46] Mahmoud, M., Woeller, D., Robertson, P.K. (2000). Detection of shear zones in a natural clay slope using the cone penetration test and continuous dynamic sampling. Canadian Geotechnical Journal, 37(3): 652-661. https://doi.org/10.1139/t99-129