Mohammed Chaman*![]() | Anas El Maliki
| Anas El Maliki![]() | Hamza El Yanboiy
| Hamza El Yanboiy![]() | Hamad Dahou
| Hamad Dahou![]() | Abdelkader Hadjoudja
| Abdelkader Hadjoudja![]()
© 2025 The authors. This article is published by IIETA and is licensed under the CC BY 4.0 license (http://creativecommons.org/licenses/by/4.0/).
OPEN ACCESS
Driver Monitoring Systems (DMS) have become a cornerstone of Advanced Driver Assistance Systems (ADAS), aiming to reduce accidents caused by distraction, drowsiness, and unsafe driving behaviors. Traditional monitoring approaches, often reliant on indirect vehicle signals, have proven insufficient for real-time accuracy. With the advancement of deep learning and computer vision, vision-based systems now provide direct and reliable monitoring of driver states. This paper proposes a YOLOv12-based DMS designed for real-time, multi-class driver behavior recognition, addressing critical challenges such as low latency, false positives, and robustness under diverse environmental conditions. A custom dataset of 17,000 annotated images across four categories—Safe Driving, Distracted, Drowsy, and Smartphone Usage—was employed for training and evaluation. The proposed model achieved a precision of 95.0%, a recall of 92.5%, an F1-score of 93.7%, mAP@0.5 of 96.0%, and mAP@0.5:0.95 of 75.0%, outperforming prior YOLO versions under identical experimental conditions. These results demonstrate the superior accuracy, efficiency, and generalization capacity of YOLOv12 in handling complex visual cues, including partial occlusions and variable lighting. The system’s strong performance underscores its potential as a reliable, real-time driver monitoring solution within ADAS, enabling proactive safety interventions and contributing significantly to the reduction of human-error-induced accidents on roads.
Driver Monitoring System, deep learning, YOLOv12, ADAS, object detection, road safety, real-time ADAS monitoring, drowsiness detection
In recent decades, rapid technological advancements have transformed the automotive industry, leading to significant improvements in vehicle safety, performance, and driver comfort. At the core of this transformation are Advanced Driver Assistance Systems (ADAS), which incorporate technologies such as adaptive cruise control, lane departure warning, blind-spot detection, and automatic emergency braking to reduce accident rates and enhance driving safety [1]. Despite these advances, human error remains the leading cause of road accidents worldwide. The World Health Organization (WHO) estimates that more than 90% of traffic accidents are associated with human factors such as distraction, drowsiness, and impaired attention [2]. Continuous monitoring of the driver’s state is therefore essential to maximize ADAS effectiveness and mitigate human-related risks on the road.
Driver Monitoring Systems (DMS) have become key components of modern vehicle safety frameworks, focusing on assessing driver behavior to detect distraction, fatigue, or other risky actions. Early implementations relied on indirect measures such as steering behavior, lane deviation, or braking patterns [3], which lacked sufficient accuracy for real-time intervention. More recent innovations employ vision-based methods that use cameras and image analysis to directly monitor facial expressions, eye movement, head pose, and other behavioral cues [4].
The emergence of deep learning, particularly Convolutional Neural Networks (CNNs), has revolutionized vision-based DMS by enabling the detection of subtle patterns indicative of drowsiness, distraction, or smartphone usage. Within this domain, the You Only Look Once (YOLO) family of object detection algorithms stands out due to its ability to deliver high accuracy with real-time inference and relatively low computational cost [5, 6].
Murali et al. [7] developed a real-time drowsiness detection system using YOLO, where fatigue symptoms such as prolonged eye closure and increased blink frequency were identified with high reliability and minimal false positives. Zia et al. [8] compared YOLOv5 against Faster R-CNN and RetinaNet, reporting YOLOv5 as the best-performing model, achieving 93.6% mAP@IoU50 and 125 FPS across diverse driver behaviors including yawning, smoking, and smartphone use. Sai and Vekkot [9] examined multiple CNN architectures, with InceptionV3 reaching 98% accuracy and MobileNet 97%, demonstrating CNNs’ ability to process complex temporal data effectively. Similarly, Srinithi et al. [10] proposed a non-intrusive CNN-based Eye Aspect Ratio (EAR) method validated on public datasets, which confirmed robustness across varied conditions. Yang et al. [11] integrated YOLOv7-tiny with 6DRepNet to capture facial and head-pose cues, achieving real-time driver compliance monitoring. Salakapuri et al. [12] further expanded this paradigm by fusing driver-focused and road-focused perception, creating a context-aware ADAS framework. Addressing computational efficiency, Essel et al. [13] optimized YOLOv8 with FPGA-based quantization, sustaining high detection accuracy (mAP@0.5 = 0.89) while reducing power consumption to 9.34 W.
The YOLO family has continually evolved, with each version introducing innovations that directly benefit ADAS. YOLOv4 improved multi-scale feature aggregation with Spatial Pyramid Pooling (SPP), enhancing detection in complex environments [14]. YOLOv5 emphasized scalable architectures, achieving ~87% mAP for road marking recognition [15]. YOLOv7 and YOLOv8 introduced anchor-free, decoupled detection heads, improving sensitivity to small and fine-grained objects. YOLOv9 integrated the GELAN backbone and Programmable Gradient Information (PGI), strengthening gradient propagation and reducing information loss in lightweight deployments. YOLOv10 advanced end-to-end training with NMS-free dual assignment, producing stable inference times and achieving 99.4% mAP@50 on traffic sign detection [16]. YOLOv11 refined backbone and neck design, delivering 98% precision and 99.3% mAP@50 [17]. Building on these, YOLOv12 integrates attention-centric feature selection and efficient multi-scale fusion, further improving detection of subtle and partially occluded cues critical in DMS tasks.
Comparative studies also highlight YOLO’s advantages relative to other frameworks. While Faster R-CNN achieves strong accuracy, its inference latency (e.g., 89% accuracy in a distraction detection study) limits real-time applicability [18]. Lightweight models such as MobileNet reduce computational costs but often sacrifice robustness in complex environments [9]. Hybrid strategies like ShuffleNet with metaheuristic optimization improved efficiency and accuracy (97.05% in drowsiness detection [19]) but still underperform YOLO models in balancing speed and precision. Overall, YOLOv5 through YOLOv11 consistently demonstrate superior trade-offs, making them highly suitable for in-vehicle applications where both reliability and low latency are critical [20].
Further evidence supports YOLO’s role in safety-critical ADAS. A recent survey of pedestrian detection noted YOLO’s competitiveness but identified challenges in illumination and occlusion [21]. In driver monitoring, YOLOv8n with transfer learning surpassed 98% accuracy for fatigue detection in sunglasses-wearing drivers [22], while an enhanced YOLOv7 with CBAM and Focal-EIoU achieved ~99% mAP in eye-state recognition [23].
Building on this trajectory, YOLOv12 represents the most advanced iteration, combining refined attention mechanisms with bidirectional multi-scale fusion to enhance classification and localization robustness under real-world conditions such as low light, partial occlusion, and rapid driver movements. The motivation for employing YOLOv12 in this study lies in addressing persistent DMS challenges: ensuring low-latency inference, minimizing false positives, and maintaining consistent detection accuracy across diverse scenarios, including varying illumination, facial occlusions, and demographic diversity. The proposed YOLOv12-based approach leverages advanced training strategies, optimized inference pipelines, and hardware-aware quantization to overcome these limitations.
Accordingly, this research integrates YOLOv12 within an ADAS-compatible DMS framework to achieve real-time detection of critical driver behaviors such as fatigue, distraction, and smartphone use. Comprehensive validation on diverse datasets will demonstrate its reliability and practicality. By uniting YOLOv12’s superior detection capabilities with efficient deployment strategies, this work seeks to advance automotive safety and support the development of smarter, safer driving environments.
The paper is structured as follows. Section 2 presents the proposed methodology, including details of the YOLOv12 architecture, dataset preparation, training procedure, and the evaluation metrics employed. Section 3 describes the experimental results, providing a comparative analysis of successive YOLO models and examining the trade-offs between accuracy, inference speed, and computational efficiency. Finally, Section 4 concludes the study by highlighting the main contributions and outlining potential future research directions in driver monitoring and ADAS-oriented applications.
This section presents the methodological approach for a real-time DMS built on YOLOv12. The pipeline leverages advances in object detection and behavior recognition within ADAS and is organized around four stages: model architecture, dataset preparation, training/optimization, and evaluation. We first outline the YOLOv12 framework and its modules, then describe the curated dataset and augmentations, followed by the training environment and hyperparameters, and finally the metrics used to quantify performance.
2.1 YOLOv12-based deep learning framework
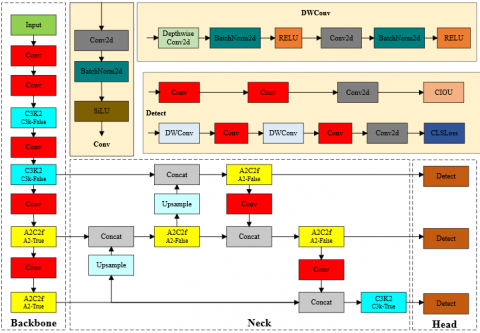
The YOLOv12 algorithm represents the latest advance in the evolution of the YOLO family, introducing significant architectural improvements that respond to the increasing demand for real-time, high-accuracy detection. Unlike its predecessors, YOLOv12 augments the conventional convolutional backbone with attention mechanisms that enhance feature selectivity and detection precision. It also extends unified support for multiple vision tasks, including classification, object detection, and instance segmentation [24, 25]. As shown in Figure 1, the network retains the classical three-stage structure of backbone, neck, and head, but incorporates attention-based modules to strengthen contextual reasoning while maintaining low latency.
Figure 1. The structure diagram of YOLOv12
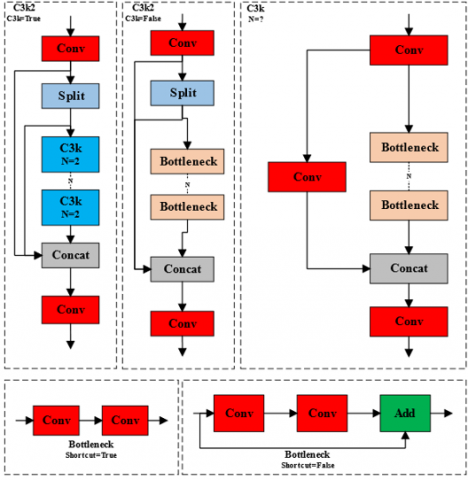
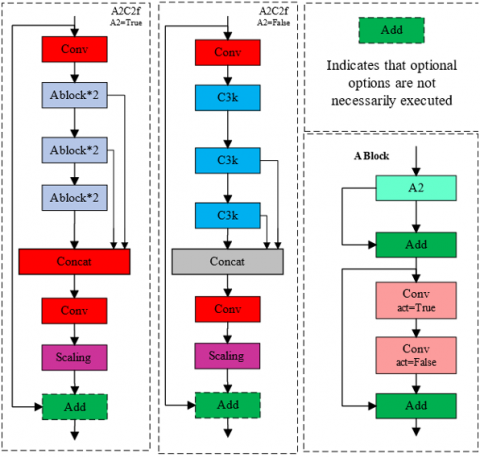
The backbone is designed to extract rich and discriminative features from input images through Conv2D + BatchNorm + SiLU layers combined with the C3K2 and A2C2f modules. The C3K2 block, inherited from YOLOv11, integrates a Residual Efficient Layer Aggregation Network (R-ELAN) that improves gradient flow and feature reuse while keeping the parameter count low, as illustrated in Figure 2. In parallel, the A2C2f module, shown in Figure 3, applies an area-aware channel–spatial attention mechanism by dividing the feature map into subregions, processing each region independently, and then reconstructing the full feature map. This design refines spatial focus with negligible computational overhead, thereby enhancing the detection of small or partially occluded objects [26, 27].
Figure 2. C3K2 module structure diagram
Figure 3. A2C2f module structure diagram
The neck aggregates multi-scale information bidirectionally and passes it to the detection head, which produces bounding boxes, class scores, and objectness predictions. By improving gradient stability across scales, this structure enhances the recognition of fine-grained features such as eyelid closure or subtle head movements, which are crucial for driver monitoring tasks. To further assess efficiency, Figure 4 compares mean Average Precision (mAP) against latency and FLOPs for YOLOv12 and several leading detectors, including YOLOv6, YOLOv7, YOLOv8, YOLOv10, YOLOv11, RT-DETR, and RT-DETRv2. The red curve representing YOLOv12 consistently dominates in both plots. YOLOv12n and YOLOv12s outperform comparable lightweight models in the latency graph, while all YOLOv12 variants achieve higher accuracy at low-to-mid FLOPs. These results confirm YOLOv12 as one of the most balanced models in terms of accuracy-to-efficiency trade-offs, making it well-suited for applications operating under constrained computational budgets [28].

Figure 4. Comparative performance of YOLOv12 and other models on MS COCO
2.2 Dataset and resources for training
The YOLOv12 deep learning model in this study was trained on a comprehensive dataset specifically constructed to ensure robustness and generalization in driver monitoring applications. The final dataset consists of 17,000 annotated images distributed across four driver behavior categories: Safe Driving, Distracted, Drowsy, and Smartphone Usage. Each image was annotated with bounding boxes capturing cues such as facial orientation, eye status, head tilt, and hand position, enabling precise recognition of driver states in real time.
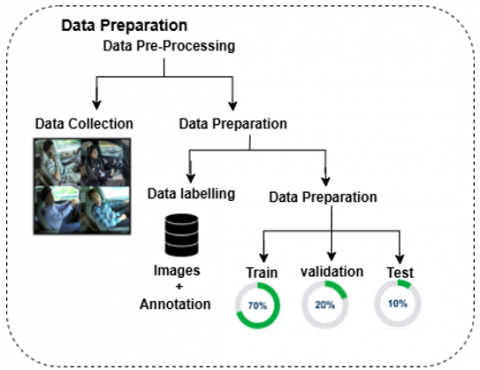
Unlike many publicly available datasets that are restricted to fixed lighting and camera conditions, this dataset was designed to reflect the diversity of real-world driving scenarios. It incorporates variations in illumination (day, evening, night), multiple camera viewpoints, and a wide range of driver demographics, body types, and facial accessories (e.g., glasses, masks). Figure 5 illustrates the dataset preparation workflow, covering raw image collection, annotation, augmentation, and the final split into training, validation, and testing subsets.
Figure 5. Dataset preparation workflow
To achieve this diversity, five public driver monitoring datasets were combined with additional captured images. After cleaning and harmonization, the dataset totaled 17,000 samples. Augmentation techniques—including horizontal flipping, random rotation, noise injection, exposure adjustment, and saturation correction—were applied to increase variability and reduce overfitting. The dataset was divided into 70% training, 20% validation, and 10% testing, using stratified sampling to preserve class balance. Table 1 summarizes the image distribution per class.
Table 1. Dataset distribution
|
Classes |
Number of Images |
Image |
|
Safe Driving |
5346 |
|
|
Distracted |
3309 |
|
|
Drowsy |
5473 |
|
|
Smartphone |
2872 |
|
During training, the YOLOv12 network minimizes a composite loss function that simultaneously optimizes localization, classification, and objectness estimation:
$L_{ {YOLOv } 12}=\lambda_{ {box }} \mathcal{L}_{ {box }}+\lambda_{ {cls }} \mathcal{L}_{c l s}+\lambda_{ {obj }} \mathcal{L}_{ {obj }}$ (1)
This overall objective allows developers to control the relative importance of spatial accuracy, correct class identification, and confidence calibration by tuning the weight $\lambda_{b o x}, \lambda_{c l s}, \lambda_{o b j}$.
The bounding-box $\mathcal{L}_{{box}}$ loss evaluates how accurately the model predicts the location and dimensions of detected objects. It uses Mean Squared Error (MSE) between the predicted and true bounding box parameters:
$\mathcal{L}_{ {box }}=\frac{1}{N} \sum_{i=1}^N\left[\begin{array}{l}\left(x_i-x_i^{ {true}}\right)^2+\left(y_i-y_i^{ {true}}\right)^2 +\left(w_i-w_i^{{true}}\right)^2+\left(h_i-h_i^{{true}}\right)^2\end{array}\right]$ (2)
Here, represents the number of predicted bounding boxes, while $(x_i, y_i, w_i, h_i)$ and $(x_i^{{true}}, y_i^{{true }}, w_i^{ {true}}, h_i^{{true}})$ are the predicted and ground truth box coordinates, respectively. This term ensures the predicted boxes align closely with actual object locations.
The classification loss $\mathcal{L}_{c l s}$ measures how accurately the model classifies detected objects. It applies the cross-entropy loss between predicted class probabilities c and the true one-hot encoded labels $y_{i c}$:
$\mathcal{L}_{c l s}=-\frac{1}{N} \sum_{i=1}^N \sum_{c=1}^C y_{i c} log \hat{p}_{i c}$ (3)
where, $C$ is the total number of classes (e.g., ten for speed limits), and $y_{i c}=1$ if the $i$-th box corresponds to class $c$, and $\hat{p}_{i c}$ is the predicted probability. This loss encourages the network to assign high probability to the correct class.
The objectness loss determines whether a predicted box truly contains an object or is background. It uses Binary Cross Entropy (BCE):
$\mathcal{L}_{o b j}=-\frac{1}{N} \sum_{i=1}^N\left[y_i^{o b j} log \hat{p}_i^{o b j}+\left(1-y_i^{o b j}\right) log \left(1-\hat{p}_i^{o b j}\right)\right]$ (4)
where, $y_i{ }^{o b j}$ is 1 if a real object is present in the i-th anchor, and 0 otherwise. This loss penalizes both false positives (detecting something when nothing is there) and false negatives.
|
Algorithm 1: Training Procedure for YOLOv12 on DMS Dataset |
|
Require: - Custom DMS dataset (17,000 annotated images) with four classes: SafeDriving, Drowsiness, Distracted, and Smartphone Ensure:
For epoch = 1 to E do For each batch in the training set do Load batch images and YOLO-format labels (four-class annotation) Apply data augmentation (horizontal flipping, random rotation, noise injection, exposure correction, and saturation adjustment) Perform a forward pass through YOLOv12 model Compute total loss: L_total = λ_box × L_box + λ_cls × L_cls + λ_obj × L_obj Update model parameters via backpropagation and SGD optimizer End for Evaluate Precision, Recall, F1-score, mAP@0.5, and mAP@0.5:0.95 on validation set for each class If validation mAP improves → Save current best model weights If no improvement for N consecutive epochs → Reduce α by a factor of 0.1 End for Return: trained YOLOv12 model optimized for four driver state classification |
Together, these three components form the backbone of YOLOv12's training objective. Eq. (1) brings them together into a unified function that enables the model to learn how to localize DMS classes accurately, classify them correctly, and filter out background noise. By fine-tuning the balance among these loss terms, the model achieves robust detection even in challenging scenarios with lighting variation, motion blur, or occlusion.
At inference, each image is resized to 640 × 640 pixels and normalized. Features are extracted via the R-ELAN backbone, aggregated using an attention-enhanced PANet, and passed to the detection head for bounding box prediction, classification, and confidence scoring. To eliminate redundancy, Non-Maximum Suppression (NMS) with an IoU threshold of 0.5 is applied.
The training procedure, summarized in Algorithm 1, was designed to maximize efficiency, prevent overfitting, and retain only the most performant checkpoints through validation monitoring and early stopping.
2.3 Comprehensive data preparation and training environment specifications
The dataset used in this study comprises 17,000 manually annotated images, each categorized into one of four driver state classes: SafeDriving, Drowsiness, Distracted, and Smartphone. Annotations were performed using the Roboflow platform and exported in YOLO-compatible TXT format, ensuring seamless integration into the training pipeline. All images were uniformly resized to 640 × 640 pixels to balance visual clarity with computational efficiency.
To improve the robustness and diversity of the training dataset, several data augmentation techniques were applied, including horizontal flipping, random rotation, noise injection, exposure correction, and saturation adjustment [29, 30]. These augmentations increase the variability of training samples, thereby reducing overfitting and enhancing the model’s ability to generalize across diverse conditions. In particular, saturation levels were adjusted within a range of −25% to +25% to simulate various lighting and color scenarios, from muted tones to high contrast environments. This transformation can be expressed as:
$I^{\prime}=adjust\_saturation (I, \alpha), \alpha[-0.25,0.25]$ (5)
Here, I denotes the original image, while I′ represents the resulting image after saturation adjustment. To enhance robustness, noise augmentation was applied by introducing small random pixel-level perturbations, mimicking real-world imperfections such as sensor noise or compression artifacts. This process effectively simulates unpredictable visual distortions that may arise in real-time environments. The augmentation is mathematically expressed as:
$I^{\prime}=I+N$ (6)
Here, N represents the noise component added to the image, which alters up to 0.1% of the total pixels, thereby introducing slight variability without distorting the overall visual integrity of the image.
To simulate diverse lighting conditions, exposure adjustment was applied by uniformly modifying the brightness of each image by approximately 10%. This transformation is mathematically defined as:
$I^{\prime}={clip}(I+\beta \times I, 0.255), \beta \approx 0.1$ (7)
where, I is the original image, β is the brightness scaling factor, and I′ is the adjusted image. This technique enhances the model's robustness to illumination variability, improving its ability to generalize under challenging scenarios such as nighttime, glare, or overexposed environments.
To simulate variations caused by camera tilt or slight perspective shifts, random rotations were applied to the images within a range of −15° to +15°. This transformation is expressed as:
$I^{\prime}=$ rotate $(I, \theta), \theta\left[-15^{\circ}, 15^{\circ}\right]$ (8)
where, I is the original image, θ is the rotation angle, and I′ is the rotated output. Corresponding bounding boxes were recalculated dynamically to maintain accurate object localization post-transformation. The rotation operation was governed by the 2D rotation matrix:
$R(\theta)=\left[\begin{array}{cc}\cos (\theta) & -\sin (\theta) \\ \sin (\theta) & \cos (\theta)\end{array}\right]$ (9)
This adjustment is particularly relevant in scenarios involving rotating or mobile cameras, ensuring that the model remains effective under various orientations.
Additionally, horizontal flipping was employed with a 50% likelihood to replicate mirrored viewpoints, thereby increasing the spatial variability of DMS orientations within the dataset. This augmentation step contributes to a more diverse training set by introducing alternative perspectives. When combined with other augmentation techniques, this strategy not only enriches environmental diversity but also plays a key role in reducing class imbalance by artificially increasing the representation of less frequent traffic categories.
The dataset was then partitioned using stratified sampling into 70% for training, 20% for validation, and 10% for testing, maintaining proportional class distribution across each subset (Figure 5).
The experimental environment consisted of an AMD Ryzen 9 7940HX processor paired with 32 GB of DDR5 RAM, and an NVIDIA GeForce RTX 4070 GPU equipped with 8 GB of dedicated VRAM. All components operated under the Windows 11 operating system. Model development and training were carried out using Python 3.12.4 and PyTorch 2.5.1, with GPU acceleration supported by CUDA version 11.8 to enhance computational efficiency.
For optimal performance, the YOLOv12 model was trained over 200 epochs with a batch size of 16, utilizing input images resized to 640 × 640 pixels. The training process employed the Stochastic Gradient Descent (SGD) optimizer, configured with a momentum of 0.937, a weight decay of 0.0005, and a learning rate of 0.01. These hyperparameters were carefully selected to strike a balance between training speed and model accuracy, enabling effective real-time object detection in driver monitoring scenarios.
To address the computational demands of real-time DMS in ADAS, the training and optimization of the YOLOv12 model were conducted on a high-performance computing platform configured for deep learning applications. The primary goal was to achieve high accuracy, fast convergence, and low inference latency under real-world conditions such as motion blur, occlusion, and varying illumination.
Table 2 summarizes the system specifications and training hyperparameters used during experimentation. The model was trained on a Windows 11 workstation equipped with an AMD Ryzen 9 7940HX processor, 32 GB of DDR5 RAM, and an NVIDIA GeForce RTX 4070 GPU featuring 8 GB of dedicated VRAM. The software stack comprised Python 3.12.4, PyTorch 2.5.1, and CUDA 11.8, ensuring efficient GPU acceleration and stability throughout the training process.
Table 2. System configuration and training hyperparameters for YOLOv12
|
Hardware and Software Environment |
Hyperparameters |
||
|
Name |
Version |
Parameters |
Details |
|
Processor (CPU) |
AMD Ryzen 9 7940HX |
Number of Epochs |
200 |
|
Graphics Card (GPU) |
NVIDIA GeForce RTX4070 |
Batch Size |
16 |
|
GPU Memory (VRAM) |
8 GB |
Image Size (Pixels) |
640 × 640 |
|
System Memory |
32 GB DDR5 |
Optimizer Algorithm |
SGD |
|
Operating System |
Windows 11 |
Momentum |
0.937 |
|
Python Version |
3.12.4 |
Weight Decay |
0.0005 |
|
PyTorch Version |
2.5.1 |
Initial Learning Rate |
0.01 |
|
CUDA Version |
11.8 |
Final Learning Rate |
0.01 |
The training lasted for 200 epochs, with a batch size of 16, using input images resized to 640 × 640 pixels to balance feature resolution and memory constraints. The optimization algorithm employed was SGD, configured with a momentum of 0.937, a weight decay of 0.0005, and a fixed learning rate of 0.01. These hyperparameters were empirically chosen to optimize convergence while avoiding overfitting, a common challenge in behavioral detection tasks with limited annotated data.
2.4 Evaluation metrics for detection performance
To rigorously assess the effectiveness of the proposed driver monitoring detection system, standard object detection metrics were utilized, namely Precision, Recall, Average Precision (AP), mean Average Precision (mAP), and the F1-score. Collectively, these metrics provide a comprehensive evaluation of the model’s capability to localize and classify objects accurately across multiple categories while reducing erroneous detections. They are especially critical for evaluating accuracy and reliability under real-time constraints, as highlighted in recent studies [31, 32].
Precision measures the proportion of correctly identified positive detections among all predicted positives, reflecting the model’s robustness against false positives. Recall evaluates the proportion of true positives among all actual positives, thereby indicating the model’s effectiveness in capturing relevant instances.
AP corresponds to the area under the precision–recall curve for a single class, summarizing the trade-off between precision and recall across varying thresholds. mAP generalizes this measure by averaging AP values across all object classes, offering an overall indicator of detection performance. The F1-score, defined as the harmonic mean of precision and recall, provides a balanced evaluation when both false positives and false negatives must be minimized [33, 34].
The mathematical definitions of these metrics are expressed as follows, where TP denotes true positives, FP false positives, and FN false negatives:
$Precision=\frac{T P}{T P+F P} \times 100 \%$ (10)
$Recall=\frac{T P}{T P+F N} \times 100 \%$ (11)
$A P=\int_0^1 P(R) d R$ (12)
$m A P=\frac{1}{C} \sum_{j=1}^c(A P) j$ (13)
$F 1- score =2 \times \frac{ {Precision} { × } { Recall }}{ { Precision}+ { Recall}}$ (14)
The experimental evaluation demonstrated the robust and consistent performance of the YOLOv12 model in detecting driver states across the four target classes—Safe Driving, Distracted, Drowsy, and Smartphone Usage. The model achieved high accuracy across all evaluation metrics. As reported in Table 3, YOLOv12 reached a precision of 95%, a recall of 92%, and an F1-score of 93.5%, reflecting a well-balanced trade-off between precision and recall. Furthermore, the model attained a mAP@0.5 of 96% and a stricter mAP@0.5–0.95 of 73.5%, underscoring its strong detection capability across varying IoU thresholds. These results confirm the reliability of YOLOv12 for accurate and real-time driver state recognition in diverse scenarios.
Table 3. Performance evaluation of the YOLOv12 model for driver state detection
|
Model |
Precision |
Recall |
F1-Score |
mAP@50 |
mAP@50-95 |
|
YOLOv12 |
95% |
92% |
93.5% |
96% |
73.5% |

Figure 6. YOLOv12 training and validation metrics over 200 epochs
The training dynamics illustrated in Figure 6 demonstrate clear convergence behavior, characterized by consistent reductions in box, classification, and distribution focal losses across both training and validation phases. The train/box_loss and val/box_loss steadily decreased to values below 0.6 and 0.5, respectively, indicating progressive improvements in bounding box localization accuracy. Similarly, the classification loss curves showed a steep decline within the first 50 epochs, highlighting rapid learning of class-specific features, while the distribution focal loss decreased smoothly, confirming enhanced bounding box regression precision. From a performance perspective, precision exceeded 0.90 within the first 20 epochs and remained stable throughout training, whereas recall plateaued around 0.92, confirming the model’s robustness in detecting true positives under diverse conditions. Likewise, both mAP@0.5 and mAP@0.5–0.95 curves displayed an upward trajectory with early stabilization, underscoring the efficiency of the training process and the model’s strong capacity to generalize across variations in driver behavior.
The Precision-Recall (PR) curves in Figure 7 demonstrate the YOLOv12 model’s strong discriminative ability across the four driver behavior categories: Drowsiness, Safe Driving, Distracted, and Smartphone Usage. Drowsiness (AP = 0.995) and Safe Driving (AP = 0.988) achieved near-perfect scores, while Distracted (AP = 0.946) and Smartphone Usage (AP = 0.910) also performed well despite higher intra-class variability. These results highlight the model’s robustness in recognizing complex visual cues, including partial occlusions and subtle facial expressions. The F1-confidence curve in Figure 8 further revealed that the optimal operating threshold lies around 0.401, where Drowsiness and Safe Driving exceeded F1-scores of 0.97, and Distracted and Smartphone Usage reached 0.85 and 0.92, respectively. However, a sharp decline beyond 0.8 confidence indicates the importance of careful threshold calibration to balance precision and recall in real-time ADAS deployments.

Figure 7. PR curves for YOLOv12

Figure 8. F1-confidence curves for YOLOv12
The F1-confidence curve in Figure 8 illustrates how YOLOv12’s detection performance changes with varying confidence thresholds across the four driver state categories. The model maintains consistently high F1-scores over a wide range, reaching a peak overall score of 0.93 at a threshold of 0.401 when aggregating results across all classes. At the class level, Drowsiness (≈ 0.99) and Safe Driving (≈ 0.97) achieved near-optimal performance across most thresholds, confirming the model’s ability to detect these states with exceptional reliability by sustaining both high precision and recall. In contrast, Distracted (≈ 0.85) and Smartphone Usage (≈ 0.92) achieved slightly lower F1-scores, reflecting moderate class confusion—An observation consistent with the misclassification patterns seen in the confusion matrix. A sharp performance drop beyond the 0.8 confidence threshold underscores the trade-off between prediction certainty and coverage: higher thresholds reduce false positives but at the cost of missing true detections. Overall, thresholds between 0.4 and 0.5 provide the best balance, ensuring robust and dependable detection for real-time ADAS applications, where timely recognition of unsafe driver states is critical for safety interventions.

Figure 9. Normalized confusion matrix

Figure 10. Qualitative detection results of YOLOv12 for driver state recognition in real-world scenarios
The confusion matrix in Figure 9 highlights the YOLOv12 model’s classification performance across five classes: Distracted, Drowsiness, Safe Driving, Smartphone, and Background. The diagonal entries indicate correctly classified instances, while off-diagonal values capture misclassifications. Results show that Drowsiness achieved perfect recognition (1.00), demonstrating the model’s strong ability to identify this state. Safe Driving (0.97) and Smartphone (0.92) also reached high accuracies, confirming reliable detection in these categories. By contrast, Distracted driving scored lower (0.80), with substantial confusion toward the Background class (0.42), suggesting that non-driver visual elements occasionally mimic distracted cues. Safe Driving also exhibited minor overlaps with Distracted (0.19) and Background (0.18). Overall, the strong diagonal dominance reflects robust discriminative capacity, though the observed misclassifications highlight the need for targeted data augmentation and class-specific feature refinements, particularly to better separate Distracted and Background classes.
The qualitative detection results presented in Figure 10 highlight the YOLOv12 model’s effectiveness in real-time identification of diverse driver states—Smartphone Usage, Distracted Driving, Drowsiness, and Safe Driving—across varying lighting conditions, poses, and contextual settings. The model consistently detects and classifies driver behaviors with high confidence scores, frequently exceeding 0.80, even in challenging scenarios involving head tilts, partial occlusions, or varied facial orientations.
For instance, Smartphone Usage is reliably recognized in both handheld and calling postures, with confidence scores of 0.91 and 0.76, respectively. Distracted Driving is also robustly detected across multiple contexts, achieving confidence values between 0.69 and 0.89, which demonstrates the model’s resilience to subtle variations in gaze direction and head position. The Drowsiness class stands out with very high detection certainty (0.97 and 0.98), even when eyes are partially or fully closed, confirming the model’s sensitivity to fatigue-related visual cues. Safe Driving is correctly classified with a confidence score of 0.84 when the driver maintains forward attention, underscoring the model’s ability to differentiate normal posture from unsafe behaviors. Notably, the bounding boxes are tightly fitted, reflecting precise spatial localization of the driver’s head and upper body—an essential factor for minimizing false positives in ADAS.
These qualitative outcomes strongly support the quantitative findings, demonstrating YOLOv12’s capacity to deliver accurate, high-confidence detections across a wide range of driver states. This robustness under real-world variability emphasizes its potential for deployment in embedded, real-time DMS, where safety-critical decisions require consistent and reliable behavioral recognition.
A rigorous comparative analysis was performed to evaluate the performance of YOLOv10, YOLOv11, and YOLOv12 within a unified experimental framework, ensuring both fairness and reproducibility. All models were trained and tested on the same driver monitoring dataset, employing identical data augmentation techniques and consistent hyperparameter settings to isolate the impact of architectural improvements. As illustrated in Figure 11, YOLOv12 achieved the best results across all evaluation metrics, recording a precision of 95.0%, recall of 92.5%, F1-score of 93.7%, mAP@50 of 96.0%, and mAP@50–95 of 75.0%. By comparison, YOLOv11 showed slightly lower values in each metric, while YOLOv10 delivered the weakest performance, particularly for mAP@50–95, highlighting its reduced adaptability to multi-scale object detection.
These findings confirm YOLOv12’s superior ability to provide accurate, consistent, and robust driver state recognition, a capability essential for real-time ADAS applications. The integration of advanced modules such as R-ELAN and BiFPN proved instrumental in enhancing multi-scale feature aggregation and attention-guided detection, allowing the model to sustain high performance even under challenging conditions, including occlusion, low illumination, and motion blur. Furthermore, the visual presentation in Figure 11, which includes value labels above each bar and a repositioned legend, clearly demonstrates YOLOv12’s advantages both quantitatively and visually.

Figure 11. Performance comparison of YOLO models for ADAS driver monitoring
A comprehensive evaluation of the proposed YOLOv12-based DMS demonstrates its clear superiority in real-time multi-class driver state detection. When trained and tested under identical datasets, augmentation strategies, and experimental configurations, YOLOv12 consistently outperformed the preceding models. As shown in Table 3 and Figure 11, it achieved the highest precision, recall, F1-score, and mAP values, confirming both its accuracy and robustness. These improvements are largely attributable to the integration of optimized R-ELAN and BiFPN modules, which strengthen multi-scale feature representation and enhance attention-guided detection, ultimately enabling superior performance under diverse and challenging conditions.
The PR curves (Figure 7) further validated the model’s strong discriminative capacity across all driver behavior categories. Average Precision values were nearly perfect for Drowsiness (0.995) and Safe Driving (0.988), while Distracted (0.946) and Smartphone Usage (0.910) also achieved high accuracy despite greater intra-class variability. The F1-confidence curve (Figure 8) indicated an optimal threshold of 0.401, where Drowsiness and Safe Driving exceeded F1-scores of 0.97, and Distracted and Smartphone Usage achieved 0.85 and 0.92, respectively. Performance declined sharply beyond 0.8, underscoring the need for careful calibration in deployment.
The confusion matrix provided additional validation, showing perfect classification for Drowsiness and very high accuracy for Safe Driving and Smartphone Usage. Misclassifications were mainly between Distracted and Background, suggesting the need for targeted data augmentation to improve separability. Qualitative results reinforced these findings, with YOLOv12 demonstrating reliable detections under glare, low-light, and occlusion, consistently producing confidence scores above 0.80.
Importantly, YOLOv12’s efficiency and low-latency inference make it highly suitable for embedded deployment. When integrated with a compact hardware platform and camera module, the system can continuously monitor driver states in real time. Moreover, linking classification outputs to a buzzer or vibration motor enables immediate safety interventions, for example, triggering alerts during distraction or drowsiness while maintaining silence in safe states.
Overall, these results establish YOLOv12 as a state-of-the-art solution for embedded driver monitoring, offering a strong balance of accuracy, robustness, and deployability that is critical for next-generation ADAS applications.
This study demonstrated that the YOLOv12-based DMS delivers superior performance in real-time driver state detection compared to its YOLOv10 and YOLOv11 counterparts, under identical datasets, augmentation strategies, and training configurations. The model achieved a balanced precision of 95%, a recall of 92.5%, and an overall F1-score of 93.7%, with a mAP@0.5 of 96% and mAP@0.5:0.95 of 75%. These results confirm YOLOv12’s ability to reliably distinguish between safe and unsafe driver behaviors across diverse and challenging visual conditions.
The integration of enhanced architectural components, including R-ELAN and BiFPN, was instrumental in strengthening multi-scale feature representation and improving attention-guided detection. Combined with robust augmentation strategies, these improvements enabled the model to maintain strong generalization under variations in illumination, pose, and occlusion. Importantly, the model’s efficiency and low-latency inference highlight its potential for practical integration within ADAS frameworks. Examples of application scenarios include: issuing early warnings in cases of driver distraction or drowsiness, supporting adaptive cruise control by dynamically assessing driver readiness, and serving as a core component in intelligent safety interventions such as lane-keeping assistance and emergency braking. By embedding YOLOv12-based DMS into such systems, vehicles can more proactively mitigate human-error risks and enhance overall road safety.
Despite these promising results, limitations remain. Misclassifications between visually similar categories, such as Distracted and Background, indicate the need for dataset expansion and refined labeling strategies to improve class separability. Furthermore, the dataset used in this study emphasizes particular driving conditions; broader inclusion of diverse cultural and environmental contexts would increase robustness.
Looking ahead, future work will focus on temporal sequence modeling to better capture driver state transitions, multi-modal sensor fusion (e.g., integrating infrared imaging or physiological signals) for more reliable detection under extreme conditions, and optimization for next-generation AI accelerators to sustain real-time performance at scale. These directions will not only strengthen detection accuracy and reduce false alarms but also support deployment in increasingly complex ADAS ecosystems.
Overall, YOLOv12’s proven accuracy, robustness, and computational efficiency position it as a promising foundation for next-generation driver monitoring solutions, capable of advancing the intelligence, responsiveness, and safety of modern vehicles.
This work was supported by the Laboratory of Electronic Systems, Information Processing, Mechanics and Energetics (SETIME), Ibn Tofail University, Kenitra, Morocco. The authors also express their gratitude to the Scientific Publication Support Center of Ibn Tofail University for its financial support, which contributed to covering publication costs and enhancing the dissemination of the study’s findings.
[1] Chengula, T.J., Mwakalonge, J., Comert, G., Sulle, M., Siuhi, S., Osei, E. (2024). Enhancing advanced driver assistance systems through explainable artificial intelligence for driver anomaly detection. Machine Learning with Applications, 17: 100580. https://doi.org/10.1016/j.mlwa.2024.100580
[2] Mofolasayo, A. (2024). Towards ‘Vision-Zero’ in road traffic fatalities: The need for reasonable degrees of automation to complement human efforts in driving operation. Systems, 12(2): 40. https://doi.org/10.3390/systems12020040
[3] Coyne, R., Hanlon, M., Smeaton, A.F., Corcoran, P., Walsh, J.C. (2024). Understanding drivers’ perspectives on the use of driver monitoring systems during automated driving: Findings from a qualitative focus group study. Transportation Research Part F: Traffic Psychology and Behaviour, 105: 321-335. https://doi.org/10.1016/j.trf.2024.07.015
[4] Visconti, P., Rausa, G., Del-Valle-Soto, C., Velázquez, R., Cafagna, D., De Fazio, R. (2025). Innovative driver monitoring systems and on-board-vehicle devices in a smart-road scenario based on the internet of vehicle paradigm: A literature and commercial solutions overview. Sensors, 25(2): 562. https://doi.org/10.3390/s25020562
[5] Kim, D., Park, H., Kim, T., Kim, W., Paik, J. (2023). Real-time driver monitoring system with facial landmark-based eye closure detection and head pose recognition. Scientific Reports, 13(1): 18264. https://doi.org/10.1038/s41598-023-44955-1
[6] Amira, B.G., Zoulikha, M.M., Hector, P. (2021). Driver drowsiness detection and tracking based on YOLO with Haar cascades and ERNN. International Journal of Safety and Security Engineering, 11(1): 35-42. https://doi.org/10.18280/ijsse.110104
[7] Murali, E., Vignesh, C.G., Varma, G.P. (2024). Driver drowsiness detection using YOLO. In 2024 10th International Conference on Advanced Computing and Communication Systems (ICACCS), Coimbatore, India, pp. 1608-1612. https://doi.org/10.1109/ICACCS60874.2024.10717282
[8] Zia, H., Hassan, I.U., Khurram, M., Harris, N., Shah, F., Imran, N. (2025). Advancing road safety: A comprehensive evaluation of object detection models for commercial driver monitoring systems. Future Transportation, 5(1): 2. https://doi.org/10.3390/futuretransp5010002
[9] Sai, R.B., Vekkot, S. (2025). Enhanced driver drowsiness detection using deep learning: Comparative analysis of CNN architectures for video-based monitoring systems. In 2025 4th International Conference on Distributed Computing and Electrical Circuits and Electronics (ICDCECE), Ballari, India, pp. 1-6. https://doi.org/10.1109/ICDCECE65353.2025.11035146
[10] Srinithi, C., Lathaselvi, G., Swetha, A. (2025). An advanced approach for predicting driver drowsiness using CNN and real-time facial detection. In 2025 International Conference on Computational Robotics, Testing and Engineering Evaluation (ICCRTEE), Virudhunagar, India, pp. 1-6. https://doi.org/10.1109/ICCRTEE64519.2025.11052993
[11] Yang, Y.C., Lin, H.Y., Zhao, X.L., Guo, J.I., Fan, C.P. (2025). Deep learning and image-based driver monitoring system design by integrating head pose estimation and behavior analysis. In 2025 IEEE International Conference on Consumer Electronics (ICCE), Las Vegas, NV, USA, pp. 1-3. https://doi.org/10.1109/ICCE63647.2025.10929904
[12] Salakapuri, R., Navuri, N.K., Vobbilineni, T., Ravi, G., Karmakonda, K., Vardhan, K.A. (2025). Integrated deep learning framework for driver distraction detection and real-time road object recognition in Advanced Driver Assistance Systems. Scientific Reports, 15(1): 25125. https://doi.org/10.1038/s41598-025-08475-4
[13] Essel, E., Lacy, F., Belu, R., Areed, N.F.F., Ismail, Y. (2025). Performance optimization of FPGA-accelerated YOLOv8 for driver drowsiness detection using Vivado HLS. International Journal of Computing and Digital Systems, 18(1): 1-15. http://doi.org/10.12785/ijcds/1571130888
[14] Dewi, C., Chen, R.C., Jiang, X., Yu, H. (2022). Deep convolutional neural network for enhancing traffic sign recognition developed on YOLOv4. Multimedia Tools and Applications, 81(26): 37821-37845. https://doi.org/10.1007/s11042-022-12962-5
[15] Dewi, C., Chen, R.C., Zhuang, Y.C., Christanto, H.J. (2022). YOLOv5 series algorithm for road marking sign identification. Big Data and Cognitive Computing, 6(4): 149. https://doi.org/10.3390/bdcc6040149
[16] Chaman, M., Dahou, H., Laâmari, H., Hadjoudja, A., Mouhib, O. (2025). Deep learning-based traffic sign detection and regression using YOLOv10. In Iwendi, C., Boulouard, Z., Kryvinska, N. (eds) Proceedings of the 4th International Conference on Advances in Communication Technology and Computer Engineering (ICACTCE’24), pp. 484-494. Cham: Springer Nature Switzerland. https://doi.org/10.1007/978-3-031-94623-3_42
[17] Chaman, M., El Maliki, A., El Yanboiy, H., Dahou, H., Laâmari, H., Hadjoudja, A. (2025). Traffic sign detection system using YOLOv11 within intelligent transport systems for enhanced ADAS performance with deep learning. In 2025 International Conference on Circuit, Systems and Communication (ICCSC), Fez, Morocco, pp. 1-6. https://doi.org/10.1109/ICCSC66714.2025.11135101
[18] Kshatri, S.S., Rathore, Y.K. (2025). Real-time driver distraction detection using fast R-CNN algorithm. National Academy Science Letters, pp. 1-6. https://doi.org/10.1007/s40009-025-01605-6
[19] Yang, E., Yi, O. (2024). Enhancing road safety: Deep learning-based intelligent driver drowsiness detection for advanced driver-assistance systems. Electronics, 13(4): 708. https://doi.org/10.3390/electronics13040708
[20] Azevedo, P., Santos, V. (2024). Comparative analysis of multiple YOLO-based target detectors and trackers for ADAS in edge devices. Robotics and Autonomous Systems, 171: 104558. https://doi.org/10.1016/j.robot.2023.104558
[21] Sukkar, M., Jadeja, R., Shukla, M., Mahadeva, R. (2025). A survey of deep learning approaches for pedestrian detection in autonomous systems. IEEE Access, 13: 3994-4007. https://doi.org/10.1109/ACCESS.2024.3524501
[22] Tang, X.X., Guo, P.Y. (2024). Fatigue driving detection methods based on drivers wearing sunglasses. IEEE Access, 12: 70946-70962. https://doi.org/10.1109/ACCESS.2024.3394218
[23] Li, X., Li, X., Shen, Z., Qian, G. (2024). Driver fatigue detection based on improved YOLOv7. Journal of Real-Time Image Processing, 21(3): 75. https://doi.org/10.1007/s11554-024-01455-3
[24] Alif, M.A.R., Hussain, M. (2025). YOLOv12: A breakdown of the key architectural features. arXiv preprint, arXiv:2502.14740. https://doi.org/10.48550/arXiv.2502.14740
[25] Khanam, R., Hussain, M. (2025). A review of YOLOv12: Attention-based enhancements vs. previous versions. arXiv preprint, arXiv:2504.11995. https://doi.org/10.48550/arXiv.2504.11995
[26] Jegham, N., Koh, C.Y., Abdelatti, M., Hendawi, A. (2024). YOLO evolution: A comprehensive benchmark and architectural review of YOLOv12, YOLO11, and their previous versions. arXiv preprint arXiv:2411.00201. https://doi.org/10.48550/arXiv.2411.00201
[27] Ji, Y., Ma, T., Shen, H., Feng, H., Zhang, Z., Li, D., He, Y. (2025). Transmission line defect detection algorithm based on improved YOLOv12. Electronics, 14(12): 2432. https://doi.org/10.3390/electronics14122432
[28] Ultralytics. YOLO12. https://docs.ultralytics.com/fr/models/yolo12, accessed on Mar. 2, 2025.
[29] Chaman, M., El Maliki, A., El Yanboiy, H., Dahou, H., Laâmari, H., Hadjoudja, A. (2025). Comparative analysis of deep neural networks YOLOv11 and YOLOv12 for real-time vehicle detection in autonomous vehicles. International Journal of Transport Development and Integration, 9(1): 39-48. https://doi.org/10.18280/ijtdi.090104
[30] Sundaresan Geetha, A., Alif, M.A.R., Hussain, M., Allen, P. (2024). Comparative analysis of YOLOv8 and YOLOv10 in vehicle detection: Performance metrics and model efficacy. Vehicles, 6(3): 1364-1382. https://doi.org/10.3390/vehicles6030065
[31] Chaman, M., El Maliki, A., Dahou, H., El Gouri, R., Laamari, H., Hadjoudja, A. (2025). Deep learning-based speed limit sign detection using YOLOv11 applied to speed regulation in electric vehicles for ADAS. Engineering, Technology & Applied Science Research, 15(4): 25354-25362. https://doi.org/10.48084/etasr.11320
[32] Chaman, M., El Maliki, A., Jariri, N., Dahou, H., Laâmari, H., Hadjoudja, A. (2025). Enhanced deep neural network-based vehicle detection system using YOLOv11 for autonomous vehicles. In 2025 5th International Conference on Innovative Research in Applied Science, Engineering and Technology (IRASET), Fez, Morocco, pp. 1-6. https://doi.org/10.1109/IRASET64571.2025.11008084
[33] Christo, A.A., Utama, M.B.P., Camme, Y.A., Eridani, D., Mountaines, P.E. (2025). YOLO-based helmet detection and intelligent parking system: A case study at Diponegoro University. International Journal of Safety and Security Engineering, 15(5): 1075-1088. https://doi.org/10.18280/ijsse.150520
[34] Chaman, M., El Maliki, A., Jariri, N., El Yanboiy, H., El Mrabet, A., Dahou, H., Laâmari, H., Hadjoudja, A. (2025). Real-time vehicle detection and instance segmentation for ADAS using the YOLOv11-SEG model: A deep learning approach. In 2025 International Conference on Circuit, Systems and Communication (ICCSC), Fez, Morocco, pp. 1-6. https://doi.org/10.1109/ICCSC66714.2025.11135303