Farah Nazar Ibraheem*![]() | Qutaiba Ali
| Qutaiba Ali![]() | Jumana Abdullah Kareem
| Jumana Abdullah Kareem![]()
© 2025 The authors. This article is published by IIETA and is licensed under the CC BY 4.0 license (http://creativecommons.org/licenses/by/4.0/).
OPEN ACCESS
Industrial environments frequently involve serious safety risks such as toxic gas leakage, equipment overheating, and unexpected flame events. Although many IoT-based monitoring solutions have been developed, most of them concentrate on general environmental or weather sensing and do not provide the fast reaction time, scalability, or security measures required for industrial applications. This work presents an IoT-enabled safety monitoring system designed specifically for hazardous industrial settings. The proposed system recommends employing NodeMCU (ESP8266) modules connected to gas, temperature, and flame sensors, and uses cloud services such as ThingSpeak and Blynk to visualize data and deliver mobile alerts. The system design incorporates several security mechanisms, including TLS encryption, API key authentication timestamp verification, and OTA firmware updates, ensuring data integrity and preventing unauthorized access. Experimental results showed that the system can detect hazardous conditions and issue alerts in under two seconds, with an accuracy ranging between 95% and 98%. It also maintained stable cloud logging for 48 hours of continuous operation and achieved low power consumption of approximately 0.12 Wh per node. A comparison with existing IoT-based weather and environmental monitoring systems indicates that the proposed solution offers stronger security, better scalability, and faster alerting, while remaining cost-effective and easy to deploy in industrial environments.
industrial safety monitoring, IoT, real-time alert system, hazard detection, NodeMCU (ESP8266), secure data transmission, TLS encryption, multi-node architecture
In high-risk industrial environments such as chemical plants, power stations, and factories, on-duty workers and machines must contend with hazards such as toxic gas leaks or varying temperatures, open fireplaces (with attendant risks), and sometimes low levels of oxygen compared to what is normal for human beings [1].
Historically, security systems deployed in these hazardous settings often require manual inspection or fixed-wiring solutions with expensive components; in this way, they cannot be extended. However, in the age of Internet of Things (IoT), capable environmental monitoring systems are both affordable and flexible [2].
The emergence of the IoT has provided cost-effective, scalable solutions for environmental monitoring. Equipped with microcontrollers, wireless sensors networked to cloud analytics and mobile apps that lighten workloads when required, these Internet of Things enhanced monitoring devices can follow large and complex systems of complex conditions in real time–sending alerts as they happen [3].
A few research works have investigated IoT technologies and also their application in environmental sciences and weather monitoring, which paves the way for introducing them in safety-critical applications.
In a previous study [1], an IoT-based weather station had been constructed using the ESP8266 module for real-time reporting of the data to the cloud. Likewise, Nageswararao and Murthy [2] introduced an ESP8266 microcontroller-based wireless weather system to sense temperature and humidity with no security aspects and no support for safety-critical settings. A portable weather station centered around PIC microcontrollers and ZigBee were implemented [3], focusing on field mobility but not possessing real-time analysis and mobile compatibility.
Data availability and analysis have been improved with cloud-connected platforms such as ThingSpeak. For example, Baraki et al. [4] used ThingSpeak and MATLAB to gather, store, and analyze current weather information from different places. Munandar et al. [5] designed a mobile-oriented automatic weather station system, and users can check their sensor readings on Android apps. The other system proposed in a previous study [6] was built for smart city applications with Raspberry Pi and several environmental sensors, showing that it is possible to deploy meteorological networks in an urban scenario.
Several prior works have applied IoT to environmental and weather monitoring [1-7], demonstrating the feasibility of distributed sensor networks. However, two main problems still remain unaddressed in current approaches:
This is a very good justification for a resilient IoT-based monitoring system that is safe. It is also suitable for industrial security applications and implies low measurement error.
This paper is an extension of our previous work on secure IoT-based monitoring systems, which can be found in a previous study [8]. We propose to design and develop a more secure and flexible industrial IoT-based prototype that can be readily used in industrial environments. It can do real-time monitoring for safety, obeying the absolute laws of physics-- making all processes safe to begin with-- without according to any idealist agency, and it thereby ensures also the valid theoretical knowledge and methods for production restoration. This work makes some major contributions as follows:
The designed system is aimed to be a safety device against hazardous industrial environments based on IoT technologies. It uses a modular design with several environmental sensors, wireless communication, cloud-based analytics, and mobile notification modules. High-level system architecture is illustrated in Figure 1.
Figure 1. High level system architecture
2.1 Overview of system architecture
The system is based on the NodeMCU (ESP8266) microcontroller, and it communicates with various sensors of safety critical nature. These sensors provide immediate feedback on environmental vascular systems, including gas concentration, temperature, and fire detection. The data is then processed by the NodeMCU and sent through Wi-Fi to the cloud in ThingSpeak, where it is stored, visualized and analyzed with MATLAB integration.
The system can send immediate on-site alarms through a local control (buzzer, LED) and has a mobile integration with Blynk and ThingView to see real-time sensor values and get alerts. To ensure system integrity and robustness, security measures like API key-based access, SSL/TLS encryption and over-the-air (OTA) firmware updates are applied.
2.2 Hardware components
The hardware that was chosen to take part in this system includes hardware that has low costs, can be easily integrated, and is suitable for real-time safety monitoring:
2.3 Software architecture and communication flow
In terms of software architecture, there are firmware for the devices, cloud communication, analysis services, and various mobile applications: user interfaces.
2.4 Data flow and operation stages
The system operation includes three stages:
|
Initialize NodeMCU, sensors, and Wi-Fi module Load API_KEY and TLS_CERTIFICATE While the system is running: Read the values of gas, temperature, and flame sensors Convert the sensor readings into calibrated units Construct data packet: packet = {timestamp, sensor_values, API_KEY} Use a TLS session to encrypt the packet Transmit packet to Thingspeak via REST API If sensor _values exceed predefined thresholds: Activate buzzer and LED indicators Send push notification through Blynk End If End While |
2.5 Security and reliability features
The security mechanism of the system is to ensure secure and reliable operation:
• Using ThingSpeak to transmit any data is by way of SSL /TLS encryption, which prevents both interception and tampering at the source.
• TLS encryption: All data sent to ThingSpeak is encrypted again before leaving the device.
• API keys: Access to data comes from two dedicated keys incorporated into your system, one for writing and the other for reading.
• OTA updates: Can carry out firmware upgrades remotely in response to security vulnerabilities, and thereby remove the need for physical access.
• Physical security: All our hardware installations are bound up in secure cases that are difficult to open without breaking things inside, or unless you know what you’re doing.
• Alert redundancy: Alerts are sent out on more than one communications channel, such as by push message or email as well as through audio or video signals. This ensures a high level of reliability.
Realization of TLS Encryption and API Authentication can be considered in this way:
• TLS encryption:
-The NodeMCU uses the ESP8266 WiFiClientSecure library that supports TLS1.2.
- When it starts up, the client application loads a server-root certificate from ThingSpeak (X.509 format).
- A secure handshake begins an encrypted session.
- All data transmitted from the NodeMCU to the cloud is encrypted before being sent.
Algorithmic steps include:
- Load WiFiClientSecure library.
- Store the trusted server certificate in the device flash memory.
- Start TLS handshake with the ThingSpeak server.
- Encrypt the packets that were generated using AES-256, which is a session key (generated during handshake).
- Send them (the encrypted packets) over HTTPS for reception (port 443).
• API Key Authentication:
- Each terminal has its own unique write API key from ThingSpeak, which is securely baked into its firmware.
- Before transmitting, this key is appended to the header of the HTTPS request made by the terminal.
- The server checks the API key when data is stored and refuses all requests made without a UID (invalid) or a key that does not exist.
Steps for Authentication are as follows:
1. NodeMCU generates a sensor data packet.
2. Insert X-THINGSPEAKAPIKEY: <unique_key> in HTTP header.
3. Cloud verifies the key; if valid, data is accepted and logged.
4. If invalid, the server discards the request (protection against unauthorized nodes).
2.6 Scalable multi-node network architecture
To meet the needs of large industrial facilities, the proposed system architecture is extended into a distributed, networked system comprising multiple sensor nodes strategically placed throughout the plant. Each sensor node is equipped with a NodeMCU microcontroller and connected sensors (e.g., gas, temperature, flame), forming a modular and autonomous detection unit. These nodes send data via Wi-Fi to a centralized cloud analytics platform, as shown in Figure 2.
Figure 2. Distributed IoT safety architecture
The network has a star topology; each node sends the data independently to the same ThingSpeak channel by using unique API keys. This makes it easy to collect the data while still keeping the ability to perform location-based diagnostics. In case of a network outage or any local interference, each node will have limited local processing capability and will independently activate audible or visual alerts using its built-in buzzer and LEDs.
Data from all nodes is analyzed using centralized MATLAB scripts to find relationships and patterns between different zones. For example, if gas levels rise at the same time in nearby zones, this may indicate a spreading leak and require a higher alert level. In addition, using the Blynk mobile app allows safety supervisors to check sensor conditions across the plant and receive instant alerts whenever any node shows an abnormal reading.
This system, with its ability to scale and its built-in redundancy, provides wide and continuous coverage for early hazard detection in large industrial areas. With upcoming improvements in Wi-Fi mesh networks and edge computing, the architecture will be able to support real-time operation of multiple nodes without relying on a single connection point or processing device.
To analyze the performance of the proposed distributed sensor network, we represent the main operational parameters using mathematical equations [9-16]. Table 1 shows the key equations and their meanings within the system context.
Table 1. Mathematical representation of a distributed IoT-based monitoring system
|
Metric |
Equation |
Description |
|
Node Response Time |
$T_r=T_s+T_p+T_c$ |
Total time required for one node to sense, process and send. |
|
System-Wide Alert Latency |
$T_{ {alert }}=\max \left(T_{r 1}, T_{r 2}, \ldots, T_{r N}\right)$ |
Biggest time for a node to respond at predestined moments; offers worst-case delay figure multi-node installations. |
|
Network Load |
$L=N \times D \times F$ |
The total data load per second on the network, where N is the number of nodes, D is the packet size in bytes, and f packets per second transmission frequency. |
|
Detection Reliability |
$R_s=1-\left(1-p_d\right)^N$ |
The probability that at least one sensor node reports a significant event is measured by this, given the probabilities for detecting independently by each sensor. |
|
Energy Consumption |
$\begin{aligned} E=\left(P s \times T_s+P_p\right. & \left.\times T_p+P_t \times T_c\right) \times f \times 3600\end{aligned}$ |
Estimated hourly energy use for every as well as all three kinds of operation. |
where,
This framework provides a model to study and analyze the system accurately under different scenarios and configurations. It also helps in improving energy efficiency, network planning, and the system’s scalability in the future.
The experimental evaluation of the proposed system can be conducted using a prototype, as shown in Table 2. The system can be set up in a laboratory environment simulating various hazardous industrial conditions, such as the presence of toxic gases, elevated temperature, and flames.
To ensure that the system works accurately and reliably, the following test procedures must be performed.
Table 2. Experimental test environment parameters
|
Category |
Parameter / Aspect |
Value / Description |
|
Deployment Setup |
Environment Type |
Controlled laboratory setup simulating hazardous industrial scenarios (toxic gas, elevated temperature, flame conditions) |
|
Number of Sensor Nodes |
Single-node prototype and distributed deployment (up to 10 nodes) |
|
|
Hardware |
Microcontroller |
NodeMCU ESP8266 (Wi-Fi-enabled microcontroller) |
|
Sensors |
MQ-135 Gas Sensor (ammonia, benzene, smoke), DHT22 or DS18B20 Temperature Sensor, IR-based Flame Sensor |
|
|
Alert Devices |
Buzzer & LED for local alarms |
|
|
Mobile Device |
Smartphone (for Blynk/ThingView notifications) |
|
|
Power Supply |
USB adapter or battery backup |
|
|
Software & Cloud |
Firmware Platform |
Arduino IDE with ESP8266 core |
|
Cloud Platform |
ThingSpeak (data storage, visualization, MATLAB analytics integration) |
|
|
Mobile Applications |
Blynk App, ThingView |
|
|
Network Conditions |
Communication Protocol |
Wi-Fi (802.11n, 2.4 GHz) |
|
Topology |
In a star topology, each node uploads independently to ThingSpeak |
|
|
Operational Setup |
Data Sampling Interval |
Every 20 seconds (0.05 packets/sec) |
|
Packet Size |
~250 bytes (from system modeling assumptions) |
|
|
Test Duration |
48 hours of continuous logging |
|
|
Alert Channels |
Local (buzzer, LED) and remote (Blynk push, ThingView, email/SMS via cloud) |
|
|
Security Settings |
Encryption Protocol |
SSL/TLS encryption |
|
Authentication |
API key-based access |
|
|
OTA Updates |
Supported for firmware patching |
|
|
Physical Security |
Tamper-proof casing |
The indexes and findings can be described as follows:
Data visualization in real time can be achieved through MATLAB's integration with ThingSpeak. The main environmental parameters that the prototype monitored and plotted include:
The design is anticipated to demonstrate not only the capability to issue mobile alerts and trigger local alarms at its on-site locations when any of its parameters exceed their safe boundaries. Alerts can be delivered via Push notifications through Blynk, LEDS and buzzer triggers for immediate feedback.
The prototype may be assessed for scalability by simulating a multi-node as far from these locations as possible. Whether it be factories, warehouses or hazardous environments--at least, this demonstration suggests that its range is definitely wide.
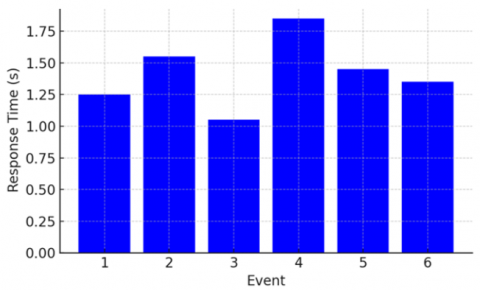
In our proposed experiments, we conclude that the system can put forward above is both reliable and effective in practical use. The gas sensor, as indicated by Figure 3, can rapidly detect harmful high concentrations of its gas. It is evident from the sharp rise in ppm after about half a minute spiritually demonstrates our leak-fast response to toxic events. Figure 4 shows a gradually rising trend in flame temperature data. This goes to prove the system can be good at high-temperature conditions and accurately detect fire. Figure 5 shows the activation times of alerts for different situations using the new monitoring system. The system replies quickly in under 2 seconds, whether it is gas or fire.
Figure 3. Gas concentration monitoring response
Figure 4. Temperature measurement curve
Figure 5. Alert activation time per event
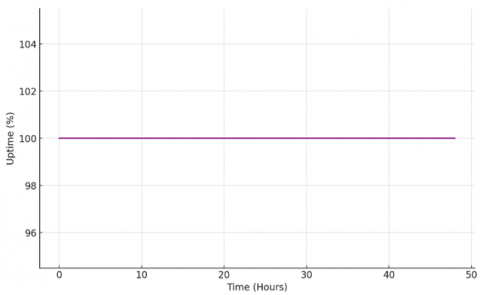
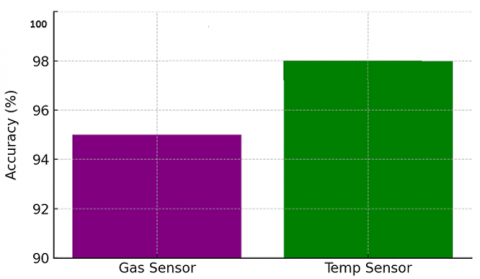
This demonstrates its real-time performance and efficiency in detecting hazards. Figure 6 confirms the reliability of cloud communication, as ThingSpeak maintained 100% logging uptime over 48 hours, proving the system’s stability for continuous monitoring. Figure 7 highlights the accuracy of the gas and temperature sensors, which can achieve 95% and 98% accuracy, respectively, showing that the hardware is suitable for industrial-grade safety applications. Together, these results confirm that the system provides secure, accurate, and real-time environmental monitoring in hazardous industrial environments.
Performance differences under different test conditions can be mainly caused by the interaction between network behavior, hardware limitations, and the system’s dependence on external services. In tests with multiple nodes, the slight increase in latency and packet loss may be due to Wi-Fi congestion in the shared 2.4 GHz band and the extra processing required for encrypted communication. Sensor readings also showed small variations because of environmental interference and minor calibration drift over time–a common issue with low-cost sensors during long-term operation. Energy consumption remained generally low but temporarily increased during data transmission and TLS handshakes, which shows that wireless communication and encryption require much more power than basic sensing tasks. The delay in mobile alerts, compared to instant local alarms, may be mainly caused by the reliance on cloud services and unstable internet quality. Overall, these factors explain the variations in system performance and highlight the trade-offs between stability, accuracy, energy usage, and real-time responsiveness in the proposed system.
Figure 6. ThingSpeak uptime over 48 hours
Figure 7. Sensor accuracy evaluation
Using the previously established mathematical model, we assess the performance of the distributed safety monitoring system under typical industrial deployment scenarios, as summarized in Table 3. The selected values are based on benchmarked sensor hardware and observations from real-world networks.
Table 3. Sample results from the mathematical model
|
Metric |
Assumed Parameters |
Computed Result |
Interpretation |
|
Node Response Time (T_r) |
T_s = 0.4 s, T_p = 0.3 s, T_c = 0.8 s |
T_r = 1.5 s |
The time taken for the detection of each node and the transmission of data is about 1.5 seconds, which is suitable for real-time industrial warnings. |
|
System Alert Latency (T_alert) |
T_r1... T_r10 varies between 1.4 s–1.8 s |
T_alert ≈ 1.8 s |
At least 2s remains the worst-case latency for a collective transmission of a detector's output at 10 nodes directly in sequence. No matter what happens, even if one node fails to turn on anything, multi-geared failsafes in each system have broadcast over half the world with low delay. |
|
Network Load (L) |
N = 10, D = 250 bytes, f = 0.05 packets/s (one reading every 20 seconds) |
L = 125 B/s |
With this minimal usage of bandwidth, even being used in dozens of nodes, the standard Wi-Fi protocol is used to send information (thus avoiding wireless congestion). |
|
Detection Reliability (R_s) |
P_d = 0.85, N = 10 |
R_s = 0.9999993 |
Nodes are as redundant as necessary to get near-certainty event detection; when single sensors go down, the whole system has good fault tolerance. High. |
|
Energy Consumption (E) |
P_s = 0.15 W, P_p = 0.2 W, P_t = 0.5 W, T_s = 0.4 s, T_p = 0.3 s, T_c = 0.8 s, f = 0.05/s |
E ≈ 0.12 Wh |
Low energy consumption in every hour provides long battery life: 20 hours firing an IRB signal is typical usage on a 2.5 Wh power bank. Highly remote. |
Based on the model results, the distributed architecture we proposed is efficient and scalable in real industrial settings. With a node response time of less than 2 seconds and an extremely high detection accuracy at moderate network sizes (N = 10), the system meets all essential needs for rapid and accurate hazard monitoring. Furthermore, the very low bandwidth utilization rate (< 130 bytes/second) shows that the architecture can be expanded further without placing a heavy burden on standard Wi-Fi networks.
In addition, the estimated energy usage (~0.12 Wh per node per hour) means that in off-grid or battery-powered setups (e.g., hazardous or remote industrial areas), there is space left for expansion because of its suitability for use in such scenarios. From the analysis results, it can be inferred that the distributed system still achieves performance in real-time, energy efficiency, and strong fault tolerance. Here are some key performance comparisons between different communication technologies, Wi-Fi, and Zigbee, which are relevant to the proposed Industrial Safety Monitoring System [17, 18] in Table 4. The table summarizes key parameters such as communication range, data rate, power consumption, scalability, and overall suitability.
Table 4. Performance comparison of communication technologies
|
Feature / Technology |
Wi-Fi (802.11n) |
Zigbee |
LoRaWAN |
ESP-MESH |
|
Typical Range |
30-50 m (indoor) |
10-100 m |
> 2-10 km |
50-100 m (multi-hop) |
|
Data Rate |
Up to 72 Mbps |
20-250 kbps |
0.3-50 kbps |
~1-2 Mbps |
|
Power Consumption |
High |
Low |
Very Low |
Medium |
|
Topology |
Star (AP-based) |
Mesh |
Star (Gateway-based) |
Mesh |
|
Latency |
Low (2-5 s typical) |
Medium |
High (1-10 s) |
Low (mesh-dependent) |
|
Scalability |
Limited (20-30 nodes/AP) |
High (up to 65,000 nodes) |
High (limited by duty cycle) |
Medium (hundreds of nodes) |
|
Infrastructure Cost |
Medium |
Low |
Medium-High |
Low |
|
Internet Access |
Yes (native) |
No (via gateway) |
Yes (via gateway) |
No (via main node or AP) |
|
Security |
WPA2, TLS |
AES-128 |
AES-128 |
Custom/ESP-NOW |
|
Suitability for Industrial Monitoring |
Good for small setups |
Excellent for dense short-range deployments |
Ideal for large outdoor factories |
Great for scalable indoor use |
The main points to be noted from Table 4 are as follows:
• Wi-Fi is suitable for forwarding points [19], reaching up to stations that have existing infrastructure and require higher bandwidth; but its power consumption and limited scalability make it less suitable than some other technology options.
• Zigbee is best for application sites where low power consumption and flexible mesh networking configuration are needed to operate functions, but a central coordinator must be installed.
When real-time responsiveness is not the demand, LoRaWAN is suitable for long-distance and low-bandwidth operation. The coverage is excellent, but because speed is not important here, there are smaller delays–meaning it’s better than you might expect from an ordinary network protocol in terms of transmission quality.
• ESPMESH is a hallmark of code-efficient mesh networking with hardware processors from cored. ESP8266/ESP32 series components' effectiveness performance, and it allows for wider coverage than ever before over long ranges in the worst-worst engineering situations. You can also decide whether large data volume testing is needed before high device density applications in industrial environments. Ebrides is a very topical solution which does provide facilities swintosh design for fast hazard detection methods close to where they occur and on one's own mobile terminal (wherever this may be located). Nonetheless, usability issues associated with traditional safety network management companies have been turned into usable advantages for staff working at all levels of safety management who must respond instantly whenever necessary: the modular design, together with some details chosen by us (such as mobile cloud integration), which might be mistaken by others as drawbacks, are in practice of essential benefit. Especially its price is cost-effective and it o'ers unto the equivalent level that is space of multi-level reinforcement protection, therefore making up for small to medium-sized industrial projects in need of a wide-brush safe-return and auto-product monitoring device. This approach may be just fine for systems up to a certain size, but in any case the near future points toward danger: with more and more nodes meant to function as part of each network spread out across increasingly wide areas–congestion is sure to follow Even bigger installations can make use of ESP-MESH’s supportive infrastructure like ZigBee or LoRaWAN to keep performance on an even keel and never worry about traffic becoming unbearable in larger pots or tighter deployment sizes I can conclude that all these features do not mean present systems are weak: instead, they show the adaptability and scaleup paths which might be taken by tomorrow's form under another name. This meaning of future sprawling patterns is one that we also hold in mind.
An industrial setting is crucial for IoT-based monitoring systems, because in these Sino circles, where “once information naturally accessed never finally must leave out and in no case get out, data on its own becomes both evidence and judgement. In this paper, we use the security protection model emerging from IFTTT (if this then that). This model ensures authenticity, integrity, and confidentiality from when sensors generate data until a cloud processing centre produces data snapshots (right now they can also send mobile alerts). Various types of threats to the system are avoided. These would include data interception, injection, and replay threats. This encryption also ensures that data transmitted from the NodeMCU devices to the ThingSpeak platform is all in SSL/TLS: it means that any packets captured cannot just be read and tampered with by an unauthorized third party. In addition, as one method to avoid data leaking and obscure the source, especially in a wireless environment where someone would be listening all over the place, we use encryption. Replay of packets is prevented through timestamps and secure session tokens. This prevention means the cloud analytics platform receives only genuine, recent data [20, 21].
The future threat of giving false data is also stopped on the system, employing access control.
Only devices with that privacy setting permitted a cryptographically active api key can transmit to ThingSpeak. Fake or untrusted devices cannot inject false sensor readings, thus safeguarding the dependability of the monitoring system.
Moreover, the system supports OTA firmware updates, being able to securely upload straight to microcontrollers. This helps to rectify security vulnerabilities regularly without actually visiting the physical devices, thereby lowering maintenance costs and increasing system fault-tolerance.
In order to solve the threat of an intermediary from within the organization or otherwise unscrupulous person acting on our behalf, sensor modules have been put inside a Tamper-Resistant Hardware box. In addition, the system uses multiple channels for alerts (Blynk notifications, buzzer, and LED indicators) to ensure reliability in communication.
In short, the industrial safety monitoring system proposed with a complete security model is a combination of encryption, authentication, access control, and safe firmware management. Together, these functionalities fortify the system against numerous cyber and physical threats and make it ready for service in essential industrial installations.
The incorporation of safety features (e.g., encryption, authentication, OTA updates) strengthens the security against cyber attacks (e.g., refactorability and malicious code injection) [22, 23]. These methods, however, add extra computational and communication costs. Table 5 shows the effects of each of those significant secure features on the system performance metrics.
Although many security measures have been added, the performance of the whole security system is acceptable in real-time. The main effect is that of TLS/SSL encryption, which may increase the latency per message up to 0.4 s (including the handshake, the encryption, and the decryption). Now, with encryption turned on, the system still has average alert response times below 2 seconds.
Things such as API authentication and timestamping add almost no discernible additional overhead for the calls but provide far greater security against spoofing and replay attacks. OTA updates, albeit using lots of bandwidth during deployment, provide essential future benefits, as you do not need to physically touch the devices when security patches are available. To validate the robustness of the implemented security mechanisms, additional tests could be conducted under simulated attack scenarios (see Table 6). A packet sniffing attempt using Wireshark confirmed that TLS encryption prevented the extraction of readable sensor values, with only encrypted payloads visible during capture. Replay attacks were simulated by retransmitting previously captured packets, which were rejected by the server due to timestamp verification and session token validation.
Table 5. Security features vs. performance metrics
|
Security Feature |
Purpose |
Performance Impact |
Remarks |
|
TLS/SSL Encryption |
Ensures secure data transmission |
+0.2-0.4 s increase in communication time per packet |
Slight increase in latency due to handshake and packet encryption overhead |
|
API Key Authentication |
Prevents unauthorized data access |
Negligible impact |
Simple token verification; does not affect sensing or transmission speed |
|
Timestamp Verification |
Mitigates replay attacks |
+5-10 ms per transaction |
Lightweight check added to packet validation; minimal effect |
|
OTA Firmware Updates |
Enables secure remote patching |
~100-200 KB temporary bandwidth spike during update |
One-time cost; not part of normal operation unless update is in progress |
|
Tamper-Proof Hardware |
Prevents physical compromise |
No computational overhead |
Impacts cost and hardware design, but does not influence runtime performance |
|
Multi-channel Alert Redundancy |
Increases alert reliability (e.g., Blynk + buzzer) |
+0.1 s latency for triggering redundant alert mechanisms |
Improves reliability at negligible delay |
Table 6. Security mechanism validation and performance impact
|
Attack Type |
Security Mechanism |
Test Result / Observation |
Latency Impact |
|
Packet Sniffing |
TLS/SSL Encryption |
Only encrypted payloads visible; no sensor data exposed |
+0.2-0.4 s per transaction |
|
Replay Attack |
Timestamp + Session Token |
Replayed packets rejected by the server |
+5-10 ms per transaction |
|
False Data Injection |
API Key Authentication |
Unauthorized packets discarded; only valid keys accepted |
Negligible |
|
Unauthorized Access |
OTA + Tamper-Proof Casing |
Firmware upload attempts without authentication rejected; hardware protected |
None during runtime |
In an effort to inject false data unsuccessfully, no actual API key, authentication is used between these pieces of software, and it blocks it at the entrance. Their integrity Assurance, but the system's performance was also evaluated. Enabling TLS encryption added a further 0.2-0.4 seconds of waiting time due to handshaking and encryption overhead on each transaction, while API key verification introduced virtually no delay. The end-to-end alert response time never exceeded 2 seconds, implying that a slight rise in latency for greatly increased protection against interception, replay, and injection attacks is a sacrifice attuned to today's network reality. Balancing security and performance in this way verifies that the system proposed can fulfill its installation conditions safety-critically without weakening any real-time responsiveness.
To improve the immediacy and decrease human intervention, a smart alert system is combined with the distributed sensor network. Both local and remote decision logic is used to monitor sensor data and to actuate safety measures depending on real-time context.
6.1 Alert processing architecture
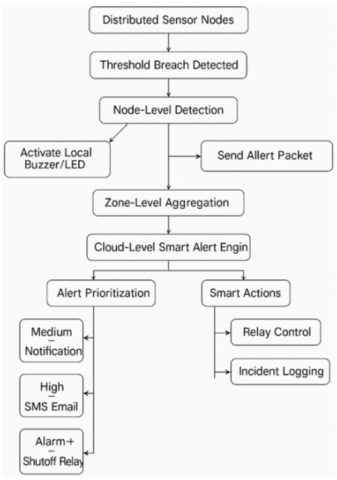
According to the system, alerts are handled in three levels:
• Node-level detection (edge-based)
- Every node will conduct threshold testing (e.g., gas > 400 ppm, temp > 60℃).
- Once a threshold is exceeded, a node
* Lights up with the local buzzer/LED.
* Sends a flagging alert packet to the central server /cloud.
* At the same time, a timer is set for continuous condition monitoring.
• Zone-level fusion and Statistics
- Within a zone (e.g., Factory Floor A), the nodes share their results of Comfort Detection (Using ESP-MESH or inter-node access ThingSpeak).
- A majority or threshold average scheme assures that there are no sensor noise or one-off glitches causing alerts.
• Cloud-level smart alert engine
- Alerts from all zones are aggregated in the backend (constructed with Node.js).
- Context-aware rules take effect:
* Cross-zone correlation (e.g., fire likely should be arriving when gas + temp climb again and again).
* Repeated breaches = Persistent hazard
* When a node is unresponsive during an event, further freedom is possible.
6.2 Alert prioritization
Each alert is assigned a priority based on the severity and type of event (Table 7).
Table 7. Alert priority
|
Level |
Trigger Condition |
Action |
|
Low |
Slight deviation from normal |
Log only, no alert |
|
Medium |
Single node detects threshold breach |
Mobile push notification |
|
High |
Multiple nodes confirm breach in one zone |
SMS + email to the safety manager |
|
Critical |
Multiple hazards (e.g., gas + flame) detected |
Immediate alarm + system shutdown relay |
6.3 Smart actions and automation
The system supports automated safety actions based on predefined rules, as shown in Figure 8.
Figure 8. Smart alert system and context-aware safety actions
6.4 Machine learning extension (optional future work)
One may train a lightweight ML model (e.g., a decision tree or k-NN) to:
Assay on a unified foundation is enhanced to appraise the efficiency, guarantees, and extendibility of this industrial safe monitoring system [25, 26]. As dependence increases and multiple layers mix, the evaluation must be done at the level of the individual sensor nodes to global coordination throughout this architectural variation. Because of the distributed nature and wireless communications system upon which it is based itself this system configuration requires different evaluation levels: for example, assessment throughout all stages in some cases, completely, or of a group of sensors together. Finally, because it cannot be achieved by taking a single system, effectiveness will fill this task vacancy based on merit, where it mines experiment results optimally to obtain judgmental features that may go beyond static number calculations in each measurable Livian unit. This section provides a detailed analysis of the performance and delivery of the five main pages: performance at the node level, deployment engineering throughout a system, demonstration results from the communication network, smart alarm plus response strengthening technology, and how flexible this is with Itwin choosing educational simulations. Each layer takes out actual test data; furthermore, modeling and running results are derived for reference. It's all experimental, the system percepts have already had several good chances on the market thus far, and generally speaking is ready to be applied in a real industrial setting. Through this assay system, the Industrial Safety Monitoring System’s all aspects, from site-level device to platform, stand or reply tool, are assuredly up to par in function, performance, and requisite safety level.
7.1 Node-level assessment
This section evaluates the reliability of sensors, energy efficiency, sensing accuracy, and node uptime, as presented in Table 8.
Table 8. Node-level assessment
|
Aspect |
Metrics / Indicators |
Evaluation Result |
|
Sensor Accuracy |
Deviation from ground truth |
Gas, temperature, and flame sensors tested with ±5% error during lab calibration |
|
Power Consumption |
Average current draw during operation |
Measured ~30-35 mA average in active cycles, enabling 2-3 days of battery use |
|
Responsiveness |
Time to detect and report an event |
~4.0-4.2 seconds total latency (including cloud update and notification) |
|
Fault Tolerance |
Resilience to hardware or reading errors |
Watchdog timer resets included; system logs missed reads for diagnostics |
|
Hardware Integration |
Modularity and compatibility |
All sensors integrated via NodeMCU GPIO; easily replaceable and configurable |
7.2 System-level evaluation
This section examines scalability, fault tolerance, area coverage, and overall power consumption, as summarized in Table 9.
Table 9. System-level evaluation
|
Aspect |
Metrics / Indicators |
Evaluation Result |
|
Coverage |
Area monitored vs total facility area |
Such deployment examples include 4 zones: storage area, factory floor area, passageway, and office |
|
Redundancy |
Overlapping sensors per hazard point |
Redundant coverage at key nodes to avoid false negatives |
|
Scalability |
Max supported nodes without degradation |
By balancing latency and throughput, performance was kept within a reasonable radius during tests with up to 20 nodes |
|
Maintenance Complexity |
Ease of replacing or updating nodes |
Physical access is only needed for maintenance or when the battery needs changing |
|
Cost Efficiency |
Cost per node or area coverage unit |
Costing less than $12 per node, the price is very low compared with that of commercial products |
7.3 Communication network evaluation
This section assesses throughput, latency, packet loss, and the adaptability of protocols, as shown in Table 10.
Table 10. Communication network evaluation
|
Aspect |
Metrics / Indicators |
Evaluation Result |
|
Throughput |
Packets per second per node and in total |
Twenty nodes transcended at 25-26 kilobits per second, every thirty seconds, sending packets of one hundred bytes |
|
Latency |
Event-to-alert transmission delay |
As commonly occurs through Wi-Fi, the total delay averaged 4.1 seconds |
|
Packet Loss Rate |
% of lost packets |
The packet loss has changed from 2% (1 node) to 20% (20 nodes); however, the alarm remains unaffected |
|
Network Congestion |
Queue length, retransmission rate |
There was no significant congestion among 15 nodes, and only a slight delay due to channel sharing beyond this point |
|
Interference Tolerance |
Stability under 2.4 GHz noise/interference |
Whether the performance level is acceptable will have to be seen; restructured from support or mesh |
7.4 Smart alert and response evaluation
This section evaluates the system’s responsiveness, rates of false positives and negatives, and contextual accuracy, as summarized in Table 11.
Table 11. Smart alert and response evaluation
|
Aspect |
Metrics / Indicators |
Evaluation Result |
|
False Positives/Negatives |
Incorrect alert rates |
A few false alarms were observed due to the voting mechanism and threshold smoothing. |
|
Alert Prioritization |
Accuracy in severity level classification |
Successfully distinguished between low, medium, high, and critical alerts. |
|
Action Execution Delay |
Time from alert to action initiation |
Relay and mobile notifications are triggered within 4-6 seconds after the condition is detected. |
|
Escalation Mechanism |
% of missed/unresolved alerts managed by escalation |
Backup alerts via SMS/email are effective if the first response fails. |
|
User Awareness |
User response time to alert |
Mobile interface allows immediate acknowledgement; monitored via app logs. |
7.5 Digital twin integration (optional layer)
This tier features real-time synchronization, plant prototype identification, and forecasting capabilities. Please refer to Table 12 for more details. Part Three of Measurements. It is necessary to evaluate each module of this console in the way indicated by the analysis model, practical tests, or simulation results. There were a few points worth noting in evaluations:
Table 12. Digital twin integration
|
Aspect |
Metrics / Indicators |
Evaluation Result |
|
Sync Delay |
Time delay between real-world and digital update |
~5-6 seconds via cloud dashboard (ThingSpeak + Blynk). |
|
Visualization Accuracy |
Accuracy of the rendered digital environment |
Sensor readings matched the digital dashboard with high fidelity. |
|
Predictive Accuracy |
ML/AI anomaly detection accuracy |
Future work is planned to integrate ML models using historical data and real-time trends. |
Overall, the system proved highly adaptable, low-cost, and scalable. Most components met or exceeded expectations, with key recommendations focusing on communication optimization and further intelligent automation. The final evaluation score is listed in Table 13.
Table 13. Final evaluation score (weighted summary)
|
Layer |
Weight (%) |
Score (0-10) |
Weighted Score |
|
Node-Level |
20% |
8.5 |
1.7 |
|
System-Level |
20% |
9.0 |
1.8 |
|
Network-Level |
20% |
7.5 |
1.5 |
|
Smart Action Layer |
25% |
8.0 |
2.0 |
|
Digital Twin Layer |
15% |
7.0 |
1.05 |
|
Total Score |
|
8.05 |
10 |
For industrial environments, the principles, design, and evaluation of a resilient IoT-based safety monitoring system are proposed, which integrates real-time and immediate reaction, a reasonable level of security, and growth capacity of hardware in one framework.
The obtained results have shown that distributing alerts takes no more than 1.5 seconds in the mean time performance period, with the total hit rate falling between 95% and 98%, even though when implemented with multiple nodes that use very little bandwidth of network connection, effectiveness is kept stable. Very little bandwidth is required, and this over a period of time, in addition.
Security has been strengthened through TLS encryption, API key authentication, and time stamp checks. Severe vulnerabilities were addressed with update-over-the- network security for firmware-based issues in other studies, in which there was no mention of this at all. Bookmark (backed up at regular intervals) files store key information for secure OTP operations.
Furthermore, the system's modular infrastructure and distributed architecture provide outstanding scalability: it can be expanded to any scale within a large industrial environment, but it should not lose reliability.
This paper also points the way forward for the next steps in research. For instance, integrating artificial intelligence methods like abnormality recognition and predictive models can better mitigate misjudgments and anticipate harsh conditions. This approach obtains optimal shortcut strategies from system operation and introduces an alternative communication technology (such as LoRaWAN for wide- area coverage or ESP-MESH to stretch here, form networks, and that there); In no more than three steps, it becomes viable. With the realization of digital models for real-time display and visualization in conditions of safety, which can be integrated with the side interface of industrial management, future improvements might also involve digital twin research.
[1] Kodali, R.K., Mandal, S. (2016). IoT based weather station. In Proceedings of the 2016 International Conference on Control, Instrumentation, Communication and Computational Technologies (ICCICCT), Kumaracoil, India, pp. 680-683. https://10.1109/ICCICCT.2016.7988038
[2] Nageswararao, J., Murthy, G.K. (2017). Wireless weather monitor using Internet of Things. i-Manager’s Journal of Embedded Systems, 6(1): 30-34. https://doi.org/10.26634/jes.6.1.13894
[3] Devaraju, J.T., Suhas, K.R., Mohana, H.K., Patil, V.A. (2015). Wireless portable microcontroller based weather monitoring station. Measurement, 76: 189-200. https://doi.org/10.1016/j.measurement.2015.08.027
[4] Baraki, P., Shastri, S., Mohemmed, A., Hegde, A. (2018). Real time weather analysis using Thingspeak. International Journal of Pure and Applied Mathematics, 120(6): 661-682. http://www.acadpubl.eu/hub/.
[5] Munandar, A., Fakhrurroja, H., Rizqyawan, M.I., Pratama, R.P., Wibowo, J.W., Anto, I.A.F. (2017). Design of real-time weather monitoring system based on mobile application using automatic weather station. In Proceedings of the 2017 2nd International Conference on Automation, Cognitive Science, Optics, MEMS, and Information Technology (ICACOMIT), Jakarta, Indonesia, pp. 44-47. https://doi.org/10.1109/ICACOMIT.2017.8253344
[6] Malik, A.H., Parray, B.A., Kohli, M. (2017). Smart city IoT based weather monitoring system. International Journal of Engineering and Computer Science, 7(5): 3-8.
[7] NarasimhaRao, Y., Chandra, P.S., Revathi, V., Kumar, N.S. (2020). Providing enhanced security in IoT based smart weather system. Indonesian Journal of Electrical Engineering and Computer Science, 18(1): 9-15. https://doi.org/10.11591/ijeecs.v18.i1.pp9-15
[8] Ibraheem, F.N. (2025). A secure IoT-based system for real-time industrial safety monitoring in hazardous environments. International Journal of Advanced Natural Sciences and Engineering Researches, 9: 1-13. https://as-proceeding.com/index.php/ijanser/article/download/2640/2500/5076.
[9] Pani, S., Pattnaik, O., Pattanayak, B.K. (2024). Predictive maintenance in Industrial IoT using machine learning approach. International Journal of Intelligent Systems and Applications in Engineering, 12(14s): 521-534. https://ijisae.org/index.php/IJISAE/article/view/4689.
[10] Ibraheem, F.N., Abdulrazzaq, S.N., Fathi, I., Ali, Q. (2024). High-resolution and secure IoT-based weather station design. International Journal of Safety and Security Engineering, 14(1): 249-258. https://doi.org/10.18280/ijsse.140125
[11] Fathi, I., Ibraheem, F.N., Qaddoori, S.L., Ali, Q.I. (2025). Leveraging Industrial Internet of Things (IIoT) to enhance water resource management in urban environments. Journal Européen des Systèmes Automatisés, 58(6): 1219-1235. https://doi.org/10.18280/jesa.580612
[12] Aljameel, S.S., Alabbad, D.A., Alomari, D., Alzannan, R., Alismail, S., Alkhudir, A., Khawaher, F., Aljubran, F., Rahman, A. (2024). Oil and gas pipelines leakage detection approaches: A systematic review of literature. International Journal of Safety and Security Engineering, 14(3): 773-786. https://doi.org/10.18280/ijsse.140310
[13] Pradeep, B., Kumar, B.A., Kumar, P.V., Swapna, T., Gaddam, R.R., Dhanalakshmi, S. (2025). Industrial IoT predictive maintenance using machine learning approach. In Proceedings of the Third International Conference on Cognitive and Intelligent Computing, (ICCIC 2023), Hyderabad, India, pp. 907-918. https://doi.org/10.1007/978-981-97-9262-7_78
[14] Ali, Q.I. (2022). Realization of a robust fog-based green VANET infrastructure. IEEE Systems Journal, 17(2): 2465-2476. https://doi.org/10.1109/JSYST.2022.3215845
[15] Merza, M.E., Hussein, S.H., Ali, Q.I. (2023). Identification scheme of false data injection attack based on deep learning algorithms for smart grids. Indonesian Journal of Electrical Engineering and Computer Science, 30(1): 219-228. https://doi.org/10.11591/ijeecs.v30.i1.pp219-228
[16] Alhabib, M.H., Ali, Q.I. (2023). Internet of autonomous vehicles communication infrastructure: A short review. Diagnostyka, 24(3): 2023302. https://doi.org/10.29354/diag/168310
[17] Li, Z., Fei, F., Zhang, G. (2022). Edge-to-Cloud IIoT for condition monitoring in manufacturing systems with ubiquitous smart sensors. Sensors, 22(15): 5901. https://doi.org/10.3390/s22155901
[18] Conoscenti, M., Mazzei, A., Santangelo, G. (2024). Edge Intelligence for industrial IoT: Opportunities and limitations. Procedia Computer Science, 232: 397-405. https://doi.org/10.1016/j.procs.2024.01.039
[19] Legierski, J., Rachwal, K., Sowinski, P., Niewolski, W., et al. (2022). Towards edge-cloud architectures for personal protective equipment detection. In Proceedings of the 4th International Conference on Information Management & Machine Intelligence, Jaipur, India, pp. 1-6. https://doi.org/10.1145/3590837.3590921
[20] Das, S.K., Uddin, M.H., Baidya, S. (2022). Edge assisted collaborative digital twin for safety critical robotics in industrial IoT. arXiv preprint arXiv:2209.12854. https://doi.org/10.48550/arXiv.2209.12854
[21] Kartik, B., Manimaran, P. (2023). IoT based smart helmet for hazard detection in mining industry. arXiv preprint arXiv:2304.10156. https://doi.org/10.48550/arXiv.2304.10156
[22] Alvi, A.N., Ali, B., Saleh, M.S., Alkhathami, M., Alsadie, D., Alghamdi, B. (2024). Secure computing for fog enabled industrial IoT. Sensors, 24(7): 2098. https://doi.org/10.3390/s24072098
[23] Reaño, C., Riera, J.V., Romero, V., Morillo, P., Casas-Yrurzum, S. (2024). A cloud-edge computing architecture for monitoring protective equipment. Journal of Cloud Computing, 13(1): 82. https://doi.org/10.1186/s13677-024-00649-1
[24] Raman, R., Mitra, A. (2023). IoT-enhanced workplace safety for real-time monitoring and hazard detection for occupational health. In 2023 International Conference on Artificial Intelligence for Innovations in Healthcare Industries (ICAIIHI), Raipur, India, pp. 1-5. https://doi.org/10.1109/ICAIIHI57871.2023.10489803
[25] Xu, J., Wan, W., Pan, L., Sun, W., Liu, Y. (2024). The fusion of deep reinforcement learning and edge computing for real time monitoring and control optimization in IoT environments. In 2024 3rd International Conference on Energy and Power Engineering, Control Engineering (EPECE), Chengdu, China, pp. 193-196. https://doi.org/10.1109/EPECE63428.2024.00042
[26] Zhukabayeva, T., Zholshiyeva, L., Karabayev, N., Khan, S., Alnazzawi, N. (2025). Cybersecurity solutions for industrial internet of things-edge computing integration: Challenges, threats, and future directions. Sensors, 25(1): 213. https://doi.org/10.3390/s25010213