Novie Susanto*![]() | Maria Goretti Beata Setyo Maharani
| Maria Goretti Beata Setyo Maharani![]() | Manik Mahachandra
| Manik Mahachandra![]()
© 2025 The authors. This article is published by IIETA and is licensed under the CC BY 4.0 license (http://creativecommons.org/licenses/by/4.0/).
OPEN ACCESS
Safe driving is basic driving training that takes care of safety for both drivers and passengers. This pilot study was conducted as a laboratory experiment-based study to determine the influence of weather on alertness levels as well as the most dangerous conditions on driver alertness. The experiments were conducted on six participants using the research instruments of an electroencephalogram (EEG) and a driving simulator to obtain an alertness ratio. This study shows that there is an influence of weather on the level of alertness of drivers. In addition, despite the limitations of a small sample size of participants, this within-subject study provides insight into sunny weather conditions as the most dangerous condition for the level of alertness of drivers based on the ratio gradient. This result concerns feelings of boredom, familiarity, discomfort, and high visibility conditions. The results of the study gave some recommendations for improvements that focused on safety driving knowledge, such as the importance of promoting drivers' alertness during driving and regular vehicle maintenance. In addition, it also gives recommendations for dealing with fatigue and living a healthy life. Thus, efforts to maintain the level of alertness of drivers and reduce the number of accidents can be considered.
alertness, sunny weather, driving simulator, brain activity, EEG power spectral density
The number of cars in Indonesia increases every year. The increase in the number of cars is in line with the increase in the number of traffic accidents in Indonesia. Data obtained from the Central Statistics Agency of Indonesia [1] shows that the number of accidents in Indonesia in 2020 reached 100,028 cases, increasing by 3.62% to 103,645 cases in 2021. Based on weather conditions in Indonesia from 2019 to 2021, the number of transportation accident cases consisted of sunny weather (92.3%), rain/drizzle (3.1%), and cloudy (1.7%) [2]. According to the studies [3, 4], traffic accidents can be caused by at least some factors, including people, the environment, vehicle conditions, and road conditions. Human factors consist of 4A, namely alertness, vigilance, attitude, and anticipation [5]. Alertness or vigilance is the driver's action that always be alert and vigilant towards other road users. In 4A, Alertness or driver vigilance includes skills in driving safety, such as how to control the vehicle and get out of dangerous conditions [6]. As explained in references [7, 8], driver unawareness is closely related to the increased risk of traffic accidents. In the Indonesian Dictionary (KBBI), weather is the condition of the air (about temperature, sunlight, humidity, wind speed, and so on) in a particular place for a limited period. Some examples of weather conditions are sunny, rainy, and foggy. Zou et al. [9] conducted states that climate variables such as average temperature and rainfall have a significant impact on the frequency of traffic accidents. Chen et al. [10] found that weather can significantly affect driving behavior indicators, and when the weather worsens, the driver's perceived risk increases, so that fast and hasty driving behavior will decrease [11]. According to Ahmed and Ghasemzadeh [12], drivers should reduce speed to balance the effects of rain on the driving task. In addition, the weather can increase situational awareness [13].
Driving simulators are considered an effective and safe method for conducting high-risk research that simulates real-world traffic conditions, including mapping human brain conditions during driving. Human brain wave activity can be used to measure a person's level of alertness objectively [14]. An electroencephalogram (EEG) can show the electrical activity of the brain and state of mind, such as fatigue, alertness, health, emotional, and concentration [15].
Research on driving a car in various weather conditions and its relationship to the level of driver alertness in driving has never been conducted. Previous research has shown that climate (average temperature and rainfall) impacts driver behavior, increasing the potential risk of accidents [9-12]. Another factor influencing driving safety is driver alertness. Lack of driver alertness is closely associated with an increased risk of traffic accidents [6, 8]. Given this background, it is important to further understand driver alertness in various climatic situations.
The use of EEG as a tool to measure brain activity has been used in various studies, such as those by Chen et al. [10], who measured brain function in drivers in foggy weather, and in healthcare applications [16, 17], as well as in fatigue measurements [18-21]. Other studies have also used ECG, EMG, and real-time monitoring systems to measure driver fatigue [22, 23] without considering weather conditions. However, research using EEG is expected to provide a more detailed explanation of brain activity during driving in different weather conditions.
In addition, there is a need to objectively analyze brain wave activity when driving in different weather. Drivers will be asked to drive in three conditions, namely rainy, foggy, and sunny. In addition, an EEG will be installed to record brain wave activity generated while driving. The results of the EEG recording will be processed and analyzed to determine whether there is an effect of weather on the driver's level of alertness and the differences in brain waves generated.
This research is in the form of laboratory experiments conducted in the Work Systems Design and Ergonomics laboratory, Industrial Engineering, Diponegoro University, using a driving simulator designed to resemble a real-world driving situation. The experimental design used is a within-subject design. Each respondent will be subjected to 3 different weather treatments, namely conditions C (sunny), K (foggy), and H (rainy), as independent variables. The dependent variable in this study is the driver's alertness level measured using EEG. The controlled variables in this study include the type of simulation (free driving), the new city-business district simulation route, the sedan type of car, the automatic car transmission system, and the right position of the steering wheel.
The study was conducted by applying complete counterbalancing, thus involving 6 male participants (19-22 years old) as part of the. A small sample size of participants using a within-subject study was selected. This sample size collected data from 18 individual driving sessions (6 participants × 3 driving treatments) and fulfilled the sample size requirements for simple experimental research [24]. This experimental design is expected to effectively expand the data set, thereby increasing the depth and reliability of the analysis [9].
The gender of the participants is limited to only men due to technical limitations of the equipment the fact that male drivers dominate the number of traffic accidents [25]. The participants should have a car driving license and have a minimum of one year of driving experience. They will be asked to get enough sleep with a sleep duration of 7-8 hours. To control the condition of the participants, they were asked not to consume caffeine, alcohol, or drugs for at least 24 hours before the simulation was carried out. They performed simple health screening (blood pressure and heart rate) before the experiment, as well.
This study uses research instruments in the form of a driving simulator and an EEG. Driving Car Simulator was used to represent driving conditions in real conditions. Other devices that support this instrument include computers, monitors, and the Logitech G27 Racing Wheel, which includes a steering wheel, pedal set, transmission lever, driver’s seat, CPU, sound system, and three LCD screens. The simulator was located inside an experimental room with bright walls, covered windows, and natural light. Using a real driving seat, a good sound system, and a complete set of driving apparatus made the simulation run in medium fidelity. The Driving Car Simulator software that will be used is City Car Driving with the New City-Business District Road type, which has the traffic and road models closest to the roads in Indonesia. Before starting the actual simulation, each participant underwent a "warm-up" period. This phase, lasting about ten minutes, allowed the simulator to run and gave participants time to adjust to the simulation environment and become familiar with the controls [26]. The warm-up aimed to reduce potential biases by minimizing initial performance variability and learning effects, ensuring that data collection began with participants well-acclimated to the simulation.
EEG functions to record brain wave activity from participants while driving, and will be installed on the participant's head. The EEG used is EMOTIV EPOC+ with 14 electrodes and a sampling rate of 128Hz. The EEG was attached to the participant's head, and data collection was focused on the frontal lobe of the brain at F3 and F4, which focuses on reflex movement, brain activity, and alertness. According to previous studies [27, 28], this part is the center of consciousness and alertness in the human brain that is easiest to detect. Data collection began with a driving simulator trial for participants, which would be carried out for 10 minutes, and a baseline record, namely the condition of the eyes closed and open for a total of 30 seconds.
After the preparation stage was completed, EEG recording was started, and participants drove for 60 minutes at a speed of 50 km/h. To avoid carry-over effects from previous treatments, in addition to using counterbalancing, a participant receives one treatment in one day. Thus, each participant needed three days each to complete the three treatments given. The brain wave recording data would then be processed using MATLAB for the data filtering process, as well as transforming the data from time-based to frequency-based [29]. The processed data would be divided into 12 parts so that each part would be powered for 5 minutes. After that, it was continued to the process to obtain the alpha, beta, and theta power values to be entered into the sleepiness ratio ((α + θ)/β) [30]. A high ratio result indicates a low level of participant alertness. Furthermore, data processing will be continued to the classical assumption statistical test, the One-way ANOVA test, and the Post Hoc test to determine which conditions are the most significant and risky to the driver's level of alertness.
3.1 Ratio gradient of alertness
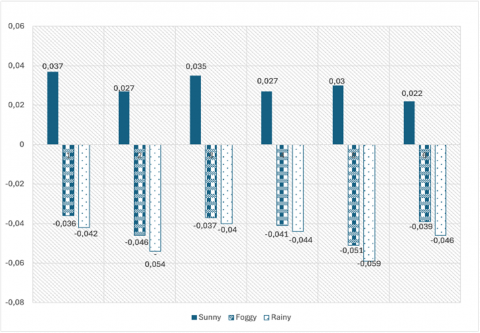
Table 1 and Figure 1 provide a recapitulation of the gradient of the alertness ratio of all participants for 60 minutes. Data acquisition shows that in treatment C, all participants experienced a decreasing graph. Table 2 and Figure 2 show the average gradient of the alertness ratio of all participants every 5 minutes. The purpose of making the graph is to produce a visualization of the alertness ratio data of participants every 5 minutes when undergoing a driving simulation, and to obtain its gradient.
Table 1. Recapitulation of the alertness level ratio gradient
|
Participant |
Sunny |
Foggy |
Rainy |
|
1 |
0.037 |
-0.036 |
-0.042 |
|
2 |
0.027 |
-0.046 |
-0.054 |
|
3 |
0.035 |
-0.037 |
-0.040 |
|
4 |
0.027 |
-0.041 |
-0.044 |
|
5 |
0.030 |
-0.051 |
-0.059 |
|
6 |
0.022 |
-0.039 |
-0.046 |
|
Average |
0.991 |
0.387 |
0.314 |
Figure 1. Ratio gradient graphic
Based on Figure 1, the graph increases in participants who drive in sunny weather, so that the alertness gradient is positive.
Table 2. Average gradient of alertness
|
Minutes |
Sunny |
Foggy |
Rainy |
|
0-5 |
0.314 |
0.775 |
1.788 |
|
5-10 |
0.306 |
0.636 |
1.039 |
|
10-15 |
0.290 |
0.523 |
0.636 |
|
15-20 |
0.279 |
0.506 |
0.761 |
|
20-25 |
0.419 |
0.438 |
0.697 |
|
25-30 |
0.340 |
0.372 |
1.847 |
|
30-35 |
0.412 |
0.368 |
0.715 |
|
35-40 |
0.420 |
0.300 |
0.557 |
|
40-45 |
0.492 |
0.277 |
0.505 |
|
45-50 |
0.454 |
0.292 |
0.771 |
|
50-55 |
0.699 |
0.262 |
0.636 |
|
55-60 |
0.558 |
0.291 |
1.056 |
Figure 2. Average of the ratio every 5 minutes
This shows that during the driving duration, which is 60 minutes, all participants experienced alertness. It should be noted that an increasing graph can be interpreted as being alert. Decreased alertness indicates high alpha and theta wave activity. This second wave is related to a relaxed and less alert state. For foggy and rainy weather, the graph obtained decreases, and the gradient is negative. This indicates high beta wave activity, which indicates a state of alertness and focus. A decreasing graph indicates that alertness is maintained for 60 minutes of driving.
Table 3. Post Hoc test result
|
(I) |
(J) |
Sig. |
95% Confidence Interval |
|
|
Lower Bound |
Upper Bound |
|||
|
Sunny |
Foggy |
0.000 |
0.06186 |
0.08080 |
|
Rainy |
0.000 |
0.06770 |
0.08664 |
|
|
Foggy |
Sunny |
0.000 |
-0.08080 |
-0.06186 |
|
Rainy |
0.276 |
-0.00364 |
0.01530 |
|
|
Rainy |
Sunny |
0.000 |
-0.08664 |
-0.06770 |
|
Foggy |
0.276 |
-0.01530 |
0.00364 |
|
Based on the results of the classical assumption test, the research data is said to pass the classical assumption test, so that the One-way ANOVA test can be carried out. The results of the One-way ANOVA test show a significant difference between treatment groups (sig. < 0.05). Table 3 shows the results of the Post Hoc test for the three treatments.
The results show that there is a significant difference between treatments H and C and K and C; however, there is no significant difference for treatments H and K. Despite limitations of sample size data and simulation condition, the results of this study show that sunny weather has the most influence on the low level of driver alertness. The effect size from ANOVA provides a large effect (η² = 0.96), while the effect size in the Post Hoc test is considered a small effect (C-K = 0.23; C-H = 0.25; K-H = 0.19) [31].
3.2 Driver alertness in sunny weather
Figure 2 shows a comparison graph of the ratio of participants in sunny weather, where the gradient is at 0.0298, and the graph shows an increase during the 60 minutes of simulation. Although the graph has not reached the number 1 during the 60 minutes of simulation, the increase in the existing value indicates the emergence of a lack of awareness. This means that in sunny weather, participant awareness is felt to be lacking. High ratio values are caused by feelings of boredom, familiarity, and discomfort when in the middle of the simulation duration. A large ratio value means that there is high alpha and theta wave activity. These two waves are associated with a relaxed and less alert state. This is in line with research conducted by Gharagozlou et al. [32], which concluded that increasing alpha and theta power at the end of driving indicates a decrease in the level of alertness and attention and the onset of fatigue. The level of alertness is also a monotonous driving condition [33]. It was stated that driving for a long and monotonous period causes a decrease in the level of alertness [34, 35]. Monotony and alertness are interrelated in tasks that require continuous attention. In the context of driving in sunny weather, monotony is the absence of environmental changes (weather). It was said that good weather conditions, namely sunny weather with good visibility, trigger higher driving speeds [13, 36]. Sunny weather with safe visibility will make drivers feel safer and more confident, so they tend to increase driving speed. High driving speed indicates that someone is not alert, where there is a lack of attention to road conditions and the surrounding environment, which causes minimal assessment of driving risks. Steinberger et al. [37] found that repeated conditions on the road, such as familiar surroundings, lack of challenges, and safe traffic, can cause boredom, which triggers a lack of alertness for young drivers. The study also revealed that boredom when driving can arise when feeling uncomfortable and driving for a long time.
3.3 Driver alertness in foggy weather
Figure 2 shows a comparison graph of the participant ratio in foggy weather, where the gradient is at -0.0415, and the graph shows a decrease during the 60 minutes of simulation. The decrease in the graph indicates that there is maintained alertness from the beginning of the simulation to the end of the simulation. The decrease in the graph indicates that in foggy weather, participant alertness increases. In the first 5 minutes, the average ratio of all participants reached a value of around 0.6. This can be caused by the onset of foggy weather. After that, the graph shows a decrease in the ratio value, indicating maintained alertness. This is due to the difference in fog during the simulation. In the first 5 minutes, the fog that fell was not so thick, and visibility was still quite far. However, when the simulation had been running for a long time, the foggy weather began to be clearly visible and was followed by close visibility. A small ratio value means that there is high beta wave activity and indicates a state of alertness and focus. These results are in line with research using a driving simulator conducted by Yan et al. [38], namely, drivers reduce speed to reduce the risk of driving when driving in foggy conditions. Huang et al. [39] said that reducing vehicle speed during fog can meet psychological needs and improve driver reaction abilities. A person's fast reaction time indicates that the person is at a high level of alertness [40].
3.4 Driver alertness in rainy weather
Figure 2 shows a comparison graph of the ratio of participants in rainy weather, where the gradient is at -0.0474, where the graph shows a decrease during the 60 minutes of simulation. The decrease in the graph indicates that there is an alertness that is maintained from the beginning of the simulation to the end of the simulation. The decrease in the graph indicates that in rainy weather, participant alertness is quite high. Compared to foggy weather, the ratio gradient when it rains is lower. In the first 5 minutes, the average ratio of all participants reached a value of around 1.2. When the simulation was running, a decrease in the ratio value also began to occur, where participant alertness had begun to be maintained. This is due to the difference in raindrops that fell during the simulation. In the first 5 minutes, the rain that fell was not so heavy, and visibility was still quite far. However, when the simulation had been running for a long time, the rainy weather began to be clearly visible and was followed by close visibility. A small ratio value means that there is high beta wave activity and indicates a state of alertness and focus. These results are supported by previous study [11], which showed that 8.91% of fast and hasty driving behavior accompanied by violations of driving regulations decreased when it rained. Drivers tend to be reluctant to speed and are more careful. Ahmed and Ghasemzadeh [12] stated that drivers reduce speed to compensate for the negative impact of rain on the driving task. The change in behavior, namely reducing vehicle speed, indicates that drivers tend to be more careful, concentrated, and alert [36]. The thing that can increase participants' alertness naturally when it rains is the sound of falling rain. Proverbio et al. [41] said that high-tempo music or rain can increase brain arousal and alertness levels. The sound of raindrops can have a positive effect on driver alertness by providing a natural reminder of slippery road conditions and possible hazards.
3.5 The influence of weather on alertness levels
Several things were found to provide significant differences between treatment groups. In sunny weather, participants can clearly see the condition of urban roads, and visibility can be said to be safe. According to previous studies [42, 43], visibility is useful for avoiding collisions, increasing road efficiency, and giving other vehicles the opportunity to overtake. This makes participants tend to feel safe while driving, which can lead to a lack of alertness because there is a perception that road and weather conditions support safe travel. Some participants tend to ignore speed and concentrate less on sunny weather, increasing the risk of accidents.
In foggy weather, participants' views will be disturbed by short visibility. As a result, traffic conditions from vehicles and people passing by cannot be seen clearly. Short visibility makes the road situation feel less safe for driving. Participants tend to reduce driving speed because they have difficulty seeing uncertain road situations. Foggy weather often requires a reduction in speed to improve reaction and reduce the risk of accidents. Chen et al. [10] said that the presence of fog causes a significant decrease in visibility, triggering a decrease in vehicle speed. In addition, drivers tend to be more alert when the fog starts to descend. Compared with crashes under clear weather conditions, car crashes in fog may involve multiple cars and tend to result in more serious injuries [44, 45].
In rainy weather, participants' views will be disturbed by rainwater falling on the front of the car window. In this study, rainy weather in the City Car Driving software displays rainy weather that is drizzling or not heavy. This results in visibility that is not too close. Participants can still see the road conditions clearly but are slightly disturbed by the rainwater. Rain can make road conditions slippery, and participants feel unsafe or worried about limited vision. The level of participant awareness when driving in rainy weather must be increased because it requires more concentration to drive [46]. Ni et al. [47] said that when it rains, drivers tend to reduce their speed because visibility and roads are slippery.
So basically, foggy and rainy weather indeed can lead to a higher risk of accident [48]. However, these situations encourage the drivers to reduce the speed [26, 27, 30] to meet the psychological needs, improve driver reaction abilities, and compensate for the negative impact of bad weather on the driving task. The change in behavior, namely reducing vehicle speed, indicates that drivers tend to be more careful, concentrated, and alert [24].
3.6 Root cause analysis
Despite the limitations of sample size data and virtual condition, the results of this study show that sunny weather has the most influence on the low level of driver alertness. The first basic root cause comes from the people factor, namely, the absence of distractions while driving on monotonous roads. Driving on monotonous roads can trigger feelings of fatigue and boredom [25]. Arya et al. [49] concluded that the driver's level of alertness is better when driving while listening to music. Listening to music is good to do when driving on monotonous roads so as not to cause boredom. Furthermore, the study also said that listening to music while carrying out tasks at the same time can affect a person's cognitive load. There is a maximum increase in brain performance when carrying passengers compared to not carrying passengers [50]. The second basic root cause comes from the measurement factor, namely, the lack of awareness of possible threats. In this context, the subject in question is the authorities or law enforcement officers. Lack of monitoring of road conditions when the weather is sunny can be caused by two factors, namely, limited resources and wrong priorities. In addition to the authorities, drivers should also be aware of the dangers. Muryatma [51] stated that knowledge and application of safety driving can reduce the number of accidents because drivers are aware of the threats on the road.
The third basic root cause comes from people factors, namely fatigue and certain medical conditions. Fatigue can affect driving safety [52]. In everyday life, sometimes other people are not aware of the dangers of driving and tend to ignore the safety of others. When other people are not careful, our focus and concentration will certainly be disturbed and can endanger ourselves. Driver fatigue while driving is one of the factors that causes traffic accidents because it reduces a person's level of alertness when driving [53].
The fourth basic root cause comes from people factors, namely, law enforcement that is not running well, especially on the highway. Integrity in law enforcement can encourage people to be cooperative and obedient. Therefore, this can reduce the level of law violations and encourage good behavior [54]. In the case of driving, bad habits include a lack of awareness of safe driving, including controlling driving speed.
The fifth basic root cause comes from the machine factor, namely, vehicle components that have reached their service life. Vehicle drive components that have reached their service life certainly cannot work optimally and can reduce the vehicle's controllability. Damage to this component certainly affects alertness, namely if the driver feels the vehicle is unstable, a lack of confidence will arise. In addition, when there is a technical problem in the vehicle, the driver will easily feel anxious. Of course, this can interfere with concentration and reduce the level of alertness when driving.
3.7 Implication and recommendation
The recommendations for improvement focused on knowledge of safe driving, such as the importance of avoiding distractions while driving and routine vehicle maintenance. In addition, recommendations were also given to overcome fatigue and implement a healthy lifestyle. The provision of these recommendations is based on the results of the analysis that is directly aimed at the basic root cause. Efforts that can be made include encouraging drivers to drive while listening to music or inviting passengers to maintain the level of driver alertness. In addition, law enforcement on the highway must be increased so that the public becomes deterred. The use of Rumble Strips has also proven effective in increasing alertness and reducing driving speed. The most important thing is to maintain body health with a healthy lifestyle to overcome fatigue. The above efforts can be started individually and can be supported by various parties such as the government, private institutions, and community institutions.
A relevant recommendation of policymakers is to incorporate traffic and weather factors into driver education campaigns. These campaigns should emphasize the importance of adjusting driving behavior based on different condition of weather such as related to speed adjustment, and driving practices to reduce accident risk. The education about these weather considerations is expected to improve driving safety and lead to more adaptive driving behaviors in various conditions.
This study aims to determine whether there is an effect of weather on the level of driver alertness. The findings of this study were gained from experiments using a driving simulator, that valuable for controlled experimentation but has limitations to capture the real-world driving scenarios, such as describing the complexity and unpredictability of actual driving conditions. Some variables related to this condition are the interaction of the drivers with passengers or other drivers, the geometrical road, and other distractions. This explanation means that experimental simulation in a short time may not fully capture the effect of long-term driving in real-world conditions.
Based on the results of the study on the small size of the male participant and the simulation environment, it was found that there is a significant effect between weather and driver alertness, namely sunny weather, because the graph shows a decrease over 60 minutes of simulation. The most significantly different treatment was obtained in sunny-rain conditions and sunny-fog conditions. From these results, it can be concluded that the riskiest condition for low driver alertness is sunny weather conditions.
The practical implications of this finding lead to safety behavior of the driver during sunny weather by listening to music, paying more attention to the traffic situation, and inviting passengers to maintain alertness. Besides, the policymaker can consider some programs such as the design of rumble strips to reduce driving speed and to increase drivers’ alertness, as well as an education campaign for drivers related to the traffic and weather conditions.
This work is supported by LPPM Diponegoro University in the Professorship Research scheme (No. 610/UN7.D2/HK/III/2025, 18 March 2025).
[1] Central Statistics Agency of Indonesia. (2023). Development of the number of motor vehicles by type (Unit), 2019-2021. bps.go.id. https://www.bps.go.id/indicator/17/57/1/jumlah-kendaraan-bermotor.html.
[2] Khairina, R.L., Erwandi, D. (2022). Gambaran faktor kegagalan laten dan kegagalan aktif pada kecelakaan transportasi darat di Indonesia tahun 2019–2021. National Journal of Occupational Health and Safety, 3(2): 99-106. https://doi.org/10.59230/njohs.v3i2.6298
[3] Hobbs, F.D. (1979). Traffic Planning and Engineering. Pergamon Press, New York.
[4] Nasution, M.N. (2022). Analysis of accident factors and efforts to improve safety on the sultan Serdang-KNO KM 10-11.4 road section. Politeknik Transportasi Darat Indonesia. https://digilib.ptdisttd.ac.id/1487/1/ANALISIS%20FAKTOR%20KECELAKAAN%20SERTA%20UPAYA%20PENINGKATAN%20KESELAMATAN%20JALAN%20SULTAN%20SERDANG%20-%20KNO%20KM%2010%20-%2011%2C4.pdf.
[5] Oktegianda, A.V., Kurniawan, B., Suroto. (2019). Analysis of human and environmental factors in traffic accidents. Jurnal Kesehatan Masyarakat, 7(4): 74-82. https://ejournal3.undip.ac.id/index.php/jkm/article/view/24306/22017.
[6] Sarinsa. (2019). Overview of traffic accident characteristics in Gowa Regency 2015-2018. Universitas Islam Negeri Alauddin. https://repositori.uin-alauddin.ac.id/16524/1/SARSINA_70200115031.pdf.
[7] Evans, L. (2003). Transportation safety. In Handbook of Transportation Science. Springer, Boston, MA. https://doi.org/10.1007/0-306-48058-1_4
[8] Sutalaksana, I.Z., Mahacandra, M. (2012). Secondary audio activities for maintaining the alertness of Indonesian car drivers. Jurnal Teknik Industri, 7(3): 185-190. https://doi.org/10.12777/jati.7.3.185-190
[9] Zou, Y., Zhang, Y., Cheng, K. (2021). Exploring the impact of climate and extreme weather on fatal traffic accidents. Sustainability, 13(1): 390. https://doi.org/10.3390/su13010390
[10] Chen, J., Wang, S., He, E., Wang, H., Wang, L. (2023). The architecture of functional brain network modulated by driving during adverse weather conditions. Cognitive Neurodynamics, 17(2): 547-553. https://doi.org/10.1007/s11571-022-09825-y
[11] Bakhshi, V., Aghabayk, K., Parishad, N., Shiwakoti, N. (2022). Evaluating rainy weather effects on driving behaviour dimensions of driving behaviour questionnaire. Journal of Advanced Transportation, 2022(1): 6000715. https://doi.org/10.1155/2022/6000715
[12] Ahmed, M.M., Ghasemzadeh, A. (2018). The impacts of heavy rain on speed and headway behaviors: An investigation using the SHRP2 naturalistic driving study data. Transportation Research Part C: Emerging Technologies, 91: 371-384. https://doi.org/10.1016/j.trc.2018.04.012
[13] Alruwaili, A., Xie, K. (2024). Modeling the influence of connected vehicles on driving behaviors and safety outcomes in highway crash scenarios across varied weather conditions: A multigroup structural equation modeling analysis using a driving simulator experiment. Accident Analysis & Prevention, 199: 107514. https://doi.org/10.1016/j.aap.2024.107514
[14] Li, X., Oviedo-Trespalacios, O., Rakotonirainy, A., Yan, X. (2019). Collision risk management of cognitively distracted drivers in a car-following situation. Transportation Research Part F: Traffic Psychology and Behaviour, 60: 288-298. https://doi.org/10.1016/j.trf.2018.10.011
[15] Siregar, G.S., Rahayu, Y. (2019). Electroencephalogram (EEG)-based brain wave detection system in case studies of children with autism. Jom Fteknik, 6(2). https://jom.unri.ac.id/index.php/JOMFTEKNIK/article/view/26340.
[16] Yu, M., Gouw, A.A., Hillebrand, A., Tijms, B.M., et al. (2016). Different functional connectivity and network topology in behavioral variant of frontotemporal dementia and Alzheimer's disease: An EEG study. Neurobiology of Aging, 42: 150-162. https://doi.org/10.1016/j.neurobiolaging.2016.03.018
[17] Ahmadlou, M., Adeli, H. (2011). Functional community analysis of brain: A new approach for EEG-based investigation of the brain pathology. Neuroimage, 58(2): 401-408. https://doi.org/10.1016/j.neuroimage.2011.04.070
[18] Razavipour, F., Boostani, R., Kouchaki, S., Afrasiabi, S. (2014). Comparative application of non-negative decomposition methods in classifying fatigue and non-fatigue states. Arabian Journal for Science and Engineering, 39(10): 7049-7058. https://doi.org/10.1007/s13369-014-1242-0
[19] Lin, Z., Qiu, T., Liu, P., Zhang, L., et al. (2021). Fatigue driving recognition based on deep learning and graph neural network. Biomedical Signal Processing and Control, 68: 102598. https://doi.org/10.1016/j.bspc.2021.102598
[20] Min, J., Xiong, C., Zhang, Y., Cai, M. (2021). Driver fatigue detection based on prefrontal EEG using multi-entropy measures and hybrid model. Biomedical Signal Processing and Control, 69: 102857. https://doi.org/10.1016/j.bspc.2021.102857
[21] Jing, D., Liu, D., Zhang, S., Guo, Z. (2020). Fatigue driving detection method based on EEG analysis in low-voltage and hypoxia plateau environment. International Journal of Transportation Science and Technology, 9(4): 366-376. https://doi.org/10.1016/j.ijtst.2020.03.008
[22] Wang, L., Wang, H., Jiang, X. (2017). A new method to detect driver fatigue based on EMG and ECG collected by portable non-contact sensors. Promet-Traffic&Transportation, 29(5): 479-488. https://doi.org/10.7307/ptt.v29i5.2244
[23] Fu, R., Wang, S., Wang, S. (2017). Real-time alarm monitoring system for detecting driver fatigue in wireless areas. Promet-Traffic & Transportation, 29(2): 165-174. https://doi.org/10.7307/ptt.v29i2.2058
[24] Sugiyono. (2013). Quantitative, Qualitative, Research and Development Method. (19 ed.). Alfabeta. https://digi-lib.stekom.ac.id/assets/dokumen/ebook/feb_35efe6a47227d6031a75569c2f3f39d44fe2db43_1652079047.pdf.
[25] Setiawan, J. (2017). Determining rest duration for drivers experiencing prolonged wakefulness and driving on monotonous road conditions. Journal of Parahyangan Catholic University, 24(2). https://repository.unpar.ac.id/handle/123456789/1012.
[26] Yannis, G., Laiou, A., Papantoniou, P., Christoforou, C. (2014). Impact of texting on young drivers' behavior and safety on urban and rural roads through a simulation experiment. Journal of Safety Research, 49: 25.e1-31. https://doi.org/10.1016/j.jsr.2014.02.008
[27] Burgess, P.W., Simons, J.S. (2005). Theories of frontal lobe executive function: Clinical applications. Effectiveness of Rehabilitation for Cognitive Deficits, Oxford, UK: Oxford University Press, 2: 211-232.
[28] Mahachandra, M., Munzayanah, S., Yassierli. (2017). The efficacy of one-time and intermittent intake of coffee as a countermeasure to sleepiness on partially sleep-deprived drivers. International Journal of Technology, 8(2): 300-310. https://ijtech.eng.ui.ac.id/article/view/197.
[29] Williams, N.S., McArthur, G.M., Badcock, N.A. (2021). It’s all about time: Precision and accuracy of Emotiv event-marking for ERP research. PeerJ, 9: e10700. https://doi.org/10.7717/peerj.10700
[30] Jap, B.T., Lal, S., Fischer, P., Bekiaris, E. (2009). Using EEG spectral components to assess algorithms for detecting fatigue. Expert Systems with Applications, 36(2): 2352-2359. https://doi.org/10.1016/j.eswa.2007.12.043
[31] Cohen, J. (1988). Statistical power Analysis for the Behavioral Sciences (2nd ed.). Lawrence Erlbaum Associates Publishers, Hillsdale, New Jersey, USA.
[32] Gharagozlou, F., Saraji, G.N., Mazloumi, A., Nahvi, A., et al. (2015). Detecting driver mental fatigue based on EEG alpha power changes during simulated driving. Iranian Journal of Public Health, 44(12): 1693-1700. https://pmc.ncbi.nlm.nih.gov/articles/PMC4724743/.
[33] Desai, A.V., Haque, M.A. (2006). Vigilance monitoring for operator safety: A simulation study on highway driving. Journal of Safety Research, 37(2): 139-147. https://doi.org/10.1016/j.jsr.2005.11.003
[34] Liu, N.H., Chiang, C.Y., Hsu, H.M. (2013). Improving driver alertness through music selection using a mobile EEG to detect brainwaves. Sensors, 13(7): 8199-8221. https://doi.org/10.3390/s130708199
[35] Sampurno, E. (2020). A preliminary study of detecting decreased alertness based on facial and behavioral recognition: A study in a train simulator. Jurnal Universitas Katolik Parahyangan, 21(7). https://repository.unpar.ac.id/handle/123456789/12396.
[36] Chmielewski, J., Budzynski, M. (2019). The impact of weather on traffic speed in urban area. IOP Conference Series: Materials Science and Engineering, 603(2): 022072. https://doi.org/10.1088/1757-899X/603/2/022072
[37] Steinberger, F., Moeller, A., Schroeter, R. (2016). The antecedents, experience, and coping strategies of driver boredom in young adult males. Journal of Safety Research, 59: 69-82. https://doi.org/10.1016/j.jsr.2016.10.007
[38] Yan, X., Li, X., Liu, Y., Zhao, J. (2014). Effects of foggy conditions on drivers’ speed control behaviors at different risk levels. Safety Science, 68: 275-287. https://doi.org/10.1016/j.ssci.2014.04.013
[39] Huang, Y., Yan, X., Li, X., Yang, J. (2020). Using a multi-user driving simulator system to explore the patterns of vehicle fleet rear-end collisions occurrence under different foggy conditions and speed limits. Transportation Research Part F: Traffic Psychology and Behaviour, 74: 161-172. https://doi.org/10.1016/j.trf.2020.08.025
[40] Zaharinova, M. (2022). Evaluation of the level of alertness with variations in reaction time in Bulgarian sport students. International Journal Bioautomation, 26(2): 153-160. https://doi.org/10.7546/ijba.2022.26.2.000859
[41] Proverbio, A.M., De Benedetto, F., Ferrari, M.V., Ferrarini, G. (2018). When listening to rain sounds boosts arithmetic ability. PLoS One, 13(2): e0192296. https://doi.org/10.1371/journal.pone.0192296
[42] Raharjo, N.D. (2022). Basics of geometric planning of highways. Cerdas Ulet Kreatif, Jember. https://www.cerdas.co.id/wp-content/uploads/2022/08/Dasar-Perencanaan-Geometrik-Jalan-Raya-Nain-Dhaniarti-Raharjo.pdf.
[43] Hadi, M.A., Mukti, F.A., Tolab, L.Z., Hanifardhi, Kurniawan, D., Saptanto, R., Winarni. (2023). Identifying the importance of recognizing the role of the civil engineering academic civility in reducing vehicle accident rate. Proceeding Civil Engineering Research Forum, 2(2): 348-356. https://dspace.uii.ac.id/bitstream/handle/123456789/56268/Proceeding%20The%204th%20CeReform%20Final-358-366.pdf.
[44] Abdel-Aty, M., Ekram, A.A., Huang, H., Choi, K. (2011). A study on crashes related to visibility obstruction due to fog and smoke. Accident Analysis & Prevention, 43(5): 1730-1737. https://doi.org/10.1016/j.aap.2011.04.003
[45] Wanvik, P.O. (2009). Effects of road lighting on motorways. Traffic Injury Prevention, 10(3): 279-289. https://doi.org/10.1080/15389580902826866
[46] Jecson, P., Doda, D.V.D., Pinontoan, O.R. (2020). Analysis of road and weather conditions related to work accidents among motorcycle taxi drivers in Bitung city. Journal of Public Health and Community Medicine, 1(3). https://ejournal.unsrat.ac.id/v2/index.php/ijphcm/article/view/29632/28699.
[47] Ni, X., Huang, H., Li, R., Chen, A., et al. (2022). Synergistic influence of rainstorm and waterlogging on drivers’ driving behavior-an experimental study based on high-fidelity driving simulator. Sustainability, 14(14): 8517. https://doi.org/10.3390/su14148517
[48] Jiang, Y., Qin, Y., Zhu, L., Li, G., Wang, H. (2025). Reduction strategy of rear-end collision risks for connected and automated vehicles on freeways with different weather conditions. Physica A: Statistical Mechanics and its Applications, 674: 130761. https://doi.org/10.1016/j.physa.2025.130761
[49] Arya, A.W., Wahyuning, C.S., Desrianty, A. (2014). Analysis of the influence of music tempo and genre on the alertness of private car drivers. Jurnal Teknik Industri Itenas, 2(3): 245-256. https://ejurnal.itenas.ac.id/index.php/rekaintegra/article/view/556.
[50] Pertiwi, O.R. (2019). Analysis of passenger influence on performance using driving simulator. Jurnal Universitas Islam Indonesia, 23(3). https://dspace.uii.ac.id/handle/123456789/18033.
[51] Muryatma, M.N. (2017). The relationship between driving safety factors and driving safety behavior. Jurnal Promkes, 5(2): 155-166. https://doi.org/10.20473/jpk.V5.I2.2017.155-166
[52] McDonald, N., Åkerstedt, T., Garo, C., Hamelin, P., van Ouwerkerk, F. (2014). The role of driver fatigue in commercial road transport crashes. The European Safety Council. https://etsc.eu/wp-content/uploads/The-role-of-driver-fatigue-in-commercial-road-transport-crashes.pdf.
[53] Williamson, A., Lombardi, D.A., Folkard, S., Stutts, J., et al. (2014). The link between fatigue and safety. Accident Analysis and Prevention, 43(2): 498-515. https://doi.org/10.1016/j.aap.2009.11.011
[54] Riswan, M. (2023). The law enforcement dilemma: The important role of law enforcement in achieving justice. Jurnal Universitas Ahmad Dahlan, 32(1). https://law.uad.ac.id/dilema-penegak-hukum-peran-penting-penegakan-hukum-untuk-mewujudkan-keadilan/.