Uswatul Hasanah*![]() | Venny Veronica Natalia
| Venny Veronica Natalia![]() | Andi Sitti Chairunnisa
| Andi Sitti Chairunnisa![]()
© 2025 The authors. This article is published by IIETA and is licensed under the CC BY 4.0 license (http://creativecommons.org/licenses/by/4.0/).
OPEN ACCESS
River-crossing services are vital to urban mobility along the Jeneberang River, South Sulawesi, yet operations remain informal and rely on traditional boats, raising safety, efficiency, and sustainability concerns. This study evaluates service quality and proposes strategies for sustainable improvement. A quantitative survey of 100 users was analyzed using the customer satisfaction index (CSI), importance-performance analysis (IPA), and SWOT. The CSI was 74.23%, indicating general satisfaction; IPA highlighted shortfalls in safety, service information, and pier/access-road infrastructure; and SWOT located the service in Quadrant I (growth-oriented), suggesting scope to leverage strengths while addressing operational weaknesses. We recommend mandatory lifejackets and guard rails, loading controls, targeted pier and access-road upgrades, and low-cost information systems (posted routes/fares/schedules and a hotline/WhatsApp feedback channel), implemented with community participation and aligned with sustainable transport policy. The study adds empirical evidence from an informal river-ferry context and demonstrates how the CSI–IPA–SWOT toolchain can translate user diagnostics into feasible, time-bound actions, supporting a transition toward safer and more sustainable urban mobility in secondary cities.
customer satisfaction index, importance-performance analysis, informal ferry services, Jeneberang River crossing, service quality evaluation, sustainable transportation, SWOT analysis
Urban mobility in many riverine cities relies on small-scale crossings that are often operated informally with minimal regulation and safety oversight. These services provide essential access and time savings, yet they also raise concerns about safety, service quality, and long-term sustainability—recurring themes in the literature on informal transport and ferry safety, as well as in indicator-based approaches to sustainable transport planning. As stated in the study [1], informal transport plays a crucial role in urban mobility in developing countries. This study responds to those concerns in the context of the Jeneberang River, South Sulawesi, Indonesia, where crossings are conducted using traditional boats and basic pier infrastructure.
Research on public transport service quality is well established. As highlighted by de Oña and de Oña [2], quality-of-service studies based on customer satisfaction surveys have grown substantially in recent decades. Foundational constructs (e.g., SERVQUAL) and diagnostic tools such as importance-performance analysis (IPA) are frequently applied to buses and formal transit systems. Previous studies [2, 3] have extensively evaluated customer satisfaction in bus and rail contexts using the customer satisfaction index (CSI) and IPA yet applications to informal river ferry systems remain scarce. Few studies quantitatively assess user satisfaction for community-operated crossings, prioritize attributes for improvement, and translate diagnostics into implementable strategies consistent with sustainability principles. Addressing this gap has practical significance for secondary cities where informal services bridge critical access needs.
The Jeneberang River case features six short crossing routes along a ~9 km corridor between the Barombong Bridge and the Gowa Twin Bridges. Services are community-operated, primarily carrying passengers and motorcycles on traditional boats with limited safety equipment and information systems. Users report substantial travel-time savings relative to congested road alternatives, but persistent issues around safety, pier/road access, and service information indicate the need for structured evaluation and prioritized upgrades. Previous work on the Jeneberang corridor has analysed crossing demand and fleet requirements, but not user satisfaction [4].
Conceptual framework. We followed a service-quality → diagnosis → strategy pathway. Following Parasuraman et al. [5], attributes were specified from SERVQUAL constructs and adapted to a river-ferry context. Overall satisfaction was summarized with the CSI; attribute priorities were diagnosed via IPA as originally proposed by Martilla and James [6], and findings were translated into strategies with SWOT/TOWS.
Sample and data collection. The population comprised adult users of six Jeneberang River routes. Using Cochran’s formula at 95% confidence with a conservative variance (p = 0.5) and error margin e = 0.10 yielded n ≈ 96; we surveyed n = 100 to meet this target. Sampling was proportional by route using short traffic counts, then systematic intercept (random start, every kth user) across weekday/weekend peaks. A pilot (n = 30) informed item refinement; reliability exceeded α ≥ 0.70.
Measures and analysis. Importance and performance were rated on 5-point scales. CSI used the weight factor (WF) from mean importance and a weighted satisfaction index (scaled 0–100%). IPA plotted (performance, importance) with grand means as cross-hairs; we also report GAP = Importance−Performance and a conformity index.
SWOT procedure. S/W/O/T factors were triangulated from field observation, open-ended user feedback, and brief stakeholder interviews. A 5-member panel assigned weights (0–1, sum = 1 per quadrant) and ratings (1–5); composite scores (w × r).
(w × r) guided quadrant positioning and TOWS strategy selection. Disagreements were resolved by brief consensus discussion.
2.1 Study area and operation
The study area is a ~9 km corridor of the Jeneberang River between the Barombong Bridge and the Gowa Twin Bridges (South Sulawesi, Indonesia), where six short ferry routes operate with paired piers on opposite banks as shown in Figure 1. Crossings typically span ~200 m and ~5 minutes per trip, using community-operated traditional boats that carry passengers and motorcycles. Data were collected during February–April 2024, covering weekdays/weekends and peak periods on all six routes. Utomo and Mateo-Babiano [7], stated that in many Asian river-based cities, inland waterway transport and river ferries function as everyday commuting modes that complement land-based transport, especially for lower-income communities.
Figure 1. Study area
Location 1: Taeng – Dg Kanu Motor Crossing. Located in Pandang Pandang, Kec. Somba Opu, Kab, Gowa crossing to Taeng, Kec. Pallangga, Gowa Regency. The fleet of ships operating at this point is the largest, with six ships.
Location 2: Boat Crossing III – Daeng Pari. Located in Mangasa, District. Tamalate, Makassar City, crossing to Taeng, District. Pallangga, Gowa Regency, five ships are operating at this crossing.
Location 3: Pier II Daeng Tata – Boat Crossing IV. This pier is located in Parang Tambung, Kec. Tamalate, Makassar City, crossing to Taeng, District. Pallangga, Gowa Regency. There are two ships operating.
Location 4: SP 9 Boat Crossing – Daeng Tata Orange Pier. Located in Taeng, Kec. Pallangga, Gowa Regency, crossing to Parang Tambung, District. Tamalate, Makassar City. Only two ships are operating at this point.
Location 5: Daeng Tata Tamanyeleng Crossing – Rika Crossing. This point is located next to the garbage dump, Jl. Daeng Tata Raya, Parang Tambung, Dist. Tamalate, Makassar City, cross to Jl. Bontocinde, Bontosunggu, Dist. Barombong, Gowa Regency. There is only one vessel operating at this point.
Location 6: Taborong Crossing Pier - Bunga Embankment. This point is located in Pandang Pandang, Kec. Somba Opu, Gowa Regency, cross to Jl. Pelita Lambengi, Bontoala, District. Pallangga, Gowa Regency. There is only one ship operating at this point.
2.2 Operational flow
Operations follow a short shuttle pattern with paired piers; boarding, fare payment, and disembarkation occur at basic riverine landings designed for passengers and motorcycles.
2.3 Importance-performance analysis
IPA was interpreted following standard practice: Quadrant I (high-importance/low-performance) indicates immediate priorities; Quadrant II maintain; Quadrant III low-priority; Quadrant IV possible over-serving. Case-specific implications are reported in Results.
3.1 Validation test
Before distributing the questionnaire, testing is first carried out on the questions that will be included in the questionnaire. In the validity test, two provisions determine whether the question used is valid, namely the r table value and the significance value. In the test, 28 respondents were used. With the r table provisions for 28 people of 0.3610. A question is declared valid if r count > r table. For a significant value, the significant value must be < 0.05 for the question to be declared valid. in line with previous studies that use Pearson product–moment correlation for item validity testing [8]). The critical values for the Pearson product–moment correlation coefficient (r-table) were determined using standard statistical tables [9] and follow conventional treatments of correlation analysis in applied statistics texts [10, 11]. After testing the data, the above results were obtained.
From Tables 1 and 2, the data generated from the questions is in accordance with the previously established provisions, namely, calculated R > R table and significant value < 0.05. So that the validity test results state that all questions are "valid”.
Table 1. Results of the validity test of importance values
|
Attribute |
R Count |
R Table |
Significant Test Results |
Significant Value |
Test Results |
|
1 |
0.571 |
0.3610 |
0.001 |
0.05 |
Valid |
|
2 |
0.639 |
0.3610 |
0.001 |
0.05 |
Valid |
|
3 |
0.660 |
0.3610 |
0.001 |
0.05 |
Valid |
|
4 |
0.598 |
0.3610 |
0.001 |
0.05 |
Valid |
|
5 |
0.584 |
0.3610 |
0.001 |
0.05 |
Valid |
|
6 |
0.609 |
0.3610 |
0.001 |
0.05 |
Valid |
|
7 |
0.614 |
0.3610 |
0.001 |
0.05 |
Valid |
|
8 |
0.600 |
0.3610 |
0.001 |
0.05 |
Valid |
|
9 |
0.644 |
0.3610 |
0.001 |
0.05 |
Valid |
|
10 |
0.688 |
0.3610 |
0.001 |
0.05 |
Valid |
|
11 |
0.555 |
0.3610 |
0.001 |
0.05 |
Valid |
|
12 |
0.695 |
0.3610 |
0.001 |
0.05 |
Valid |
|
13 |
0.733 |
0.3610 |
0.001 |
0.05 |
Valid |
|
14 |
0.513 |
0.3610 |
0.004 |
0.05 |
Valid |
|
15 |
0.664 |
0.3610 |
0.001 |
0.05 |
Valid |
|
16 |
0.671 |
0.3610 |
0.001 |
0.05 |
Valid |
|
17 |
0.663 |
0.3610 |
0.001 |
0.05 |
Valid |
Table 2. Results of the validity test of satisfaction values
|
Attribute |
R Count |
R Table |
Significant Test Results |
Significant Value |
Test Results |
|
1 |
0.571 |
0.3610 |
0.001 |
0.05 |
Valid |
|
2 |
0.639 |
0.3610 |
0.001 |
0.05 |
Valid |
|
3 |
0.660 |
0.3610 |
0.001 |
0.05 |
Valid |
|
4 |
0.598 |
0.3610 |
0.001 |
0.05 |
Valid |
|
5 |
0.584 |
0.3610 |
0.001 |
0.05 |
Valid |
|
6 |
0.609 |
0.3610 |
0.001 |
0.05 |
Valid |
|
7 |
0.614 |
0.3610 |
0.001 |
0.05 |
Valid |
|
8 |
0.534 |
0.3610 |
0.002 |
0.05 |
Valid |
|
9 |
0.644 |
0.3610 |
0.001 |
0.05 |
Valid |
|
10 |
0.688 |
0.3610 |
0.001 |
0.05 |
Valid |
|
11 |
0.555 |
0.3610 |
0.001 |
0.05 |
Valid |
|
12 |
0.695 |
0.3610 |
0.001 |
0.05 |
Valid |
|
13 |
0.733 |
0.3610 |
0.001 |
0.05 |
Valid |
|
14 |
0.513 |
0.3610 |
0.004 |
0.05 |
Valid |
|
15 |
0.664 |
0.3610 |
0.001 |
0.05 |
Valid |
|
16 |
0.671 |
0.3610 |
0.001 |
0.05 |
Valid |
|
17 |
0.507 |
0.3610 |
0.004 |
0.05 |
Valid |
3.2 Reliability test
In the reliability test, the condition used to determine whether a question is reliable or not is that Cronbach's alpha value must be > 0.70. Reliability test results are as showed in Tables 3 and 4.
Table 3. Results of the reliability test of importance values
|
Reliability Statistics |
||||
|
Cronbach's Alpha |
N of Items |
|||
|
0.898 |
17 |
|||
|
Case Processing Summary |
||||
|
|
N |
% |
||
|
Cases |
Valid |
30 |
100.0 |
|
|
Excludeda |
0 |
0.0 |
||
|
Total |
30 |
100.0 |
||
|
a. Listwise deletion based on all variables in the procedure. |
||||
From Tables 3 and 4 of the reliability tests, Cronbach's alpha value generated for the importance value is 0.898, and for the performance value, it is 0.808. The question attribute is declared reliable if the resulting Cronbach's alpha value is > 0.70 [12]. So, the reliability test results of the importance and performance values are declared reliable.
Table 4. Results of performance value reliability tests
|
Reliability Statistics |
||||
|
Cronbach's Alpha |
N of Items |
|||
|
0.808 |
17 |
|||
|
Case Processing Summary |
||||
|
|
N |
% |
||
|
Cases |
Valid |
30 |
100.0 |
|
|
Excludeda |
0 |
0.0 |
||
|
Total |
30 |
100.0 |
||
|
a. Listwise deletion based on all variables in the procedure. |
||||
3.3 Customer satisfaction index
CSI is an index used to evaluate customer satisfaction with service products and is widely applied in service quality assessments [13]. The data collection process to measure customer satisfaction uses a questionnaire. With questions that have been tested previously and data obtained through distributing questionnaires to 100 respondents will be processed.
3.4 Look for the mean importance score and mean satisfaction score values
Mean importance score (MIS) is the average value of importance values, while mean satisfaction score (MSS) is the average value of performance values. The summary of the MIS and MSS calculations is presented in Table 5. They are calculated as follows:
$\begin{aligned} M I S & =\frac{\sum_{i=1}^n Y_i}{n}=\frac{6893}{100}=68.9 \\ M S S & =\frac{\sum_{i=1}^n X_i}{n}=\frac{6711}{100}=67.11\end{aligned}$
Table 5. Recapitulation of the calculation of the total importance score and performance score to obtain the MIS and MSS scores
|
Attribute |
Total Importance Score |
MIS |
Total Performance Score |
MSS |
|
1 |
407 |
4.07 |
414 |
4.14 |
|
2 |
409 |
4.09 |
408 |
4.08 |
|
3 |
404 |
4.04 |
395 |
3.95 |
|
4 |
399 |
3.99 |
404 |
4.04 |
|
5 |
420 |
4.2 |
414 |
4.14 |
|
6 |
394 |
3.94 |
389 |
3.89 |
|
7 |
406 |
4.06 |
392 |
3.92 |
|
8 |
430 |
4.3 |
428 |
4.28 |
|
9 |
420 |
4.2 |
404 |
4.04 |
|
10 |
367 |
3.67 |
362 |
3.62 |
|
11 |
406 |
4.06 |
364 |
3.64 |
|
12 |
398 |
3.98 |
382 |
3.82 |
|
13 |
392 |
3.92 |
373 |
3.73 |
|
14 |
391 |
3.91 |
366 |
3.66 |
|
15 |
432 |
4.32 |
429 |
4.29 |
|
16 |
413 |
4.13 |
396 |
3.96 |
|
17 |
405 |
4.05 |
391 |
3.91 |
|
Total |
6890 |
68.9 |
6711 |
67.11 |
3.5 Finding the weight factor
Weight factor (WF) is a percentage of value MIS of each attribute to the total value MIS all attributes, The summary of WF calculations is presented in Table 6, which are obtained by the formula:
$\begin{gathered}W F=\frac{M I S_i}{\sum M I S} \times 100 \\ W F=\frac{4.07}{68.9} \times 100 \\ W F=5.91\end{gathered}$
Table 6. Recapitulation of WF calculations
|
Attribute |
$MIS_i$ |
WF% |
|
1 |
4.07 |
5.91 |
|
2 |
4.09 |
5.94 |
|
3 |
4.04 |
5.86 |
|
4 |
3.99 |
5.79 |
|
5 |
4.2 |
6.10 |
|
6 |
3.94 |
5.72 |
|
7 |
4.06 |
5.89 |
|
8 |
4.3 |
6.24 |
|
9 |
4.2 |
6.10 |
|
10 |
3.67 |
5.33 |
|
11 |
4.06 |
5.89 |
|
12 |
3.98 |
5.78 |
|
13 |
3.92 |
5.69 |
|
14 |
3.91 |
5.67 |
|
15 |
4.32 |
6.27 |
|
16 |
4.13 |
5.99 |
|
17 |
4.05 |
5.88 |
3.6 Looking for weight score
Weight score (WS) is the product of WF with MSS. The summary of WS calculations is presented in Table 7, obtained by the formula:
WS = MSS × WF
Table 7. Summary of WS calculation
|
Attribute |
MSS |
WF% |
WS |
|
1 |
4.14 |
5.91 |
24.46 |
|
2 |
4.08 |
5.94 |
24.22 |
|
3 |
3.95 |
5.86 |
23.16 |
|
4 |
4.04 |
5.79 |
23.40 |
|
5 |
4.14 |
6.10 |
25.24 |
|
6 |
3.89 |
5.72 |
22.24 |
|
7 |
3.92 |
5.89 |
23.10 |
|
8 |
4.28 |
6.24 |
26.71 |
|
9 |
4.04 |
6.10 |
24.63 |
|
10 |
3.62 |
5.33 |
19.28 |
|
11 |
3.64 |
5.89 |
21.44 |
|
12 |
3.82 |
5.78 |
22.07 |
|
13 |
3.73 |
5.69 |
21.22 |
|
14 |
3.66 |
5.67 |
20.77 |
|
15 |
4.29 |
6.27 |
26.90 |
|
16 |
3.96 |
5.99 |
23.74 |
|
17 |
3.91 |
5.88 |
22.98 |
|
|
|
Total |
371.18 |
3.7 Calculating CSI values
The final stage is calculating the CSI. The CSI calculation is obtained by dividing the value WS by the highest scale used in research:
$\begin{gathered}C S I=\frac{\sum W S}{H S} \\ C S I=\frac{371.18}{5} \\ C S I=74.23\end{gathered}$
3.8 GAP analysis calculation
The gap value or gap between expectations (importance value) and performance (performance) obtained from respondents is a hope for improvement by the crossing service provider. To find out the gap between the level of importance and satisfaction, the average importance score minus the average satisfaction score. The summary of GAP calculations is presented in Table 8.
Table 8. Summary of gap calculations
|
GAP Calculation |
||||
|
Attribute |
Average Importance Score |
Average Satisfaction Score |
GAP |
Rank |
|
1 |
4.07 |
4.14 |
-0.07 |
17 |
|
2 |
4.09 |
4.08 |
0.01 |
15 |
|
3 |
4.04 |
3.95 |
0.09 |
9 |
|
4 |
3.99 |
4.04 |
-0.05 |
16 |
|
5 |
4.2 |
4.14 |
0.06 |
10 |
|
6 |
3.94 |
3.89 |
0.05 |
11 |
|
7 |
4.06 |
3.92 |
0.14 |
7 |
|
8 |
4.3 |
4.28 |
0.02 |
14 |
|
9 |
4.2 |
4.04 |
0.16 |
5 |
|
10 |
3.67 |
3.62 |
0.05 |
11 |
|
11 |
4.06 |
3.64 |
0.42 |
1 |
|
12 |
3.98 |
3.82 |
0.16 |
5 |
|
13 |
3.92 |
3.73 |
0.19 |
3 |
|
14 |
3.91 |
3.66 |
0.25 |
2 |
|
15 |
4.32 |
4.29 |
0.03 |
13 |
|
16 |
4.13 |
3.96 |
0.17 |
4 |
|
17 |
4.05 |
3.91 |
0.14 |
7 |
GAP interpretation and policy relevance. Table 8 shows the largest shortfalls are Safety (Attr. 11, GAP = 0.42), Community involvement/feedback (Attr. 14, 0.25), Information availability (Attr. 13, 0.19), Economic benefits/access (Attr. 16, 0.17), Security (Attr. 12, 0.16) and Service accuracy/comfort (Attr. 9, 0.16). These results indicate a safety-first deficit, followed by information and governance gaps, which is consistent with evidence that unsafe acts and decision-to-err factors [14], after analyzing the data using the CSI method well as navigation safety risks, are critical concerns in ferry operations [15]. Management implications are: (i) immediate mitigation of safety risks (e.g., provision of life jackets, stricter loading control, pier reinforcement, and installation of guard rails); (ii) low-cost information systems (posted routes/fares/schedules at piers and a basic WhatsApp/QR noticeboard for service updates); (iii) creation of a user feedback channel (complaints box or QR form with monthly review); (iv) improved lighting and passive surveillance at piers to enhance perceived security; and (v) a targeted review of fare and access policies to ensure that time savings translate into equitable economic benefits.
3.9 Calculating consumer conformity levels
This calculation is carried out by dividing the total score from the performance value by the total score from the importance value. The formula used is as follows:
$\begin{gathered}T k i=\frac{X_i}{Y_i} \times 100 \% \\ T k i=\frac{6711}{6893} \times 100 \% \\ T k i=97.4\end{gathered}$
Table 9. Summary of the calculation of levels of conformity, hold and action
|
Attribute |
$X_i$ |
$Y_i$ |
$Tki$ % |
Total $Tki$ % |
Hold/Action |
|
1 |
414 |
407 |
101.7 |
97.4 |
Hold |
|
2 |
408 |
409 |
99.8 |
97.4 |
Hold |
|
3 |
395 |
404 |
97.8 |
97.4 |
Hold |
|
4 |
404 |
399 |
101.3 |
97.4 |
Hold |
|
5 |
414 |
420 |
98.6 |
97.4 |
Hold |
|
6 |
389 |
394 |
98.7 |
97.4 |
Hold |
|
7 |
392 |
406 |
96.6 |
97.4 |
Action |
|
8 |
428 |
430 |
99.5 |
97.4 |
Hold |
|
9 |
404 |
420 |
96.2 |
97.4 |
Action |
|
10 |
362 |
367 |
98.6 |
97.4 |
Hold |
|
11 |
364 |
406 |
89.7 |
97.4 |
Action |
|
12 |
382 |
398 |
96.0 |
97.4 |
Action |
|
13 |
373 |
392 |
95.2 |
97.4 |
Action |
|
14 |
366 |
391 |
93.6 |
97.4 |
Action |
|
15 |
429 |
432 |
99.3 |
97.4 |
Hold |
|
16 |
396 |
413 |
95.9 |
97.4 |
Action |
|
17 |
391 |
405 |
96.5 |
97.4 |
Action |
|
Total |
6711 |
6890 |
97.4 |
|
|
From Table 9, the level of conformity between the interests and performance of the crossing service is obtained. An attribute that is smaller than the total Tki value means improvements must be made, marked with "Action”. Meanwhile, attributes that have a value greater than the total TKI mean that they have met the expectations of service users and are marked with "Hold”.
3.10 Determine the position of x and y values in the Cartesian diagram
Based on Table 10, the x and y coordinates in the Cartesian diagram are obtained, which determine the quadrant in which each attribute is located.
Table 10. x and y positions in the Cartesian diagram
|
Attribute |
$\underline{x}$ |
$\underline{y}$ |
|
1 |
4.14 |
4.07 |
|
2 |
4.08 |
4.09 |
|
3 |
3.95 |
4.04 |
|
4 |
4.04 |
3.99 |
|
5 |
4.14 |
4.2 |
|
6 |
3.89 |
3.94 |
|
7 |
3.92 |
4.06 |
|
8 |
4.28 |
4.3 |
|
9 |
4.04 |
4.2 |
|
10 |
3.62 |
3.67 |
|
11 |
3.64 |
4.03 |
|
12 |
3.82 |
3.98 |
|
13 |
3.73 |
3.92 |
|
14 |
3.66 |
3.91 |
|
15 |
4.29 |
4.32 |
|
16 |
3.96 |
4.13 |
|
17 |
3.91 |
4.05 |
|
Total Average |
3.95 |
4.05 |
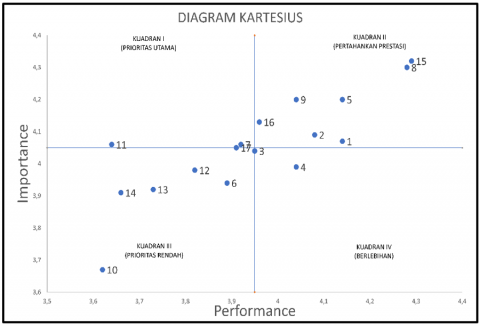
3.11 Cartesian diagram
After getting the position of each attribute relative to x and y in Table 10, the data is processed using the SPSS application, and a Cartesian diagram is produced as shown in Figure 2.
Figure 2. Cartesian diagram of the importance and performance of the Jeneberang River crossing service
After carrying out calculations using a Cartesian diagram, the results obtained for the attribute positions in each quadrant in the diagram are as follows:
a. Quadrant I (Top Priority)
Quadrant I is indicated as the main priority, where the level of importance is high but not yet in line with the expectations of service users. Improvements need to be made that focus on increasing the quality of services in this quadrant. Those in this quadrant are priorities. The attributes classified in Quadrant I are presented in Table 11.
Table 11. Attributes in Quadrant I
|
Attribute |
Question |
|
11 (Safety) |
Passengers are protected from the risk of accidents caused by humans, vehicles, roads, and/or the environment |
|
7 (Availability) |
Readiness of ferry vessels to be used or operated within the predetermined time |
|
17 (Economic Benefits) |
Creating Economic and Investment Opportunities |
Quadrant I (High-importance/Low-performance) contains the immediate priorities—most prominently Safety (11) and Availability/readiness (7), with Economic benefits/access (17) also flagged. These require budget-protected, time-bound actions: mandatory life-jackets and guard rails; simple loading procedures and signage; pier decking/foundation repairs at the busiest nodes; and a minimal downtime/maintenance timetable to keep vessels “ready on time.”
b. Quadrant II (Maintain Achievement)
Quadrant II is an achievement, a high level of importance with a high level of satisfaction, so you only need to maintain the achievements that have been achieved. Those in this quadrant support satisfaction and should be appreciated. The attributes classified in Quadrant I are presented in Table 12.
Table 12. Attributes in Quadrant II
|
Attribute |
Question |
|
1 (Accessibility) |
Distance to reach the crossing location |
|
2 (Accessibility) |
Crossing travel time |
|
5 (Accessibility) |
Ease of payment |
|
8 (Affordability) |
Affordable ferry transport rates |
|
9 (Accuracy) |
Match between services and passenger needs so that passengers feel comfortable when traveling |
|
15 (Save Time) |
Can save travel time |
|
16 (Economic Benefits) |
Crossing transportation services must be able to increase community access to various forms of productive income sources |
Quadrant II (High-importance/High-performance) items such as Accessibility/time saving (1,2,15) and Affordability (8) should be maintained but insulated from policies that could unintentionally erode them (e.g., keep fares affordable while introducing safety upgrades).
c. Quadrant III (Low Priority)
Quadrant III is low priority, meaning this quadrant contains attributes that have a low level of importance and a low level of customer satisfaction. So the attributes contained in this quadrant are considered not very important. The attributes classified in Quadrant I are presented in Table 13.
Table 13. Attributes in Quadrant III
|
Attribute |
Question |
|
6 (Mobility) |
Crossing users can easily move or change places |
|
10 (Reliability) |
Availability of information on service changes for service users |
|
12 (Security) |
Every passenger and vehicle is free from interference from unlawful acts and/or fear in traffic |
|
13 (Information) |
Availability of information about routes, fares, and schedules in easily accessible places |
|
14 (Community Involvement) |
The community is allowed to provide critical and constructive input |
Quadrant III (Low-importance/Low-performance) (e.g., Info 13, Security 12) should not be ignored—several appear in the action list via conformity analysis—so adopt low-cost fixes (printed info panels; lighting/CCTV at piers) rather than major capex.
d. Quadrant IV (Excessive)
Quadrant IV is excessive, meaning that this quadrant contains attributes that have a low level of importance with an excessive level of satisfaction, so it can be interpreted that the service provider should improve services on other attributes. The attributes classified in Quadrant I are presented in Table 14.
Table 14. Attributes in Quadrant IV
|
Attribute |
Question |
|
3 (Accessibility) |
Ferry vessel capacity |
|
4 (Accessibility) |
Crossing frequency |
Quadrant IV (Low-importance/High-performance) (e.g., Capacity 3, Frequency 4) suggests room to reallocate effort away from “over-serving” toward Quadrant I safety/information work.
3.12 Types of ferry transport services
The Jeneberang River crossing transportation service is a crossing service that is still operated independently by the community. This type of service, namely a short river crossing with a path length of ± 200 m which can be reached in ± 5 minutes. The crossing path is formed between one pier and a pair of piers on the other side of the river, so that ships take passengers back and forth to cross. Because this service is still run by the community without government intervention, the crossing process from payment, crossing to getting to the other side of the river does not yet involve any particular technological system. The following is an explanation of the crossing process:
a. Passengers arrive and wait for the ship to be ready to load passengers.
b. Passengers and their motorbikes board the ship.
c. The ships are arranged in two rows on board. After that, the ship's officers will go around to ask service users for crossing fees.
d. The payment process takes place while the ship crosses the river.
e. After the ship arrived across the river, the passengers and their motorbikes took turns getting off the ship.
3.13 Strategy for improving crossing transportation services, following applicable regulations and in line with the concept of sustainable transportation
Strengthening ferry regulations and certification should be harmonized with national standardization initiatives for conformity assessment bodies, as outlined by Admaja [16]. In formulating an appropriate development strategy, suitable research instruments are required. In this study, SWOT analysis is employed to derive strategies for improving crossing services, as it enables researchers to systematically identify the strengths, weaknesses, opportunities, and threats associated with the service, as summarized in Table 15.
a. Strength
Strength is the strength possessed by resources, skills and other points which constitute the advantages of an organization. Strength is a driver of development. The strengths of the Jeneberang River crossing service are as follows:
b. Weakness
Weakness is a weakness or limitation of resources and skills that can hinder the development of an organization. Identify the weaknesses of the Jeneberang River crossing service as follows:
c. Opportunity
Opportunity is a favorable condition in the organizational environment that allows it to be exploited for the benefit of the organization. The opportunities offered by the Jeneberang River crossing service are as follows:
d. Threat
A threat is a threat or condition that is unfavorable for the organization. Threats can be detrimental to an organization's position in carrying out the development and continuity of its activities. The threats that the Jeneberang River crossing service poses are as follows:
Table 15. Matrix SWOT
|
|
Strength |
Weakness |
|
IFAS |
|
|
|
EFAS |
||
|
Opportunity |
SO Strategy |
WO Strategy |
|
|
|
|
Threat |
ST Strategy |
WT Strategy |
|
|
|
From diagnostics to strategies (SWOT/TOWS), the SWOT was populated from the IPA/GAP evidence and field observations: Strengths (short trip time, proximity to homes, affordability), Weaknesses (unsafe piers, limited information, narrow access, lack of feedback channel), Opportunities (simple digital tools; community partnerships; small grants), and Threats (accident risk; rainfall disruption; limited oversight). With the case located in Quadrant I (growth-oriented), SO strategies should leverage proximity and travel-time advantage to roll out basic safety & info systems; WO strategies should fix unsafe piers and information deficits using low-cost materials and community labour; ST strategies should codify wet-weather SOPs and loading controls to contain risk; and WT strategies should phase road/ pier reinforcement and formalise oversight to reduce structural vulnerabilities.
3.14 SWOT analysis
SWOT analysis is used to develop a product development strategy. In this analysis, there are two important factors, namely, internal and external factors. In the process of getting the right strategy, pay attention to Table 16 and Table 17, which present Internal Strategy Factor Analysis Summary (IFAS) calculations and External Strategy Factor Analysis Summary (EFAS).
Table 16. SWOT analysis of IFAS factors
|
NO. |
Factor |
Weight |
Rating |
Score |
|
Internal (Strength) |
||||
|
1 |
Location close to residential areas |
0.09 |
5 |
0.46 |
|
2 |
There are many ships in active operation |
0.09 |
5 |
0.46 |
|
3 |
Short crossing travel time |
0.09 |
5 |
0.46 |
|
4 |
Easy and simple payment system |
0.08 |
4 |
0.31 |
|
5 |
Affordable rates |
0.09 |
5 |
0.46 |
|
6 |
Save travel time |
0.06 |
3 |
0.18 |
|
7 |
Matching services and passenger needs so that passengers feel comfortable when crossing |
0.03 |
3 |
0.09 |
|
8 |
High vessel capacity |
0.06 |
5 |
0.31 |
|
Internal (Weaknesses) |
||||
|
1 |
Passengers are not given a platform to provide input or constructive criticism |
0.09 |
2 |
0.18 |
|
2 |
Information regarding changes to crossing services is not available |
0.09 |
2 |
0.18 |
|
3 |
The activity of transferring passengers from the ship to the road is unsafe due to the inadequate condition of the pier |
0.06 |
2 |
0.12 |
|
4 |
Road access is narrow and inadequate |
0.06 |
2 |
0.12 |
|
5 |
The crossing service can only be used by two-wheeled vehicle users |
0.09 |
1 |
0.09 |
|
|
Total Score |
1 |
|
|
|
|
|
Strength Score |
2.74 |
|
|
|
|
Weakness Score |
0.71 |
|
|
|
|
Total Score IFAS |
2.03 |
|
Table 17. SWOT analysis of EFAS factors
|
NO. |
Factor |
Weight |
Rating |
Score |
|
External (Opportunity) |
||||
|
1 |
Ideal location |
0.18 |
5 |
0.91 |
|
2 |
Provide investment opportunities |
0.15 |
5 |
0.76 |
|
3 |
Opportunities for surrounding economic activity |
0.18 |
4 |
0.73 |
|
|
Internal (Threat) |
|||
|
1 |
Risk of accident when crossing |
0.12 |
2 |
0.24 |
|
2 |
Crossing services cannot be used during high rainfall |
0.18 |
2 |
0.36 |
|
3 |
There is no supervision from the government |
0.18 |
2 |
0.18 |
|
|
|
Chance Score |
2.73 |
|
|
|
|
Threat Score |
0.96 |
|
|
|
|
Total EFAS score |
1.61 |
|
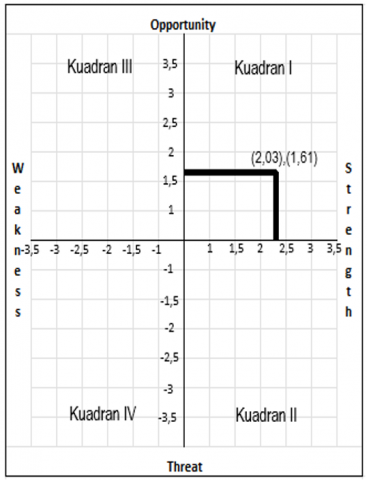
Pay attention to Tables 16 and 17; these tables have produced x and y coordinates (2.03), (1.61), which are presented in Figure 3.
Figure 3 shows that the x and y coordinates are in Quadrant I. Which means a very favorable situation. Ferry services have opportunities and strengths, so they can take advantage of existing opportunities. The strategy that must be implemented in this condition is to support aggressive growth policies (Growth-oriented strategy).
Figure 3 shows that the coordinate point is in Quadrant I, which means the situation is very profitable by taking advantage of the strengths and opportunities it has. Don't forget that this solution is designed to be sustainable with solutions as below:
a. Digital payments (QR/Quick Response Code)
b. Worker/student season passes (weekly/monthly)
c. Fast shuttle service in dense residential corridors
d. Wayfinding and pier branding as “ideal access”
The involvement of local communities is also very important in the concept of sustainability, especially in the social sector, namely by involving local communities in the management and development of river crossings. Encourage active participation in maintaining the cleanliness of rivers and the surrounding environment.
Sustainable transport for river crossings plays an important role in supporting eco-friendly mobility and community connectivity. In this study, we adopt the definitions of sustainable transportation proposed by the Centre for Sustainable Transportation (CST) [17] and Mihyeon Jeon and Amekudzi [18] which emphasise accessibility, safety, environmental responsibility, and efficiency.
Figure 3. SWOT quadrant
The following are several strategies that can be implemented to develop sustainable transportation in the river crossing sector:
1. Use of Environmentally Friendly Vehicles:
2. Modern and Secure Infrastructure:
3. Integration with Land Transportation:
4. Efficient Traffic Management:
5. Local Community Involvement:
6. Sustainable Financial Management:
By combining the above strategies, river crossings can become more efficient, environmentally friendly, and contribute to sustainable development.
3.15 Prioritized, feasibility-checked actions
This section synthesises the IPA & GAP diagnostics and SWOT/TOWS into a phased action plan for operators and local authorities
4.1 Characteristics of crossing facilities and infrastructure on movement activities of Jeneberang River crossing service users
The Jeneberang River is a river that is used as a crossing location. The facilities and infrastructure for crossing the Jeneberang River consist of facilities (ships) and infrastructure (pier and road access). After conducting surveys and observations, it was found that the ship as a means was built using water-resistant wood materials such as ironwood, teak, and black ebony. This ship is a ship built from two fishing boats combined. Planks are spread across the ship to form a large space to accommodate passengers and two-wheeled vehicles on top, so this ship is still traditional. This ship has an average length of 17.5 m and a width of 4.8 m. This ship can accommodate cargo in the form of humans and two-wheeled vehicles. On average, this ship can accommodate 16 motorbikes and 23 passengers. The power of the ship's engine is 5-14 pk (horsepower).
For infrastructure, this crossing service has a pier which is mostly built from wooden materials such as bengkirai wood, ironwood, and teak. The pier has an average length of 5 m and a width of 3 m. For road access, the average width of the access road to the crossing point is 4 m.
After distributing questionnaires, the results showed that 52% of service users used this crossing service for economic purposes. Respondents were dominated by male service users aged 17-25 years. The river crossing service is most widely used by people with lower middle income, seen from the highest income level, namely > IDR 500,000, and in the second position at IDR 3,000,000-IDR 5,000,000 with the highest level of education, namely high school level at 43% of the total number of respondents.
This crossing service was developed to accommodate large numbers of passengers and their two-wheeled vehicles, effectively functioning as a moving bridge with a short travel time of approximately ± 5 minutes. The intensity of use is quite high: 44% of respondents reported using this service every day, and 19% reported using it 5–6 times per week. This pattern reflects strong home-to-work commuting demand, which is consistent with household-based trip generation approaches used to estimate travel demand in residential areas [20]. Thus, the crossing service is well aligned with daily mobility needs, as it is able to transport many passengers at once.
This crossing service really supports the community in their economic activities. The facilities and infrastructure are used to support crossing activities. The ship materials used are suitable to support activities in the waters, and the power of the ship's engines is also appropriate to the size of the river flow, which is not heavy because the location of this crossing is in the downstream area of the river. The ship's capacity is sufficient for large-capacity transportation.
The pier used is a pier made of water-resistant wood. This pier is movable or can be moved according to the position of the ship and the height of the river, so the pier is designed not to be too big so it can be easily moved when needed. This concept is good, but the drawback is that the foundation of the pier is not sturdy. This condition is not safe for moving many people at once, so transferring passengers from the ship to land must be done very carefully. The width and condition of the road access are narrow and not good; this is because many passengers access the road at once. This condition slows down the process of moving passengers, so that it takes more time.
4.2 Fulfillment of service quality based on ferry transport service type
To determine the quality of public transportation services, CSI and IPA analysis can be used [21]. These two types of analysis are used to measure the extent to which the Jeneberang River crossing service has played a role in accommodating people's movement needs effectively and efficiently. Data for this analysis method were collected using a questionnaire whose questions had been adjusted according to public service indicators, as described in Eboli and Mazzulla [22]. The questions contained in the questionnaire have been tested for validity and reliability; the results indicate that the questions in the questionnaire are valid and reliable.
After analyzing the data using the CSI method, a CSI value of 74.23% was produced, which in the CSI index means that customers overall felt "satisfied" with the services provided. Such use of satisfaction indices and importance–performance diagnostics to prioritise service improvements and inform policy decisions is consistent with public transit user satisfaction studies [4]. After that, IPA analysis was carried out. From the IPA analysis, a total suitability level value of 97.4 was produced. This total suitability level value is a value where if each attribute has a value smaller than 97.4, is considered a priority for improvement.
4.3 Strategy for improving crossing transportation services in line with sustainable transportation concepts
To obtain a suitable strategy for improving transportation services across the Jeneberang River, a SWOT analysis was used. SWOT analysis is an analysis method in research that groups the strengths, weaknesses, opportunities, and threats of a product or service. Using the IFAS and EFAS tables, weight calculations were carried out on the strengths, weaknesses, opportunities, and threats of the Jeneberang River crossing service. This calculation is carried out to find the x and y coordinates in the SWOT quadrant. After getting the IFAS and EFAS coordinate points, the result was that the coordinate points were in Quadrant I, which means that the situation is favorable, the Jeneberang River crossing service has opportunities and strengths, so that existing opportunities can be utilized. This strategic framing aligns with debates on how informal services such as paratransit should be engaged and integrated in public transport reform rather than simply displaced [23]. The resulting strategy is as follows:
a. Construction of minimarkets, this will increase the comfort of service users because there will be a place that can be used to shop for daily necessities before continuing their journey. Berawi et al. [24] highlighted that developing a minimarket around the facility can enhance user comfort and convenience by allowing passengers to purchase daily necessities before continuing their trips, aligning with transit-oriented development principles that encourage mixed-use station areas where retail and services are located within walking distance of public transport stops.
b. The construction of entertainment venues or tourist attractions on the banks of rivers, with the construction of tourist attractions and crossing locations, will invite many people to come, and will be able to improve the economy in riverside areas. River tourism development can be done by promoting river crossings as tourist attractions. Providing boat or ship tours to explore the beauty of the river and the surrounding scenery. Apart from that, this development will improve the quality of life of people who get jobs from this business.
Construction of a restaurant and café with a garden concept. To increase green space, restaurants and cafés that are built with a garden concept will add green open space, which is good for the environment and reduces pollution.
Conclusions and implications: Using a SERVQUAL-informed attribute set, the Jeneberang River case shows an overall CSI of 74.23% (users generally satisfied), yet IPA/GAP reveals concentrated shortfalls in safety, service information, and pier/road infrastructure. Positioning in SWOT Quadrant I (growth-oriented) indicates scope to leverage strengths (proximity, time saving, affordability) while addressing operational weaknesses. The study contributes methodologically by demonstrating how CSI–IPA diagnostics can be systematically translated into SWOT/TOWS strategies for informal river-ferry contexts—an area under-represented in the literature. For policy and practice, a phased package is recommended: quick wins (0–6 months)—life jackets, guard rails, loading rules, info boards, lighting, feedback channel; build-outs (6–12 months)—pier reinforcement, flow delineation, CCTV, shelters; systems (12–24 months)—incident reporting, wet-weather SOPs, drills, light-touch oversight. Implementing these measures can raise perceived safety and reliability at low cost while preserving affordability and access.
Limitations: Findings rely on self-reported satisfaction, a cross-sectional window (Feb–Apr 2024), and n = 100 intercepts across six routes; SWOT scoring involves expert judgement despite structured weighting.
Future research: Future studies should include longitudinal post-intervention tracking; quasi-experimental designs to assess the effects of safety and information policies; stratified sampling based on route volume; cost–benefit analysis; assessment of environmental and emissions impacts; and examination of integration with land-based transport to improve first-/last-mile connectivity.
[1] Cervero, R., Golub, A. (2007). Informal transport: A global perspective. Transport Policy, 14(6): 445-457. https://doi.org/10.1016/j.tranpol.2007.04.011
[2] de Oña, J., de Oña, R. (2014). Quality of service in public transport based on customer satisfaction surveys: A review and assessment of methodological approaches. Transportation Science, 49(3): 605-622. https://doi.org/10.1287/trsc.2014.0544
[3] Tyrinopoulos, Y., Antoniou, C. (2008). Public transit user satisfaction: Variability and policy implications. Transport Policy, 15(4): 260-272. https://doi.org/10.1016/j.tranpol.2008.06.002
[4] Bahar, A. (2018). Analisis Kebutuhan Angkutan Penyeberangan Sungai Jeneberang. UIN Alauddin Makassar, Makassar. http://repositori.uin-alauddin.ac.id/12411/1/Akbar%20Bahar.pdf.
[5] Parasuraman, A., Zeithaml, V.A., Berry, L.L. (1994). Reassessment of expectations as a comparison standard in measuring service quality: Implications for further research. Journal of Marketing, 58(1): 111-124. https://doi.org/10.1177/002224299405800109
[6] Martilla, J.A., James, J.C. (1977). Importance–performance analysis. Journal of Marketing, 41(1): 77-79. https://doi.org/10.1177/002224297704100112
[7] Utomo, D.M., Mateo-Babiano, I. (2015). Exploring indigeneity of inland waterway transport (IWT) in Asia: Case studies of Thailand, Vietnam, the Philippines, and Indonesia. Journal of the Eastern Asia Society for Transportation Studies, 11, 2316-2332. https://doi.org/10.11175/easts.11.2316
[8] Luthfiyah, S., Ariswati, H.G., Widyawati, M.N., Mendinueto, M.P. (2023). Validity and reliability of the parental independence questionnaire on the care of children with bronchial asthma. In 6th International Conference of Health Polytechnic Surabaya (ICoHPS 2023), pp. 576-587. Atlantis Press. https://doi.org/10.2991/978-94-6463-324-5_57
[9] Junaidi. (2010). Tabel r (Koefisien Korelasi Sederhana) Df=1-200. https://junaidichaniago.files.wordpress.com/2010/05/tabel-r.pdf.
[10] Hinkle, D.E., Wiersma, W., Jurs, S.G. (2003). Applied statistics for the behavioral sciences (5th ed.). Boston, MA: Houghton Mifflin. https://search.worldcat.org/title/Applied-statistics-for-the-behavioral-sciences/oclc/1408417597?utm.
[11] Field, A. (2013). Discovering Statistics Using IBM SPSS Statistics (4th ed.). London: SAGE Publications.
[12] Nunnally, J.C., Bernstein, I.H. (1994). Psychometric Theory (3rd ed.). New York, NY: McGraw–Hill. https://books.google.com/books/about/Psychometric_Theory.html?id=r0fuAAAAMAAJ&utm_source.
[13] Anderson, E.W., Fornell, C. (2000). Foundations of the American customer satisfaction index. Total Quality Management & Business Excellence, 11(7): 869-882. https://doi.org/10.1080/09544120050135425
[14] Aksorn, T., Hadikusumo, B.H.W. (2007). The unsafe acts and the decision-to-err factors of Thai construction workers. Journal of Construction in Developing Countries, 12(1): 1-25. http://eprints.usm.my/42419/1/1_Thanet_%26_Hadikusumo_%28p.1-25%29.pdf.
[15] Hsu, W.K.K., Chen, J.W., Huynh, N.T., Lin, Y.Y. (2022). Risk assessment of navigation safety for ferries. Journal of Marine Science and Engineering, 10(5): 700. https://doi.org/10.3390/jmse10050700
[16] Admaja, A.F.S. (2013). Studi kesiapan direktorat standardisasi dalam menerapkan SNI ISO/IEC 17065. Buletin Pos dan Telekomunikasi, 11(3): 223-234. https://bpostel.komdigi.go.id/index.php/bpostel/article/view/58?utm_source.
[17] Centre for Sustainable Transportation (CST). (2002). Definition and vision of sustainable transportation. Toronto, Ontario: The Centre for Sustainable Transportation.
[18] Mihyeon Jeon, C., Amekudzi, A. (2005). Addressing sustainability in transportation systems: Definitions, indicators, and metrics. Journal of Infrastructure Systems, 11(1): 31-50. https://doi.org/10.1061/(ASCE)1076-0342(2005)11:1(31)
[19] Márquez, L., Cantillo, V., Arellana, J. (2014). How are comfort and safety perceived by inland waterway transport passengers? Transport Policy, 36: 46-52. https://doi.org/10.1016/j.tranpol.2014.07.006
[20] Bella, R.A., Malaikosa, K., Fanggidae, L.W. (2013). Pemodelan bangkitan perjalanan berbasis rumah tangga di kompleks RSS. Baumata, kecamatan taebenu, kabupaten kupang. Jurnal Teknik Sipil, 2(1): 63-70. https://sipil.ejournal.web.id/index.php/jts/article/view/280
[21] Eboli, L., Mazzulla, G. (2009). A new customer satisfaction index for evaluating transit service quality. Journal of Public Transportation, 12(3): 21-37. https://doi.org/10.5038/2375-0901.12.3.2
[22] Eboli, L., Mazzulla, G. (2007). Service quality attributes affecting customer satisfaction for bus transit. Journal of Public Transportation, 10(3): 21-34. https://doi.org/10.5038/2375-0901.10.3.2
[23] Schalekamp, H., Behrens, R. (2010). Engaging paratransit on public transport reform initiatives in South Africa: A critique of policy and an investigation of appropriate engagement approaches. Research in Transportation Economics, 29(1): 371-378. https://doi.org/10.1016/j.retrec.2010.07.047
[24] Berawi, M.A., Saroji, G., Iskandar, F.A., Ibrahim, B.E., Miraj, P., Sari, M. (2020). Optimizing land use allocation of transit-oriented development (TOD) to generate maximum ridership. Sustainability, 12(9): 3798. https://doi.org/10.3390/su12093798