Sangeetha Shivananda*![]() | Pramod Tumkur Channabasavanna
| Pramod Tumkur Channabasavanna![]()
© 2025 The authors. This article is published by IIETA and is licensed under the CC BY 4.0 license (http://creativecommons.org/licenses/by/4.0/).
OPEN ACCESS
The rapid growth of Android applications has made mobile devices increasingly vulnerable to malware attacks. Existing detection models often struggle due to ineffective feature selection, limiting their accuracy. This paper analyzes Android malware detection techniques using machine learning (ML) and deep learning (DL) approaches, evaluating models based on parameters such as accuracy, precision, recall, F1-score, root mean squared error (RMSE), mean absolute error (MAE), log loss, area under the curve (AUC), and execution time. Experimental results show that the random forest (RF) classifier achieves the highest detection performance with 88.17% accuracy, 0.575 precision, 0.582 recall, and an AUC of 0.772, outperforming other evaluated models. These findings highlight the potential of RF for efficient and reliable Android malware classification.
APK behavior analysis, Android malware, machine learning, deep learning, random forest, static and dynamic malware analysis
Malware is a program or file that is intentionally written to cause harm to a system/network, ranging from user information stealing to cyber espionage. Malware is regarded as one of the main causes of many Internet security problems and a serious threat to computer security. The use of mobile devices is increasing as a replacement for laptops and desktop computers for a large range of day-to-day activities, including e-banking, social networking, mobile payments, office work, and a range of other applications. Android continued to be the most widely used mobile operating system worldwide, with a 71.8% market share in the first quarter of 2025, as shown in Figure 1 [1]. The proliferation of Android devices has made them a high-value target for cybercriminals, resulting in a proliferation of malware attacks to steal user data, financial resources, and system vulnerabilities. Android has seen a range of sophisticated malware families in recent years that reflect the dynamic threat horizon. The dramatic growth in the number of malwares poses a serious challenge to secure Android systems. Malware detection in Android phones is the process of monitoring and protecting against unusual behavior due to malicious activities of malware such as Trojans, ransomware, and spyware. As shown in Figure 2, the Avast Threat Report (Jan–Mar 2024) provides insights into mobile malware [2]. It was observed that approximately 2-3 attacks per month were detected on Android mobiles.

Figure 1. Market share of Android phones in Q1 2025 [1]

Figure 2. Malware statistics for Q1 of 2024 [2]
Android malware results in significant risks to user privacy, security of data, and the performance of the device. Malware often targets sensitive data such as login credentials, financial information, and personal files. Certain types of malwares, such as ransomware and SMS Trojans, would result in financial losses for users [3].
Malware can invade users' privacy by monitoring their activities, tracking their location, and accessing sensitive information without their consent. Malware may gain unauthorized access to Android devices, allowing attackers to control them remotely. Some malware disrupts the normal functionality of Android devices by displaying unwanted advertisements, redirecting users to malicious websites, or interfering with the operation of legitimate apps [4]. Falling victim to Android malware can damage a user's reputation, particularly if sensitive or embarrassing information is exposed as a result of a malware infection. In certain instances, the effects of Android malware infections may extend beyond the individual user to legal and regulatory consequences. For example, businesses may face damages for data breaches that lead to malware infections on employee-owned devices used for work purposes. Threat actors continuously adapt their tactics, successfully uploading malicious apps to the Google Play Store—examples include Joker, Facestealer, and Coper, all known for their sophisticated banking and data-stealing capabilities. As smartphones are one of the major requirements in human life, it is necessary to significantly improve the performance of the Android malware detection system. It is crucial for Android users to take proactive steps to protect their devices from malware.
Malware detection methods can generally be divided into three groups: signature-based, heuristic-based, and specification-based [5]. In the signature-based method, malware is detected depending on known patterns. One example is antivirus programs. In the Heuristic-based method, malware is detected depending on the behavior of the malware. In specification-based detection techniques, applications are monitored according to their specification and then checked for normal and abnormal behavior. To mitigate and monitor Android malware, AI-powered solutions are in demand. Recent studies have introduced machine learning (ML) and deep learning (DL) models to detect unknown malware variants. However, many existing methods face challenges such as poor feature selection, overfitting, high computational complexity, incomplete evaluation metrics, and limited generalization. Also, prior studies rely solely on either static or dynamic analysis, which restricts their ability to detect sophisticated or obfuscated malware. The use of limited datasets or evaluating a narrow set of ML models reduces the generalizability and robustness of the existing findings. Furthermore, comparative evaluations across diverse ML and DL models are often lacking, and the models’ scalability and applicability to real-world malware detection scenarios are still a challenge.
In this paper, the following research inquiries were formulated and assessed:
RQ1: What form of malware compromises an Android system?
RQ2: Which methods have been applied in ML/DL to find patterns connected to Android malware?
RQ3: Which methods perform better in terms of classifying accuracy than others?
RQ4: Which model is the optimal model in handling noisy, unbalanced datasets with high-dimensional static features?
The remaining part of the paper is arranged as follows: Section 2 discusses the malware analysis methods, malware types, attacks, general features used to categorize Android malware, and analysis of existing schemes. Section 3 portrays the ML model for categorizing malware on Android devices. Section 4 discusses the results and discussion, and the conclusion and future scope are given in Section 5.
Android malware can be analyzed by static analysis, dynamic analysis, and hybrid analysis [5]. The method of identifying a computer program/code without executing a program (samples) is called static analysis. A technique of identifying a computer program/code while executing a program is called dynamic analysis. A technique of performing an examination of a computer program/code after carrying out the program in a real/virtual processor is known as hybrid analysis.
Android systems are susceptible to various kinds of malware [6]. Some common types of malwares that can affect Android devices are shown in Figure 3.

Figure 3. Different types of malwares
Numerous malware attacks targeting Android devices have occurred over the years. Some general types of Android malware attacks that have been prevalent in recent years include ransomware, banking Trojans, spyware, adware, SMS Trojans, fake apps, supply chain attacks, etc. Table 1 lists the recent Android malware attacks that have happened over the years.
Table 1. Recent Android malware attacks
|
Ref. |
Android Malware |
Remarks |
|
[7] |
FluBot (Year: 2020) |
An Android banking Trojan that spreads via SMS phishing (smishing) messages, tricking users into installing fake delivery tracking apps. Once installed, it steals credentials, contact lists, and can send SMS to propagate itself. |
|
[8] |
BlackMamba (Year: 2023) |
AI-powered ransomware is capable of capturing keystrokes using ML and potentially exploiting Android OS vulnerabilities. |
|
[9] |
Coper (Year: 2023) |
A malware that targets Android devices with a combination of fake apps and trojanized apps. Once installed, it steals banking information, displays fake login pages, and can intercept and modify SMS messages. It also provides attackers with remote control. |
|
[10] |
Antidote (Year: 2024) |
A Trojan that impersonates the Google Play Store interface to trick users into granting permissions and downloading additional malicious payloads. |
|
[11] |
Xenomorph (Year: 2024) |
An Android banking Trojan that employs overlay attacks on banking apps. It uses credential harvesting techniques, enabling attackers to steal banking information and transfer funds. It also includes advanced evasion techniques to avoid detection. |

Figure 4. Features used to classify Android malware
2.1 General features used to classify Android malware
Android malware classification is usually performed with the features shown in Figure 4. It includes static, dynamic, hybrid, metadata, and graph-based features [12]. The following are the typical characteristics of the features:
2.1.1 Characteristics of static analysis
Table 2. Analysis of existing malware detection schemes
|
Ref. |
Static Analysis |
Dynamic Analysis |
ML/DL Approches |
Accuracy |
Input File Type |
Classification Algorithm |
Dataset |
Advantages |
Disadvantages |
|
[13] |
✘ |
✔ |
DL (Stateful Input Generation) |
Dynamic: 97.8%, Combined: 99.6% |
APK files |
Deep Neural Network |
30,000+ samples |
High detection rate using dynamic features; real-device testing |
Requires real devices and limited static analysis |
|
[14] |
✘ |
✔ |
Bi-directional LSTM |
97.22% |
APK files |
Bi-directional LSTM |
21,000 samples |
Effective for code localization, high accuracy |
Dynamic analysis only, potentially missing patterns or features detectable through static analysis |
|
[15] |
✔ |
✔ |
Random Forest, Ensemble Models |
Up to 96.8% |
APK files |
Random Forest, Ensemble Models |
124,000 samples |
Comprehensive evaluation; balanced dataset |
Limited to selected models; may not generalize to all scenarios |
|
[16] |
✘ |
✔ |
ML (Dynamic Analysis) |
Category: > 96%, Family: > 99% |
APK files |
Various ML algorithms |
CCC-CIC-AndMal2020 dataset |
High accuracy in category and family detection |
Dynamic analysis only; may miss static indicators |
|
[17] |
✔ |
✔ |
Neural Networks |
Not specified |
APK files |
Neural Networks |
Omnidroid dataset |
Hybrid analysis approach |
Accuracy not specified; may require significant computational resources |
|
[18] |
✔ |
✔ |
Various ML algorithms |
Category: 96.9%, Family: 88.9% |
APK files |
Various ML algorithms |
Not specified |
High accuracy in category and family detection |
A hybrid approach may increase complexity |
|
[19] |
✘ |
✔ |
DL |
98.08% detection rate |
APK files |
Deep Neural Network |
13,533 samples |
High detection rate; effective against obfuscated malware |
Limited to dynamic analysis; may not detect static indicators |
|
[20] |
✔ |
✔ |
Random Forest, Deep Neural Network with Clustering |
Up to 99.6% AUC |
APK files |
Random Forest, Deep Neural Network |
Not specified |
High accuracy; clustering improves detection |
Complexity increases with clustering; it may require more resources |
|
[21] |
✔ |
✔ |
ML and DL |
Not specified |
APK files |
Various ML and DL algorithms |
Not specified |
Combines static and dynamic analysis |
Accuracy not specified; may require significant computational resources |
|
[22] |
✔ |
✔ |
DL with Model Fusion |
99.97% F1-score |
APK files |
Deep Neural Networks |
CICMaldroid2020 dataset |
High accuracy; explainable model |
Complex model fusion may require high computational resources |
|
[23] |
✔ |
- |
DL – LSTM and Feedforward Neural Network (NN) |
LSTM: 99.24% |
APK static features |
- LSTM (Recurrent Neural Network) |
DREBIN-215: 15,036 apps (5,560 malware + 9,476 benign), 215 static features |
- Good accuracy & performance - Optimized using GridSearchCV - SMOTE is used for class balancing - Fast training using TPU |
Only static analysis used (no dynamic behavior tracking) |
2.1.3 Characteristics of hybrid features
Hybrid features combine both static and dynamic elements, often based on specific triggers. Static analysis is employed to identify potential trigger points, while dynamic analysis is used to assess whether and how these triggers are activated during runtime. ML models that leverage both static features—such as permissions and API calls—and dynamic behaviors—like runtime actions and network patterns—are referred to as hybrid models.
2.1.4 Characteristics of metadata features
Metadata elements provide additional context regarding the origin, structure, and distribution of an app; they are essential in the categorization of Android malware. Combining these features with dynamic and static analysis can improve malware detection accuracy. Several crucial metadata attributes are employed in the categorization of Android malware. Features of Metadata for Applications:
2.1.5 Characteristics of graph-based features
2.2 Analysis of existing malware analysis schemes
Various ML and DL approaches have been employed for malware classification, combining static and dynamic analysis techniques. Table 2 shows the comparison analysis of existing malware analysis. The table considered the type (static or dynamic), approach applied (ML/DL), accuracy obtained, classification algorithm used, dataset used, advantages, and drawbacks of the schemes.
Table 2 points out different methods for Android malware detection, with the focus on integrating static, dynamic, and hybrid analysis techniques. Static analysis can be helpful in detecting known malware signatures and behaviors without running the app, but it can fail to detect obfuscated or sophisticated malware behaviors that only appear at runtime. Dynamic analysis, however, enables a better understanding of an app's behavior in real-time, identifying malicious activities that static analysis cannot detect. But dynamic analysis is time and resource-intensive, as it involves actually running the application. By fusing both, hybrid analysis offers more effective detection process that reduces the disadvantages of each stand-alone approach. On the front of ML and DL algorithms, DL models, particularly neural networks, are now becoming the go-to choice because they provide very high accuracy in classification and can deal with complex data patterns. Specifically, methods that combine ML and DL with hybrid analysis methods provide the highest performance, yielding high detection rates while mitigating the limitations of both individual methods. Thus, hybrid methods that are based on ML/DL algorithms have become the most adopted and most effective for detecting Android malware.
The methodology employed in this study involves several critical phases to predict Android malware using a diverse array of ML and DL algorithms. The process begins with problem identification, followed by data collection, exploratory data analysis, model selection, training, evaluation, performance comparison, and in-depth analysis. Figure 5 shows the architecture for Android malware classification. Each of these stages is meticulously detailed below, with visual aids such as correlation heatmaps enhancing the understanding of the dataset and model outcomes.
The proposed model relies on ML to detect Android malware in real time by analyzing the behavior of APKs. The malware analysis consists of the following steps: In the Initial step, the data is taken from the dataset, and Initial preprocessing will be performed to remove duplicates in the next step. Features are selected carefully and then applied with various ML/DL models to classify the Android malware.

Figure 5. Architecture for Android malware classification
3.1 Data collection
The analysis leverages the Android_Malware.csv dataset, a publicly available resource obtained from Kaggle, containing 86 columns and 355,650 entries. This dataset includes an extensive set of network traffic features extracted from Android devices, such as packet lengths, flow durations, protocol types, inter-arrival times, packet rates, header lengths, flag counts, and other statistical metrics, selected for their well-documented association with malware detection behaviors. The target variable, indicative of malware presence or absence, supports both binary and multi-class classification tasks, allowing for a nuanced analysis of malicious activities. The dataset initially included columns such as Flow ID, Source IP, Destination IP, and Timestamp, which contained specific values for all data entries, potentially contributing to overfitting in initial model evaluations.
Before applying learning models, the dataset undergoes a series of rigorous preprocessing steps to ensure data quality and compatibility. Missing values are systematically imputed with the mean of their respective features to maintain dataset integrity. Non-numeric attributes, such as protocol types or categorical labels, are encoded into numerical form using a factorization approach to align with algorithmic requirements. Continuous features, including packet lengths and flow durations, are normalized using Min-Max scaling to eliminate scale disparities that could disproportionately influence model performance. This normalization process ensures that all features contribute equitably to the predictive modeling. Additionally, to address overfitting observed in preliminary models, the columns Flow ID, Source IP, Destination IP, and Timestamp were removed. This adjustment resulted in a significant decrease in the accuracy of overfitting-prone models (e.g., decision tree, extra trees), as these columns provided unique identifiers and temporal data that the models over-relied upon, leading to poor generalization on unseen data.
3.2 Feature selection
A correlation matrix is computed and visualized using a Python-based data visualization library to uncover relationships between the remaining features, offering critical insights into their interdependencies and relevance to malware detection. The resulting heatmap (as depicted in Figure 6) highlights strong positive and negative correlations, with color intensity reflecting the strength of these relationships. For example, features such as Total Fwd Packets and Total Length of Bwd Packets exhibit high positive correlations, suggesting that increased packet activity in both forward and backward directions may be indicative of malicious traffic. Conversely, negative correlations, such as between Fwd IAT Mean (forward inter-arrival time) and Bwd IAT Total (backward inter-arrival time total), may indicate differing temporal patterns between benign and malicious flows. Highly correlated features, particularly those exceeding a threshold (e.g., 0.9), are identified for potential removal to mitigate multicollinearity, enhancing model robustness. This heatmap serves as a foundational tool for feature selection and informs subsequent modeling strategies.

Figure 6. Heatmap illustrating the correlation between network traffic features
The heatmap visualizes the Pearson correlation coefficients between all feature pairs, with a color gradient from blue (negative correlation, e.g., -0.6) to red (positive correlation, e.g., 1.0). Key observations include strong positive correlations among packet-related features (e.g., Total Fwd Packets and Subflow Fwd Packets) and notable negative correlations between temporal features (e.g., Fwd IAT Mean and Idle Std), guiding the preprocessing and feature engineering process.
The study explores a comprehensive set of ML and DL algorithms to predict Android malware based on network traffic data. The selected models span traditional statistical methods, ensemble techniques, and advanced neural network architectures, chosen for their ability to capture a wide range of patterns and their varying computational demands. The study considered ten models for evaluation including logistic regression (LR), decision tree (DT), random forest (RF), extra trees (ET), gradient boosting (GB), extreme gradient boosting (XGBoost), light gradient boosting machine (LightGBM), multilayer perceptron (MLP), and convolutional neural network (CNN) and long short-term memory network (LSTM) [24, 25].
1) Logistic regression (LR): A linear model that estimates the probability of malware presence using a logistic function. It is computationally efficient and provides a baseline for comparison, though it assumes a linear relationship between features and the target.
2) Decision tree (DT): A tree-based model that recursively partitions data based on feature thresholds. It offers interpretability and is prone to overfitting unless pruned, utilizing impurity measures such as the Gini index or entropy to optimize splits.
3) Random forest (RF): An ensemble model that constructs multiple DTs on random subsets of data and features, averaging predictions to improve accuracy and mitigate overfitting through diversification.
4) Extra trees (ET): An enhanced version of RF that introduces additional randomness in tree construction by considering random feature splits, enhancing generalization across diverse datasets.
5) Gradient boosting (GB): A sequential ensemble technique that builds DTs iteratively, with each tree correcting the errors of its predecessors. It excels with complex data but requires meticulous hyperparameter tuning.
6) Extreme gradient boosting (XGBoost): An optimized GB framework that incorporates parallel processing, regularization, and GPU acceleration, offering superior performance on large-scale datasets.
7) Light gradient boosting machine (LightGBM): A GB variant designed for speed and scalability, employing histogram-based learning to efficiently handle high-dimensional data.
8) Multilayer perceptron (MLP): A feed-forward neural network with multiple dense layers, adept at modeling non-linear relationships but demanding significant computational resources and training time.
9) Convolutional neural network (CNN): A DL model featuring convolutional layers to extract spatial hierarchies from reshaped input data, followed by dense layers for classification, ideal for pattern recognition in sequential data.
10) Long short-term memory network (LSTM): A recurrent neural network variant designed to capture long-term dependencies in sequential data, utilizing multiple LSTM layers to model temporal patterns effectively.
The dataset is partitioned into training (80%) and testing (20%) sets, with a fixed random seed ensuring reproducibility. This split allows models to be trained on a substantial portion of the data and evaluated on unseen instances, providing a robust assessment of generalization capability. The model configuration parameters considered are tabulated in Table 3.
Table 3. Model configuration parameters
|
Model Name |
Simplified Configuration |
|
Logistic Regression |
Log Loss with L2 Regularization |
|
Decision Tree |
Single Tree, Gini/Entropy, Pruning |
|
Random Forest |
100 Trees, Gini/Entropy, Bagging |
|
Extra Trees |
100 Trees, Gini/Entropy, Extra Randomness |
|
Gradient Boosting |
100 Trees, Depth 6, LR 0.1, Gradient Boosting |
|
XGBoost |
100 Trees, Depth 6, LR 0.1, L1/L2 Regularization |
|
LightGBM |
100 Trees, Depth 6, LR 0.1, Histogram-based |
|
Multilayer Perceptron |
ReLU, 3 Layers (64, 32, Output), Dropout, Adam, 10 Epochs |
|
Convolutional Neural Network |
Conv + Dense Layers, ReLU, Dropout, Adam, 10 Epochs |
|
Long Short-Term Memory |
2 LSTM + 1 Dense, Units: 50, Dropout, Adam, 10 Epochs |
3.3 Model evaluation
Following training, the models are evaluated using a comprehensive suite of performance metrics to provide a thorough assessment of their predictive capability and computational efficiency. The metrics include accuracy, precision, recall, F1-score, root mean squared error (RMSE), mean absolute error (MAE), log loss, area under the curve - receiver operating characteristic (AUC-ROC), and training time.
Among the obtained Model Configuration Results, the RF gives good accuracy. The model consists of 100 DTs, each trained on a randomly sampled subset of the dataset. Trees are allowed to grow fully until leaves are pure or the minimum split threshold is reached. This enables capturing complex feature interactions without predefined depth restrictions. Both Gini Impurity and Entropy criteria were tested for optimal node splitting. These measures assess the quality of a split by evaluating class purity in child nodes. Bootstrap Aggregation (Bagging) ensures that each DT is trained on different random subsets of the data with feature randomness. This reduces overfitting and improves generalization across unseen malware samples.
The feature importance of the dataset is shown in Figure 7. The relative importance of attributes is evaluated using a tree-based ensemble method, with the top features identified and depicted graphically to underscore their predictive power in malware detection, as shown in Figure 7.

Figure 7. Feature importance w.r.t RF
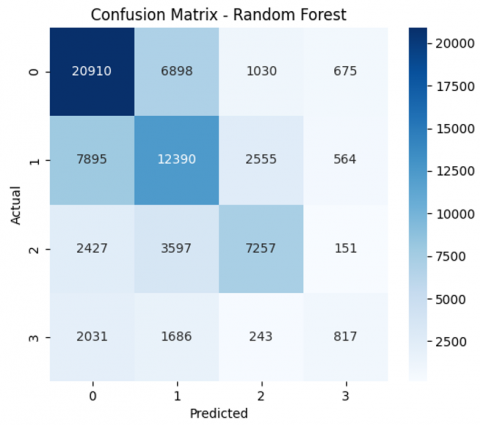
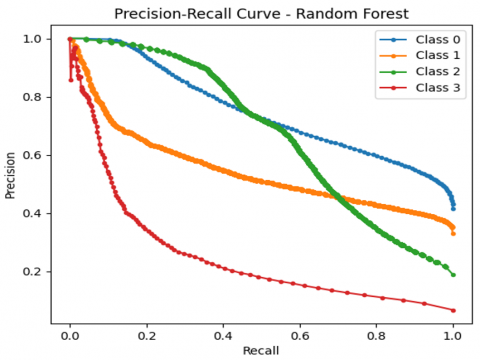
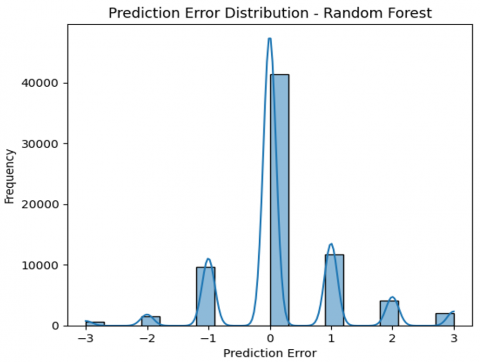
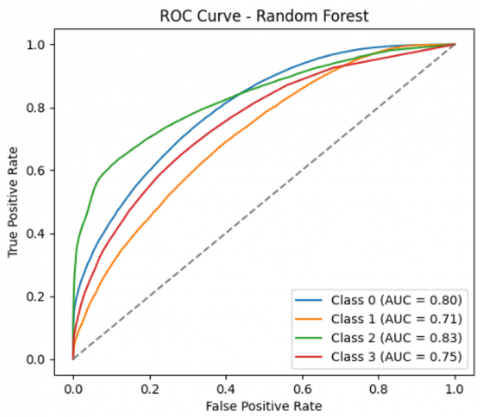
A correlation matrix is computed and visualized to explore relationships between attributes, with the heatmap highlighting strongly correlated features. This analysis informs feature selection by identifying redundant or highly interdependent variables. The confusion matrix shown in Figure 8 represents the performance of an RF classification model across four classes (labeled 0 to 3). The Precision-recall curve presented in Figure 9 for the RF model provides insight into the classification performance across the four classes. The Prediction Error Distribution plot shown in Figure 10 for the RF model reveals how the model's classification errors are distributed. The ROC curve shown in Figure 11 for the RF model illustrates its classification performance for each class regarding the trade-off between the true positive rate (sensitivity) and the false positive rate.
Figure 8. Confusion matrix of RF
Figure 9. Precision-recall curve of RF
Figure 10. Prediction error distribution of RF
Figure 11. ROC curve
The pair plot shown in Figure 12 provides a comprehensive view of feature relationships and class separability across several selected variables used by the RF model: Source Port, Flow IAT Min, Flow Duration, Flow IAT Mean, and Fwd Packets. Each plot illustrates pairwise scatter distributions color-coded by class labels (0 to 3), offering insights into how well the features distinguish between classes. This visualization underlines the importance of feature scaling, outlier handling, or dimensionality reduction techniques like PCA to improve separability and model accuracy. Additionally, it reinforces the need for advanced techniques (e.g., feature engineering or ensemble strategies) to better distinguish between the overlapping class regions.

Figure 12. Pair plot of the top 5 features
Table 4 shows the results obtained by applying various ML models. RF is performing well compared to other ML models. RF is reliable, accurate, and simple to use; it is frequently selected over other ML models for Android malware detection. Given the noisy and unbalanced nature of Android malware datasets, RF's ability to successfully limit the danger of overfitting as an ensemble method that creates many DTs and mixes their outputs makes it particularly useful. Because of its high-dimensional data performance, it can be used to analyze a variety of app aspects, including permissions, API requests, and intents. The modeling procedure is made simpler by the RF's natural handling of both binary and categorical variables, in contrast to models that necessitate intensive preprocessing.
Table 4. Model configuration results
|
Algorithm |
Accuracy |
Precision |
Recall |
F1-Score |
RMSE |
MAE |
Log Loss |
AUC |
Time |
|
Random Forest |
0.8817 |
0.5753 |
0.5817 |
0.5739 |
0.9815 |
0.57 |
1.3021 |
0.7724 |
169.301 |
|
Logistic Regression |
0.4814 |
0.5062 |
0.4814 |
0.4039 |
1.1596 |
0.75 |
1.1143 |
0.6201 |
11.5473 |
|
Decision Tree |
0.5595 |
0.5618 |
0.5595 |
0.5605 |
1.0439 |
0.63 |
15.472 |
0.6771 |
19.8875 |
|
Random Forest |
0.8817 |
0.5753 |
0.5817 |
0.5739 |
0.9815 |
0.57 |
1.3021 |
0.7724 |
169.301 |
|
Extra Trees |
0.5679 |
0.5614 |
0.5679 |
0.5624 |
1.0075 |
0.6 |
2.8532 |
0.7543 |
83.9693 |
|
Gradient Boosting |
0.5047 |
0.5707 |
0.5047 |
0.453 |
1.1081 |
0.71 |
1.0639 |
0.6949 |
1205.19 |
|
XGBoost (GPU) |
0.5561 |
0.5986 |
0.5561 |
0.5295 |
1.0233 |
0.62 |
0.9859 |
0.7547 |
5.43423 |
|
LightGBM |
0.5466 |
0.5976 |
0.5466 |
0.514 |
1.0443 |
0.64 |
1.0008 |
0.7472 |
29.2756 |
|
MLP |
0.4951 |
0.4962 |
0.4951 |
0.4487 |
1.1119 |
0.71 |
1.0677 |
0.6601 |
347.891 |
|
CNN |
0.4967 |
0.5082 |
0.4967 |
0.4297 |
1.1355 |
0.73 |
1.0667 |
0.6643 |
318.952 |
|
LSTM |
0.4809 |
0.4929 |
0.4809 |
0.3854 |
1.1764 |
0.77 |
1.1028 |
0.6217 |
823.831 |
Further, to evaluate the robustness of the RF model, an uncertainty analysis is conducted by training the model using five different random seeds: 21, 42, 77, 100, and 123. The accuracy and AUC scores showed minimal variation across these runs, indicating stable and consistent model behaviour regardless of initial data splits. Table 5 summarizes the results.
Table 5. Model performance with different random seeds
|
Random Seed |
Accuracy |
AUC |
|
21 |
88.15% |
0.770 |
|
42 |
88.17% |
0.772 |
|
77 |
88.10% |
0.769 |
|
100 |
88.21% |
0.773 |
|
123 |
88.12% |
0.771 |
The model’s ability to interpret feature importance also aids security analysts in understanding key behavioral patterns, such as abnormal packet lengths and flow timings, which are often indicative of malicious activities. These findings suggest that this ensemble method can be both effective and practical for deployment in mobile security environments. Looking forward, future research can explore online learning techniques that enable continuous adaptation to newly emerging malware patterns in real-time. Integrating hybrid architectures, such as combining RF with DL models, may also enhance detection accuracy while addressing evolving threats and concept drift in dynamic environments. Additionally, incorporating more granular features, such as app permissions or API call graphs, may further improve model generalization and detection precision.
This study presents a comprehensive framework for Android malware detection using a combination of ML and DL models. The primary contribution lies in evaluating ten different models and with static features like permissions and API calls, the RF classifier achieves the best overall performance, with an accuracy of 88.17%, precision of 0.575, recall of 0.582, F1-score of 0.574, and an AUC of 0.772. These results highlight its effectiveness in detecting malicious behaviors in Android applications while maintaining computational efficiency. Its ensemble nature allowed it to handle high-dimensional feature spaces, reduce overfitting, and provide interpretable feature importance scores, making it one of the suitable approaches for real-world malware detection systems.
But there are still issues like false positives, dataset restrictions, and changing virus tactics. To improve detection accuracy and flexibility in real-world settings, future research will concentrate on incorporating dynamic analysis, increasing dataset diversity, and investigating hybrid models. Additionally, by creating lightweight variations or employing feature selection strategies to lower overhead, future research could investigate optimizing RF for on-device detection, where computational resources are constrained.
[1] Data Security Council of India (DSCI). (2023). India cyber threat report 2023. https://www.dsci.in/files/content/knowledge-centre/2023/India_Cyber_Threat_Report_2023.pdf, accessed on Apr. 18, 2025.
[2] AVG Signal. Malware and virus statistics 2025: The trends you need to know about. https://www.avg.com/en/signal/malware-statistics, accessed on Apr. 18, 2025.
[3] Dahiya, A., Singh, S., Shrivastava, G. (2025). Android malware analysis and detection: A systematic review. Expert Systems, 42(1): e13488. https://doi.org/10.1111/exsy.13488
[4] Seraj, S., Pavlidis, M., Trovati, M., Polatidis, N. (2024). MadDroid: Malicious adware detection in Android using deep learning. Journal of Cyber Security Technology, 8(3): 163-190. https://doi.org/10.1080/23742917.2023.2247197
[5] Manzil, H.H.R., Naik, S.M. (2024). Detection approaches for android malware: Taxonomy and review analysis. Expert Systems with Applications, 238: 122255. https://doi.org/10.1016/j.eswa.2023.122255
[6] Alzahrani, S., Xiao, Y., Asiri, S., Zheng, J., Li, T. (2025). A survey of ransomware detection methods. IEEE Access, 13: 57943-57982. https://doi.org/10.1109/ACCESS.2025.3556187
[7] Salsabila, H., Mardhiyah, S., Hadiprakoso, R.B. (2022). Flubot malware hybrid analysis on android operating system. In 2022 International Conference on Informatics, Multimedia, Cyber and Information System (ICIMCIS), Jakarta, Indonesia, pp. 202-206. https://doi.org/10.1109/ICIMCIS56303.2022.10017486
[8] Ferdous, J., Islam, R., Mahboubi, A., Islam, M.Z. (2023). A review of state-of-the-art malware attack trends and defense mechanisms. IEEE Access, 11: 121118-121141. https://doi.org/10.1109/ACCESS.2023.3328351
[9] Dr.Web. The coper — A new Android banking Trojan targeting Colombian users. https://news.drweb.com/show/?i=14259&lng=en&c=5, accessed on Apr. 11, 2023.
[10] Patel, A., Kumar, N., Handa, A., K Shukla, S. (2023). AProctor — A practical on-device antidote for Android malware. In Proceedings of the 2023 Australasian Computer Science Week, pp. 82-91. https://doi.org/10.1145/3579375.3579386
[11] Spiceworks News & Insights. Xenomorph banking Trojan infects 50,000 Android devices to steal banking credentials. https://www.spiceworks.com/it-security/vulnerability-management/news/xenomorph-android-banking-trojan/, accessed on Apr. 18, 2025.
[12] Muzaffar, A., Hassen, H.R., Lones, M.A., Zantout, H. (2022). An in-depth review of machine learning based Android malware detection. Computers & Security, 121: 102833. https://doi.org/10.1016/j.cose.2022.102833
[13] Kumar, G.S., Bagane, P. (2020). Detection of malware using deep learning techniques. International Journal of Scientific and Technology Research, 9(1): 1688-1691. https://d1wqtxts1xzle7.cloudfront.net/75816567/Detection-Of-Malware-Using-Deep-Learning-Techniques-libre.pdf.
[14] Gibert Llauradó, D., Mateu Piñol, C., Planes Cid, J. (2020). The rise of machine learning for detection and classification of malware: Research developments, trends and challenge. Journal of Network and Computer Applications, 153: 102526. https://doi.org/10.1016/j.jnca.2019.102526
[15] Sandeep, H.R. (2019). Static analysis of Android malware detection using deep learning. In 2019 International Conference on Intelligent Computing and Control Systems (ICCS), Madurai, India, pp. 841-845. https://doi.org/10.1109/ICCS45141.2019.9065765
[16] Vinayakumar, R., Alazab, M., Soman, K.P., Poornachandran, P., Venkatraman, S. (2019). Robust intelligent malware detection using deep learning. IEEE Access, 7: 46717-46738. https://doi.org/10.1109/ACCESS.2019.2906934
[17] Niveditha, V.R., Ananthan, T.V. (2019). Detection of Malware attacks in smart phones using Machine Learning. International Journal of Innovative Technology and Exploring Engineering, 9(1): 4396-4400. https://doi.org/10.35940/ijitee.A5082.119119
[18] Sabhadiya, S., Barad, J., Gheewala, J. (2019). Android malware detection using deep learning. In 2019 3rd International Conference on Trends in Electronics and Informatics (ICOEI), Tirunelveli, India, pp. 1254-1260. https://doi.org/10.1109/ICOEI.2019.8862633
[19] Liu, Y., Wang, Y. (2019). A robust malware detection system using deep learning on API calls. In 2019 IEEE 3rd Information Technology, Networking, Electronic and Automation Control Conference (ITNEC), Chengdu, China, pp. 1456-1460. https://doi.org/10.1109/ITNEC.2019.8728992
[20] Bensaoud, A., Abudawaood, N., Kalita, J. (2020). Classifying malware images with convolutional neural network models. International Journal of Network Security, 22(6): 1022-1031. https://doi.org/10.6633/IJNS.202011_22(6).17
[21] McGiff, J., Hatcher, W.G., Nguyen, J., Yu, W., et al. (2019). Towards multimodal learning for Android malware detection. In 2019 International Conference on Computing, Networking and Communications (ICNC), Honolulu, HI, USA, pp. 432-436. https://doi.org/10.1109/ICCNC.2019.8685502
[22] Sun, Y., Chen, Y., Pan, Y., Wu, L. (2019). Android malware family classification based on deep learning of code images. IAENG International Journal of Computer Science, 46(4): 524-533.
[23] Alhussen, A. (2024). Advanced Android malware detection through deep learning optimization. Engineering, Technology & Applied Science Research, 14(3): 14552-14557. https://doi.org/10.48084/etasr.7443
[24] Liu, K., Xu, S., Xu, G., Zhang, M., et al. (2020). A review of Android malware detection approaches based on machine learning. IEEE Access, 8: 124579-124607. https://doi.org/10.1109/ACCESS.2020.3006143
[25] Liu, Y., Tantithamthavorn, C., Li, L., Liu, Y. (2022). Deep learning for Android malware defenses: A systematic literature review. ACM Computing Surveys, 55(8): 1-36. https://doi.org/10.1145/3544968