Tlou B. Chokwe![]() | Nomathemba Themba*
| Nomathemba Themba*![]() | Linda L. Sibali
| Linda L. Sibali![]()
© 2025 The authors. This article is published by IIETA and is licensed under the CC BY 4.0 license (http://creativecommons.org/licenses/by/4.0/).
OPEN ACCESS
This study investigates the presence and distribution of polychlorinated dibenzo-p-dioxins and dibenzofurans (PCDD/Fs), along with dioxin-like polychlorinated biphenyls (dl-PCBs), in indoor dust collected from residential areas surrounding a municipal solid waste incineration (MSWI) facility in Johannesburg, South Africa. Dust samples were obtained from homes located both upwind and downwind of the facility to evaluate spatial differences in contaminant levels. To assess the toxic potential of the detected congeners, toxic equivalency (TEQ) values were calculated using the WHO 2005 toxic equivalency factors (TEFs). Downwind households exhibited significantly higher TEQ concentrations compared to upwind households, reflecting the influence of wind patterns and proximity to the incineration plant. Key findings identified highly chlorinated congeners, such as OCDD (TEF = 0.0003) and 2,3,7,8-TCDD (TEF = 1.0), as dominant contributors to overall TEQ levels. OCDD was the most abundant congener, contributing 15.44–17.26% of total PCDD/F concentrations, with individual household levels reaching up to 57.64 pg/g. Despite its lower TEF, OCDD’s high prevalence significantly influenced TEQ values in downwind households. Notably, children in these households exhibited higher exposure risks, surpassing acceptable thresholds for both cancer and non-cancer effects. Comparative analysis with global data highlighted the need for stringent regulatory measures and improved emission control systems to address and reduce the potential health risks from exposure to persistent organic pollutants. The study highlights the critical need for ongoing monitoring, community education, and targeted mitigation strategies to address environmental and health challenges posed by incineration activities.
PCDD/Fs, dl-PCBs, indoor dust, hazard index, exposure pathways, cancer risk, risk assessment
Polychlorinated dibenzo-p-dioxins (PCDDs) and polychlorinated dibenzofurans (PCDFs) are notable pollutants produced during the incineration of medical and municipal waste, chemical manufacturing, steel mills, vehicle emissions, and accidental landfill fires [1-4]. PCDD/Fs encompass a total of 210 distinct isomers, comprising 75 dioxins (PCDDs) and 135 furans (PCDFs). Of these, 17 congeners are considered highly toxic, specifically those with chlorine atoms substituted at the 2, 3, 7, and 8 positions. These toxic congeners include include 2,3,7,8-TCDD; 1,2,3,7,8-PeCDD; 1,2,3,4,7,8-HxCDD; 1,2,3,6,7,8-HxCDD; 1,2,3,7,8,9-HxCDD; 1,2,3,4,6,7,8-HpCDD; OCDD; 2,3,7,8-TCDF; 1,2,3,7,8-PeCDF; 2,3,4,7,8-PeCDF; 1,2,3,4,7,8-HxCDF; 1,2,3,6,7,8-HxCDF; 2,3,4,6,7,8-HxCDF; 1,2,3,7,8,9-HxCDF; 1,2,3,4,6,7,8-HpCDF; 1,2,3,4,7,8,9-HpCDF; and OCDF [5]. Despite incineration being the recommended method for treating medical risk waste in South Africa, the use of incinerators remains controversial due to the fact that they tend to emit pollutants such as PCDD/Fs, which are classified as toxic, carcinogenic, teratogenic, and mutagenic [6-8]. PCDD/F emissions present serious threats to both environmental ecosystems and public health [5], necessitating stringent control and monitoring of emissions from incinerators [6]. Recent epidemiological studies from China [9], France [10], Korea [11] and the United States [12, 13] state that high concentrations of PCDD/Fs near waste incineration plants may significantly increase the likelihood of inflammatory conditions, liver dysfunction, and cardiovascular diseases among communities living in close proximity.
The formation of PCDD/Fs and dioxin-like polychlorinated biphenyls (dl-PCBs) in incinerators is highly dependent on combustion conditions, especially temperature and oxygen availability. These compounds can be generated via two primary mechanisms: precursor formation and de novo synthesis. Precursor formation occurs at high temperatures when chlorinated aromatic compounds are present, while de novo synthesis is more common at lower post-combustion temperatures (200–450℃), where carbonaceous residues interact with metal catalysts such as copper on fly ash surfaces [8, 14]. Studies have shown that insufficient furnace temperature or poor waste segregation significantly influences the dominance of certain congeners like OCDD and 2,3,7,8-TCDF in flue gas and residues [9]. In high-temperature conditions (≥ 850℃), the destruction efficiency of PCDD/Fs increases, but improper temperature control in rotary kiln incinerators, as commonly observed in developing regions, results in incomplete combustion and elevated PCDD/F emissions. Recent investigations in China, Serbia, and Vietnam [8, 15, 16] have documented similar congener patterns and toxic equivalency (TEQ) contributions in downwind residential areas. These studies reaffirm the global concern regarding localised exposure to dioxin-like compounds, especially among vulnerable populations living near under-regulated municipal solid waste and hazardous waste incinerators (HWI).
PCBs, on the other hand, are synthetic organic chemicals with various industrial uses, characterized by long-term environmental persistence and associated health risks. Because of their chemical stability, lipophilicity and hydrophobicity, PCBs can accumulate in indoor dust, posing significant health risks to inhabitants through ingestion and dermal contact, particularly in residential areas near industrial sites and incineration facilities [17]. The substantial threat to environmental safety and human health posed by PCDD/Fs, dl-PCBs and gas emissions requires urgent and effective control and monitoring. According to the International Agency for Research on Cancer (IARC) [18], two specific congeners i.e. 2,3,7,8-TCDD and 2,3,4,7,8-PeCDF have been designated as Group 1 carcinogens, indicating they are carcinogenic to humans. These substances have been associated with cancers affecting the respiratory tract, prostate, as well as specific types of lymphomas and sarcomas. Although the potential carcinogenicity of other congeners is under suspicion, conclusive evidence has not yet been established. To assess the potential health risks of PCDD/Fs and dl-PCBs emitted from incinerators, it is essential to quantitatively evaluate their emission levels and environmental release under realistic operational conditions. A comprehensive diagnostic investigation is also needed to compare PCDD/Fs and dl-PCBs indoor dust levels at various functional sampling points near the incineration facility simultaneously, identifying how different levels influence health risks [19]. Consequently, municipal waste incinerators may continue to play a substantial role in the overall emission inventories of PCDD/Fs and dl-PCBs in South Africa [20].
Fundamental data from incineration sources should be investigated to facilitate emissions regulation and source reduction. Evaluating emission coefficients, PCDD/Fs and dl-PCBs fingerprints, and individual exposure assessments can assist regulators in enforcing more stringent measures to reduce emissions [15]. Given the importance of controlling PCDD/Fs and dl-PCBs to protect public health in densely populated urban settings, it is imperative to identify their characteristics, sources, and associated health risks within everyday environments commonly inhabited by urban residents [9]. Exposure to PCDD/Fs and dl-PCBs can take place via inhalation of contaminated air, ingestion, or absorption through the skin. Individuals residing in close proximity to a municipal solid waste incineration (MSWI), especially those located downwind, may be at heightened risk of experiencing negative health outcomes [19]. This study evaluated PCDD/F and dl-PCB concentrations in indoor dust from households near the incineration facility. The estimated daily intake through dermal contact as well as ingestion were estimated for assessment of cancer-related risks. The study was conducted over a span of four months at a rotary kiln HWI in South Africa. Similar studies [3, 8, 9, 15] have been conducted across various parts of the globe involving HWI and medical waste incinerators, with each reaching different conclusions. This research aims to provide a baseline understanding of the emission levels, exposure risks, and adverse health effects linked to PCDD/Fs and dl-PCBs in residential areas near an incineration facility.
2.1 Sample location
This study focuses on 10 households situated in proximity to an MSWI, with sampling locations selected both upwind and downwind of the facility. The objective is to assess the concentration levels and spatial distribution of PCDD/Fs and dl-PCBs in indoor dust. The MSWI, located within the Ekurhuleni Metropolitan Municipality in Johannesburg, South Africa, has been in full operation since 2001. The selected homes are approximately evenly distributed around the incineration facility and are within 5 km of the MSWI (Figure 1). The study investigates how waste incineration influences the concentrations of PCDD/Fs and dl-PCBs in indoor dust. All homes were more than 30 years old, with 40% homes exceeding 50 years in age. Additionally, 55% of residents had undertaken renovations in the past 15 years. Dust samples were collected between June - October 2021, primarily from brick and tile and carpeted homes in urban areas, close to industrial sites. These sampling points cover a comprehensive range of directions around the incineration plant, ensuring a thorough assessment of dust contamination and its potential distribution relative to the plant. Given that the houses are in the Johannesburg area, South Africa, the typical wind patterns in the area were considered to determine which houses are downwind and which are upwind of the incineration plant.
Figure 1. Sampling points (houses) covering a range of directions around the incineration plant
The selection of 10 households was guided by spatial representation and operational feasibility. Given the intensive laboratory analysis (HRGC/HRMS) and high cost per sample, the sample size was designed to reflect a balance between scientific rigor and resource limitations, while ensuring directional coverage (upwind vs. downwind) relative to the incinerator. This approach is consistent with similar indoor dust studies using targeted spatial designs and ≤ 15 sample sites [9, 15]. While the sample size limits inferential generalization, it is sufficient for exploratory comparison of pollutant trends around the facility.
2.2 Materials
For quantification, calibration standards and 13C₁₂-labelled reference compounds including the 17 EPA-regulated 2,3,7,8-substituted PCDD/Fs and dioxin-like PCBs, were acquired from AfriFusion (Pty) Ltd, based in Midrand, South Africa, following the specifications outlined in EPA Method 1613. These calibration standards spanned concentration ranges of 0.1–400 ng/mL for PCDD/Fs and 0.1–200 ng/mL for the 13C₁₂-labelled compounds. The same supplier also provided surrogate standard solutions (EPA-1613 LCS) and internal standard solutions (EPA-1613 ISS) required for PCDD/Fs analysis. All standards and calibration mixtures were refrigerated at 4℃ until use.
Organic solvents used for trace-level analysis—such as dichloromethane, toluene, cyclohexane, isooctane, and n-hexane—were sourced from Chemspeed Technologies (USA), with ethyl acetate and nonane obtained from the same vendor. Additional materials included silica gel from AfriFusion (Pty) Ltd, basic alumina (ICN) from MP Biomedicals (Germany), and Carbopack C 80/100 supplied by Fluka (Switzerland). Reagents such as benzene (analytical grade, ≥ 99.7% purity) and diethyl ether (EMSURE®, ≥ 99.7% purity) were purchased from Merck South Africa. Tetrahydrofuran (Photrex™, ≥ 99% purity) was also provided by AfriFusion (Pty) Ltd.
For the gas chromatographic analysis, high-purity helium (Alphagaz™ 1, ≥ 99.999%) from Air Liquide (Madrid, Spain) was used as the carrier gas, while nitrogen gas (purity > 99.995%) from Linde (Barcelona, Spain) functioned as the make-up gas for the GC-APPI ionisation source.
2.3 Sampling collection and preparation
Clean plastic brushes and dustpans were used to collect fine particulates through a gentle sweeping motion. To ensure sample accuracy, the brushes were thoroughly cleaned with acetone before use. Prior to sampling, the residents were instructed not to clean the indoor areas for three days, a standard protocol designed to allow sufficient dust accumulation, thereby ensuring a representative sample. Dust was collected from various areas within homes, including living rooms, family rooms, kitchen floors, children's play areas, light fixtures, and electronic equipment such as televisions. The individual samples were then combined to create a composite sample for analysis. The dust samples collected were passed through a 154 µm mesh sieve to isolate the fine particulate fraction, which is more prone to adhere to human skin and is likely to contain elevated levels of persistent organic pollutants (POPs). Visible contaminants such as hair and large debris were manually removed prior to processing. Each of the ten samples (n = 10) was individually wrapped in aluminium foil and subjected to freeze-drying under laboratory conditions. Prior to extraction and chromatographic analysis, the sieved dust was thoroughly homogenized to ensure consistency. Sampling was conducted during the period from June to October 2021 because this timeframe coincides with South Africa's wind seasons, typically observed between July and August. These wind conditions are known to suspend particulate matter and increase the deposition of contaminants, leading to higher concentrations of pollutants in both outdoor and indoor environments. This sampling period was chosen to capture the highest potential concentrations of POPs, including PCDD/Fs and dl-PCBs, ensuring the data reflect peak exposure scenarios. Considering the whole-house ventilation conditions, it was assumed that the levels and congener distribution of PCDD/Fs and dl-PCBs in indoor dust would be indicative of those present in the ambient outdoor air, implying that both environments may share similar contamination sources. This structured approach ensured that the sampling campaign provided reliable and representative data for analysis.
2.4 Extraction and clean-up of extracts
A 2 g portion of each dust sample was fortified with a recovery standard comprising 21 congeners of 13C₁₂-labelled PCDD/Fs and 12 congeners of 13C₁₂-labelled dl-PCBs, each at a concentration of 100 ng per sample. The addition of dl-PCBs enabled a comprehensive assessment of dioxin-like compounds within the samples. Extraction was carried out individually using a Soxhlet apparatus, beginning with 60 mL of hexane over an 18-hour period, followed by 30 mL of toluene for an additional 6 hours. The hexane and toluene extracts were merged prior to concentration, streamlining the process by removing the need to recombine them at a later stage. The unified extract was then concentrated using both a rotary evaporator and a Turbo Vap II system to efficiently reduce its volume. The concentrated residue was transferred into a 250 mL round-bottom flask using 20 mL of hexane. The solution was subsequently evaporated down to approximately 2 mL in preparation for fractionation. From this concentrated extract, 40% (equivalent to 20 mL) was set aside for analytical evaluation, while the remaining 60% (30 mL) was preserved for archival purposes. Both the hexane and toluene fractions intended for archival purposes were combined into the same vials before the concentration step, streamlining the process.
The extracts were purified using a multilayer chromatography column with a 20 mm internal diameter. The column was packed sequentially with a top layer of sodium sulfate, followed by 1 g of activated silica, 2 g of basic silica, 4 g of acidic silica (44% w/w), another 1 g of activated silica, and a final layer of sodium sulfate. To eliminate any residual organic contaminants, both the silica and sodium sulfate were baked at 450℃ overnight before use. Elution was performed using 150 mL of a 1:1 (v/v) mixture of n-hexane and dichloromethane. The collected eluate was concentrated to approximately 2 mL and further purified using a gel permeation column packed with 6 g of Biobeads SX3.
Following the introduction of the sample onto the gel column, elution was carried out with 200 mL of a dichloromethane/cyclohexane (1:1, v/v) solution. The eluates were then reduced to dryness under a gentle stream of nitrogen gas. Prior to instrumental analysis, the dried residue was reconstituted in 50 µL of nonane, and an internal standard (ISTD) was added to facilitate accurate quantification. A 1 µL aliquot of the final solution was injected into a high-resolution gas chromatograph coupled with high-resolution mass spectrometry (HRGC/HRMS) for detailed compound analysis.
2.5 Instrumental analysis
The quantification of PCDD/Fs and dl-PCBs was conducted using a Trace 1300 gas chromatograph (Thermo Fisher Scientific, San Jose, CA, USA) coupled with a Q-Exactive Orbitrap mass spectrometer, featuring an atmospheric pressure photoionization (APPI) source provided by MassCom Technologies GmbH (Bremen, Germany). Chromatographic separation of the PCDD/Fs was achieved using a DB-5ms UI fused-silica capillary column (60 m × 0.25 mm I.D., 0.25 µm film thickness) from Chemspeed Technologies, USA.
The injector was set to operate at 280℃ in splitless mode for 1 minute, with helium as the carrier gas, maintained at a constant flow rate of 1.0 mL/min. A consistent injection volume of 1.0 µL was used across both PCDD/F and dl-PCB analyses. For PCDD/Fs, the oven temperature program began at 140℃ (held for 1 min), increased to 200℃ at a rate of 20 ℃/min (held for 1 min), and was further ramped to 300℃ at 2.5 ℃/min (held for 20 min). The temperatures for the transfer line and capillary were maintained at 280℃ and 225℃, respectively, with the ion source set at 250℃. The same DB-5ms UI column was used for the separation of dl-PCBs to ensure consistency in analytical conditions. The injector conditions remained identical, and the oven temperature program was slightly modified to optimize the separation: starting at 140℃ (held for 1 min), ramped to 210℃ at 15℃/min (held for 2 min), and finally raised to 310℃ at 3℃/min (held for 15 min). The transfer line, capillary, and source temperatures were consistent with those used for the PCDD/F analysis.
2.6 Description of experimental procedures
Exposure to PCDD/Fs and dl-PCBs, particularly in residential areas near incineration facilities, poses significant health risks. To accurately assess these risks, both ingestion and dermal exposure pathways were evaluated using Eqs. (1)-(5) and the cancer risk and hazard index were assessed using Eqs. (6)-(11) below:
2.6.1 Dust ingestion exposure assessment
Dust ingestion for adults
$E D I_{d u s t}=I_{d u s t} \times \frac{\left(\sum C_{d u s t, i}\right)}{B W}$ (1)
where,
a) EDIdust represents the estimated daily intake from dust (ng/kg/day).
b) Idust is the ingestion rate of dust i.e., 20 mg/day for adults and 50 mg/day for children.
c) ∑Cdust,i is the sum of concentrations of contaminants in dust.
d) BW is the body weight (12 kg for infants, 45 kg for teenagers and 70 kg for adults).
To estimate the EDI using high dust ingestion rates for different population groups, we used the following information (Table 1):
a) Body Weight (BW): infants: 12 kg, children: 16 kg, teenagers: 45 kg and adults: 70 kg.
b) Dust Ingestion Rate (Idust): Infants: 100 mg/day, Children: 200 mg/day, Teenagers: 50 mg/day, Adults: 30 mg/day.
c) Concentration of Contaminants in Dust (ΣCdust,i): Assumed to be 500 ng/g.
Table 1. The EDI values for different population groups using high dust ingestion rates
|
Population Group |
EDI (ng/kg/day) |
|
Infants |
4.166 |
|
Children |
6.25 |
|
Teenagers |
0.55 |
|
Adults |
0.214 |
2.6.2 Dermal exposure
The formula calculates the average daily amount of contaminant absorbed through the skin based on various exposure factors. The numerator includes the factors that contribute to the amount of contaminant coming into contact with and being absorbed by the skin, while the denominator adjusts this amount based on body weight and the period over which exposure is averaged.
$C D I_{{dermal }}=\frac{C_{ {dust }} \times C F \times E F \times E D \times S A \times A F \times A B S}{B W \times A T}$ (2)
This formula was used to calculate the chronic daily intake (CDI) of a contaminant through dermal (skin) exposure from dust. Each term in the formula represents a specific factor that influences the amount of contaminant absorbed through the skin over a period of time.
where,
a) CDIdermal: CDI through dermal exposure. It represents the average daily dose of a contaminant absorbed through the skin over a long-term period.
b) Cdust: Concentration of the contaminant in dust (e.g., mg/kg or µg/g). This is the amount of contaminant per unit of dust.
c) CF: Conversion Factor. This factor is used to convert units if necessary, often to ensure consistency in the units used for concentration and exposure terms.
d) EF: Exposure Frequency. The number of days per year that exposure occurs (e.g., days/year).
e) ED: Exposure Duration. The total duration of exposure in years (e.g., years).
f) SA: Skin Surface Area exposed to the contaminant (e.g., cm²). This represents the area of skin that comes into contact with the contaminated dust. For children e.g., hands, arms, and legs, and for adults, typically include the hands, forearms, and face.
g) AF: Adherence Factor. This indicates the amount of dust that adheres to the skin per unit area per event (e.g., mg/cm²).
h) ABS: Absorption Factor. The fraction of the contaminant that is absorbed through the skin (dimensionless, often a percentage expressed as a decimal).
i) BW: Body Weight (e.g., kg). The weight of the person exposed to the contaminant.
j) AT: Averaging Time. The period over which the exposure is averaged (e.g., days). For non-cancer effects, this is typically the number of days over the exposure duration (ED × 365 days/year). For cancer effects, it might be the lifetime averaging time (e.g., 70 years × 365 days/year).
2.6.3 Cancer risk
The cancer risk (CR) was estimated separately for each exposure scenario (ingestion and dermal contact), for both normal and high exposures to capture the range of potential risks.
$C R_{ {dust }}=\frac{C D I_{ {ingestion }} \times C S F_{ {ingestion }}+C D I_{{dermal }} \times C S F_{{dermal }}}{C S F_{{dermal }}}$ (3)
Normal Exposure:
CRingestion, normal = CDIingestion, normal × CSFingestion (4)
High Exposure:
CRingestion, high = CDIingestion, high × CSFingestion (5)
CR from Dermal Exposure (CRdermal):
Normal Exposure:
CRdermal, normal = CDIdermal, normal × CSFdermal (6)
High Exposure:
CRdermal, high = CDIdermal, high × CSFdermal (7)
Total CR:
To assess the overall risk, the individual risks from ingestion and dermal exposure were summed for each scenario (normal and high):
Total CR (normal exposure):
CRtotal, normal = CRingestion, normal + CRdermal, normal (8)
Total CR (high exposure):
CRtotal, high = CRingestion, high + CRdermal, high (9)
where,
a) CRdust: CR from exposure to contaminated dust (unitless probability, e.g., 1 in 1,000,000).
b) CDIingestion: CDI through ingestion (mg/kg/day).
c) CSFingestion: Cancer Slope Factor for ingestion ((mg/kg/day)⁻¹).
d) CDIdermal: CDI through dermal exposure (mg/kg/day).
e) CSFdermal: Cancer Slope Factor for dermal exposure ((mg/kg/day)⁻¹).
Separate estimation allowed for a detailed risk assessment of each exposure route (oral and dermal), reflecting different behaviours, exposure frequencies, and absorption rates. Normal and high scenarios provided a range of risk estimates, from typical exposure conditions to worst-case scenarios, ensuring a comprehensive evaluation of potential CRs.
2.6.4 Hazard index
This formula was used to calculate the hazard index (HI) for exposure to contaminants in dust through two pathways: ingestion and dermal (skin) contact. The HI is used to evaluate the potential non-carcinogenic health risks associated with exposure to hazardous substances. It is calculated by summing the ratios of the CDI to the reference dose (RfD) across different exposure routes, specifically ingestion and dermal contact. This composite value provides an estimate of the overall non-cancer risk posed by a contaminant through combined exposure pathways. To calculate the HI for ingestion and dermal contact exposure under normal and high exposure scenarios, we used the following equations.
Ingestion exposure:
$H I_{ {ingestion }}=\frac{C D I_{ {ingestion, adult }}}{R f D}+\frac{C D I_{ {ingestion }}}{R f D}$ (10)
Dermal exposure:
$H I_{ {dermal }}=\frac{C D I_{ {dermal, adult}}}{R f D}+\frac{C D I_{{dermal, child }}}{R f D}$ (11)
where,
a) CDIingestion, adult and CDIingestion, child are the CDI values for ingestion exposure.
b) CDIdermal, adult and CDIdermal, child, are the CDI values for dermal exposure.
c) RfD is the reference dose.
2.7 Quality assurance
To ensure the accuracy and reliability of the analytical results, several quality assurance measures were implemented throughout the study. Quantification of PCDD/Fs was conducted using 21 13C₁₂-labelled internal standards. Analyte identification and quantification were based on stringent criteria, including a retention time within ± 2 seconds of the internal standard, isotope ratios within ± 20% of the expected values, and a signal-to-noise ratio equal to or greater than 3. In the absence of certified reference materials (CRMs) for dust, an alternative spiking procedure using anhydrous sodium sulfate was adopted to assess the efficiency of the extraction and clean-up processes across various concentration levels. Analytical blanks composed solely of solvents were processed at a frequency of one blank per twelve samples to monitor potential contamination. The method detection limits (MDLs) were determined as three times the standard deviation of concentrations measured in the analytical blanks. In instances where analyte concentrations in the blanks were below the instrumental detection limit, the MDL was set equivalent to that detection limit. All reported values were adjusted by subtracting concentrations found in the field blanks. Field blanks were prepared for each sampling event and were utilized in the calculation of MDLs. When compounds were not detected in the field blanks, quarterly laboratory blanks were used as the basis for MDL estimation. Final results are reported in nanograms per gram (ng/g) of dust and expressed as toxic equivalents (WHO 2005-TEQ), offering a comprehensive perspective on contaminant levels in the study area.
2.8 Statistical analysis
Descriptive and inferential statistics were used to evaluate PCDD/F and dl-PCB concentrations and exposure risks across sampled households. Data were analysed using SPSS version 26. Mean TEQ values were compared between upwind and downwind households using independent samples t-tests to assess statistical significance (p < 0.05). In cases where normality was not met, non-parametric Mann–Whitney U tests were applied. Additionally, 95% confidence intervals (CIs) were calculated for mean TEQ values to estimate the precision of group differences. CR and HI values were analysed for variance using one-way ANOVA across demographic categories (infants, children, teenagers, adults). Levene’s test was applied, where applicable, to assess the homogeneity of variances and confirm the validity of statistical assumptions. All statistical analyses were conducted using two-tailed tests, with a significance threshold set at p < 0.05. Results below this value were deemed statistically significant. This analytical framework supports validation of observed trends, particularly differences in contaminant levels and risk estimates between downwind and upwind areas.
This study investigates the levels of PCDD/Fs in indoor dust collected from residences located both upwind and downwind of an MSWI facility. To assess the potential toxicity of these compounds, TEQ values were determined using the World Health Organization’s 2005 toxic equivalency factors (TEFs). This method allows for the expression of individual congener concentrations in terms of their relative toxicity, benchmarked against 2,3,7,8-tetrachlorodibenzo-p-dioxin (2,3,7,8-TCDD), which is recognized as the most toxic and extensively studied congener. The results reveal significant variability in TEQ concentrations across households, with distinct differences observed between upwind and downwind locations, emphasizing the role of wind direction and proximity to the emission source in contaminant distribution.
3.1 PCDD/F and dl-PCBs congener concentrations and TEQ distribution in indoor dust from households near the incineration plant
This section examines the concentrations of individual PCDD/F and dl-PCB congeners and their respective contributions to the overall TEQ in indoor dust collected from households in proximity to the incineration facility. The analysis investigates the distribution of these congeners to identify dominant contributors to TEQ levels and assess their spatial variability in relation to the plant's location. The findings provide valuable insights into the sources and pathways of contamination, particularly the influence of incineration emissions and other environmental and household factors, on the accumulation of pollutants in indoor environments.
3.1.1 Upstream vs. downstream TEQ results
Households located downwind of the incineration facility, positioned to the northwest, consistently exhibited higher TEQ values compared to those situated upwind to the southeast. This reflects the significant role of wind patterns in the distribution of PCDD/Fs and dl-PCBs (Table 2). The TEQ values across all sampled households ranged from 34.99 pg TEQ/g (H1, downwind) to 53.30 pg TEQ/g (H7, upwind). Among the downwind households, H5 (47.56 pg TEQ/g), H3 (39.96 pg TEQ/g), and H2 (43.59 pg TEQ/g) showed the highest TEQ concentrations. These findings align with previous research indicating that incineration plants serve as significant point sources of POPs, releasing particulate-bound PCDD/Fs and dl-PCBs that are subsequently transported and deposited in downwind areas via prevailing winds [14, 15]. In the current study, the average TEQ concentration of PCDD/Fs in indoor dust from downwind residences was nearly sixfold greater than the levels detected in upwind homes, emphasizing the influence of prevailing wind patterns in contaminant distribution. The higher TEQ values detected in downwind households may be attributed to the adsorption of PCDD/Fs onto fine particulate matter (PM₂.₅ and PM10) emitted from the incineration stack. Studies have demonstrated that these particulates act as carriers of POPs, allowing their long-range transport and eventual deposition in residential areas [13]. The high concentrations of congeners such as 2,3,7,8-TCDD and OCDD in households like H5 indicate that proximity to the incinerator and the direction of prevailing winds are critical factors driving contamination levels.
Table 2. PCDD/F concentrations and TEQ in dust from upwind and downwind household of the incineration plant
|
Area |
2,3,7,8-TCDD |
1,2,3,7,8-PeCDD |
1,2,3,4,7,8-HxCDD |
1,2,3,6,7,8-HxCDD |
1,2,3,7,8,9-HxCDD |
1,2,3,4,6,7,8-HpCDD |
||||||||
|
H1 |
4.93 |
8.27 |
15.64 |
20.12 |
25.89 |
30.56 |
||||||||
|
H2 |
7.82 |
10.93 |
18.75 |
22.54 |
27.91 |
33.24 |
||||||||
|
H3 |
6.45 |
9.72 |
16.83 |
21.06 |
26.55 |
31.79 |
||||||||
|
H4 |
5.32 |
8.57 |
14.92 |
19.23 |
24.85 |
29.65 |
||||||||
|
H5 |
8.16 |
11.54 |
20.02 |
24.81 |
30.73 |
36.25 |
||||||||
|
H6 |
7.02 |
10.35 |
17.92 |
22.34 |
27.98 |
33.11 |
||||||||
|
H7 |
9.32 |
12.67 |
22.01 |
27.85 |
34.22 |
39.88 |
||||||||
|
H8 |
6.98 |
10.21 |
17.45 |
21.78 |
27.01 |
32.34 |
||||||||
|
H9 |
8.45 |
11.78 |
20.56 |
25.12 |
31.01 |
36.78 |
||||||||
|
H10 |
5.78 |
9.12 |
15.67 |
20.01 |
25.12 |
29.78 |
||||||||
|
OCDD |
2,3,7,8-TCDF |
1,2,3,7,8-PeCDF |
2,3,4,7,8-PeCDF |
1,2,3,4,7,8-HxCDF |
1,2,3,6,7,8-HxCDF |
2,3,4,6,7,8-HxCDF |
1,2,3,7,8,9-HxCDF |
TEQ |
||||||
|
50.11 |
6.22 |
10.45 |
12.78 |
18.92 |
22.37 |
28.45 |
35.62 |
34.99 |
||||||
|
55.19 |
9.12 |
12.65 |
15.32 |
21.84 |
25.19 |
31.62 |
38.25 |
43.59 |
||||||
|
52.47 |
8.25 |
11.98 |
14.73 |
20.95 |
24.98 |
30.75 |
37.42 |
39.96 |
||||||
|
49.12 |
7.12 |
10.45 |
13.22 |
19.01 |
22.87 |
28.24 |
34.96 |
35.6 |
||||||
|
57.64 |
10.75 |
14.23 |
17.34 |
24.67 |
28.98 |
35.87 |
42.69 |
47.56 |
||||||
|
54.27 |
9.45 |
12.78 |
15.98 |
22.01 |
26.12 |
32.67 |
39.18 |
43.13 |
||||||
|
61.92 |
12.35 |
15.98 |
19.23 |
26.45 |
31.45 |
38.96 |
45.78 |
53.3 |
||||||
|
53.29 |
9.05 |
12.56 |
15.67 |
21.78 |
25.89 |
32.01 |
38.92 |
42.1 |
||||||
|
58.11 |
11.22 |
14.67 |
18.01 |
24.33 |
29.01 |
35.45 |
41.78 |
48.3 |
||||||
|
51.01 |
7.89 |
11.34 |
14.56 |
20.12 |
24.56 |
30.01 |
36.45 |
37.27 |
||||||
In contrast, upwind households, including H6 (43.13 pg TEQ/g), H7 (53.30 pg TEQ/g), and H10 (37.27 pg TEQ/g), displayed a wide range of TEQ levels, indicating variability even in areas theoretically less influenced by emissions from the incineration plant. Interestingly, H7 exhibited the highest TEQ concentration among all households, which may be due to localized wind shifts, secondary contamination sources such as road dust, or emissions from unrelated industrial activities in the area. Such variability highlights the complexity of environmental contamination, where secondary sources and microclimatic factors, including turbulence and local wind eddies, can alter the spatial distribution of pollutants. Geographically, the household nearest to the incineration plant (H1) exhibited the highest mean PCDD/F concentration, consistent with findings from other studies where proximity to the emission source strongly correlates with contaminant levels. Unexpectedly, H7, located farther north and upwind, presented elevated levels, potentially influenced by localized factors such as wind eddies, secondary contamination sources, or microclimatic conditions.
These findings emphasize the importance of both proximity and wind direction for mapping the spatial variability of PCDD/Fs and dl-PCBs. The relatively lower TEQ concentrations in some upwind households, such as H10, can also be linked to reduced deposition of particulate-bound contaminants in areas not directly exposed to prevailing winds. However, these households are not entirely free from contamination, as PCDD/Fs and dl-PCBs are semi-volatile compounds that can be transported through the atmosphere and deposited onto indoor surfaces [21]. Moreover, building characteristics, such as ventilation systems, the presence of open windows, and the accumulation of dust, may exacerbate or mitigate indoor contamination levels. Older buildings, particularly those constructed before the 1980s, may retain higher levels of POPs due to the historical use of materials prone to absorbing these contaminants [22]. In this study, temperature and humidity effects were accounted for by standardizing the indoor dust concentration data (TEQ-FHO) to a temperature of 21℃ and indoor humidity of 50% using regression analysis. These adjustments helped isolate the contribution of geographic and environmental factors to the observed contamination patterns. The highest contaminant levels were observed in downwind areas, consistent with previous research suggesting that emission-heavy facilities have a greater impact on downwind regions [9, 17]. Localized factors, including building characteristics, microclimatic conditions, and household activities (e.g., cooking with biomass or coal), further contributed to the observed variability.
3.1.2 Congener contributions to TEQ
The TEQ in both downwind and upwind households was primarily driven by a combination of highly toxic congeners, such as 2,3,7,8-TCDD, 1,2,3,7,8-PeCDD, and 1,2,3,6,7,8-HxCDD, alongside the more prevalent but less toxic congener OCDD. These findings align with other studies showing that OCDD, along with other highly chlorinated congeners such as 1,2,3,4,6,7,8-HpCDD, 1,2,3,4,6,7,8-HpCDF, and OCDF, were dominant in indoor dust samples—contributing 74.0% and 68.6% to the total ∑PCDD/F concentrations in downwind and upwind households, respectively. This pattern suggests that these congeners’ stability and resistance to degradation contribute to their persistence in indoor environments. Notably, in the current study, OCDD emerged as the most abundant congener, contributing between 15.44% and 17.26% of the total PCDD/F concentrations.
Households located downwind of the incineration facility (H1, H2, H3, H4, and H5) consistently exhibited higher concentration values, driven by elevated contributions from highly chlorinated and toxic congeners. Among these, H5 recorded the highest concentration value of 47.56 pg TEQ/g, primarily due to notable levels of 1,2,3,7,8-PeCDD measured at 11.54 pg/g and OCDD (57.64 pg/g). Similarly, H3 and H2 exhibited high concentration values of 39.96 pg TEQ/g and 43.59 pg TEQ/g, respectively, with notable contributions from 1,2,3,6,7,8-HxCDD and 2,3,4,7,8-PeCDF. These findings emphasize the substantial influence of waste combustion processes at the incineration facility as a key source of elevated PCDD/F concentrations in indoor dust. Themba et al. [4] attribute this to the formation of PCDD/Fs in fly ash generated during incineration, which supports the observed contamination patterns. Elevated PCDD/F levels are often generated due to inadequate operating conditions, such as insufficient furnace temperatures during initial combustion or ash remaining within the critical temperature range (200–450℃), promoting the formation of PCDD/Fs via de novo synthesis and their transfer from the gaseous to the particulate phase [4].
Interestingly, upwind households (H6, H7, H8, H9, and H10) generally exhibited lower TEQ values, though significant variability was observed. H7 recorded the highest TEQ across all households (53.30 pg TEQ/g), despite its upwind location, potentially due to localized wind shifts, secondary contamination sources, or specific household factors. Elevated levels of 2,3,7,8-TCDD (9.32 pg/g) and OCDD (61.92 pg/g) were key contributors to its high TEQ value. Across all households, levels of furan congeners were consistently higher than dioxins, with F/D ratios ranging from 0.45 to 1.65, indicating diverse contamination sources. These findings align with previous studies, where furans dominated the indoor dust profiles near waste incinerators due to the combustion process favouring their formation under suboptimal conditions. Other possible contributors to indoor PCDD/F contamination include human and pet hair, shed skin cells, and tobacco smoke [23]. While these sources may contribute to the complexity of congener profiles, the dominant influence of waste combustion activities is clearly observable. In the absence of internationally recognized standards for PCDD/F concentrations in indoor dust, this study adopted the Swiss soil guideline value of 5.0 ng TEQ/g as a reference point for evaluating contamination levels. The TEQ levels in some households, particularly downwind locations like H5, exceeded this threshold, indicating significant pollution and potential health risks.
The variability in congener contributions and concentration levels between upwind and downwind households reflects the influence of wind-driven dispersion of emissions and local environmental factors such as building materials and ventilation systems. For instance, households near the incinerator (e.g., H1 and H2) exhibited higher contributions from highly chlorinated congeners, consistent with previous findings where proximity to waste incineration facilities correlated with elevated PCDD/F concentrations. Conversely, H7, located farther north and upwind, presented elevated levels, suggesting that secondary contamination sources or microclimatic conditions may have contributed to its unexpectedly high TEQ. Furthermore, the ratio of F/D in indoor dust, with values ranging from 0.27 to 1.55 and an average of 0.82, highlights the complexity of contamination sources in these households. While the predominant contribution of OCDD and related congeners to the overall TEQ highlights their persistence and stability, the higher prevalence of furans suggests diverse contamination pathways, including emissions from waste incineration and potential secondary sources. A strong positive correlation was identified between the log-transformed concentrations of PCDDs and PCDFs (Pearson’s r = 0.87, p < 0.001), implying that these compounds may originate from similar sources or undergo related transformation mechanisms. In contrast, the correlation between PCDD/Fs and dl-PCBs was notably weaker (r = 0.56, p < 0.05), indicating only a partial overlap in their emission sources. These observations align with previous research findings reported by Lei et al. [14] and Herrero et al. [17], which reported similar patterns in areas near industrial facilities.
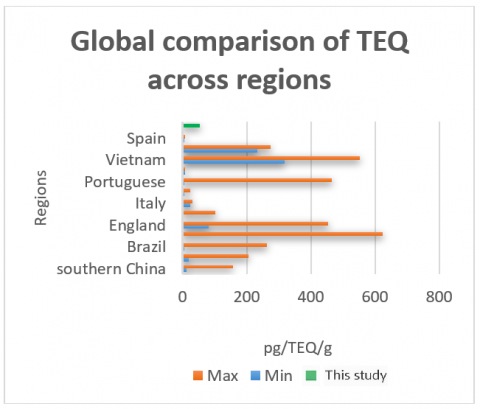
3.1.3 Comparison with global TEQ results
The average TEQ concentration across all sampled households in this study was 42.3 pg TEQ/g, with a range of 34.99 to 53.3 pg TEQ/g. While this value is significantly higher than the lower ranges reported for most regions worldwide, it is not the highest observed globally, as some regions, such as Africa, Vietnam, and Korea, exhibit considerably higher maximum concentrations. These findings highlight both the regional disparities in PCDD/F contamination levels and the influence of industrial emissions and regulatory frameworks. In Asia, for instance, southern China reported airborne PCDD/F levels varied between 13.4 and 157 pg TEQ/g (Figure 2) [24], while northern China exhibited slightly higher values of 20 to 205 pg TEQ/g [25]. Vietnam and Korea demonstrated much higher levels, with detected levels spanning 317 to 752 pg TEQ/g [16] and 233.6 to 274.2 pg TEQ/m³ [26], respectively. These elevated concentrations reflect the influence of industrial emissions and less stringent regulatory controls in these regions compared to Europe and America.
Figure 2. Comparison of TEQ concentration ranges across different regions worldwide
In Africa, reported airborne concentrations of PCDD/Fs have varied between 3.1 and 923 pg TEQ/g [27], with the wide variability reflecting regional hotspots and disparities in industrial activities and regulatory enforcement. Europe, by contrast, has generally achieved lower contamination levels due to its long-standing strict regulations and advanced waste management practices. In Denmark, PCDD/F concentrations were reported within the range of 5.1 to 24 pg TEQ/g [28], while Italy exhibited similarly low levels at 25 pg TEQ/g [29]. Across the Americas, airborne PCDD/F concentrations ranged from 0.058 to 102 pg TEQ/g [13]. Although these levels are generally lower than those observed in this study, localized areas near emission-heavy facilities in the U.S. showed comparable levels, indicating the significant impact of industrial sources. Similarly, Portugal reported a wide range of concentrations, from 4.6 to 464 pg TEQ/g [30], which aligns with the results observed in this study. The findings from the current study highlight the significant influence of the incineration plant as a primary source of PCDD/F contamination in the surrounding area. While the TEQ concentrations are not as extreme as the upper ranges observed in some regions (e.g., Africa or Vietnam), they are considerably higher than the baseline levels reported for regions with stringent regulations, such as Denmark and Italy. This suggests potential deficiencies in the emission control technologies at the incineration facility and gaps in regulatory enforcement in the local context.
Based on available data from urban and industrial regions globally, Asia and Africa demonstrate airborne PCDD/F concentrations tens to hundreds of times higher than Europe and America. This disparity can be attributed to the stricter regulations and standards on PCDD/F emissions implemented in Europe and America over several decades. Such measures have proven effective in significantly reducing contamination levels, as exemplified by the consistently low concentrations reported in Denmark and Italy. These results highlight the urgent need for improved environmental management strategies to address contamination in the study area. Upgrading the emission control systems at the incineration plant, enforcing stricter air quality regulations, and conducting regular environmental monitoring are critical steps to mitigate the adverse health effects linked to exposure to PCDD/Fs. Additionally, adopting best practices from regions with successful contamination control strategies will be vital in reducing the long-term environmental and health impacts in communities near industrial emission sources.
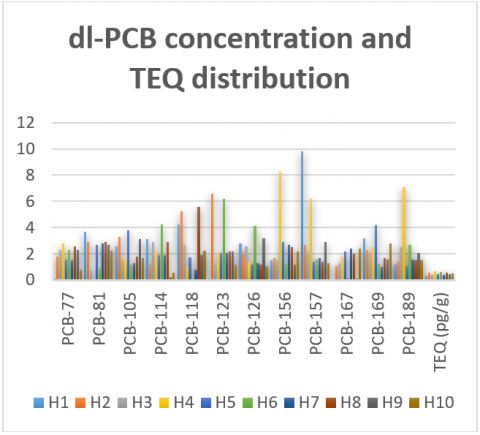
3.2 Dioxin-like PCB (dl-PCB) concentrations and distribution in indoor dust samples
The measured levels of dl-PCBs in indoor dust collected from the surveyed households (H1 to H10) revealed significant variability, with clear distinctions between downwind and upwind households. The ΣPCB ranged from 20.11 ng/g (H10, upwind) to 32.36 ng/g (H1, downwind). Despite H1 exhibiting the highest ΣPCB concentration, downwind households in general displayed a more toxic congener profile with higher WHO-PCB-TEQ values, suggesting a substantial influence from emissions originating at the incineration plant.
3.2.1 Spatial variability of dl-PCB contamination: Upstream and downstream household profiles
Downwind Households
Households located downwind of the incineration plant exhibited higher dl-PCB TEQ values compared to upwind households, emphasizing the significant influence of emissions and wind-driven pollutant dispersion from the plant. Among these, H1 had the highest ΣPCB concentration of 32.36 ng/g, primarily driven by elevated levels of #157 (9.8 ng/g) and #167 (10.24 ng/g) (Figure 3). These congeners, often associated with industrial emissions and older infrastructure, suggest a combination of legacy contamination and ongoing contributions from the incinerator's emissions. Similarly, H4 reported higher concentrations of #156, #157, and #189 (8.26 ng/g, 6.2 ng/g, and 7.1 ng/g, respectively), indicating possible sources such as aged building materials, combustion processes, or secondary contamination via particulate matter from the plant. The dominance of these congeners aligns with findings from prior research, such as Aslam et al. [1], which linked elevated PCB levels to proximity to industrial zones and urban infrastructure.
Figure 3. dl-PCB concentrations and distribution in indoor dust samples in upstream and downstream households
The elevated dl-PCB TEQ values in downwind households reflect the predominance of highly toxic congeners such as #126 and #81. For instance, H5 exhibited significant levels of #126 (1.2 ng/g) and #81 (2.7 ng/g), both of which are potent contributors to the overall toxicity equivalency due to their high TEF values. These findings are consistent with global studies [1, 31, 32] indicating that industrial incineration facilities often act as primary sources of dl-PCBs, releasing these contaminants into the atmosphere, where wind patterns dictate their subsequent deposition in nearby residential areas. The impact of wind patterns and the role of particulate-bound dl-PCBs in transport mechanisms are particularly relevant here. Studies by Lei et al. [14] and Zhang et al. [15] have demonstrated that fine particulate matter (PM2.5 and PM10) can adsorb dl-PCBs, facilitating their dispersion over long distances. The congener profile of downwind households further highlights the significance of combustion-related congeners such as #81 and #118. These congeners, while less abundant in upstream households, were consistently elevated in downwind residences. This pattern aligns with findings from Andersen and Frederiksen [32], which linked such congeners to industrial processes and incomplete combustion of chlorinated materials.
Upwind households
Households located upwind of the incineration plant generally exhibited lower dl-PCB TEQ values compared to their downwind counterparts. H10 recorded the lowest ΣPCB concentration (20.11 ng/g) and a modest TEQ value (0.50 pg/g). These results suggest that upwind households are less directly influenced by emissions from the incinerator. However, localized contamination sources, such as road dust, secondary emissions, or nearby industrial facilities, could still contribute to the observed levels [32]. This highlights the need for a comprehensive assessment of potential secondary contamination sources. H6 displayed an unusual congener profile with elevated levels of #123 (6.2 ng/g) and #126 (4.14 ng/g), indicating potential localized sources or atmospheric transport of these congeners. The relatively high concentration of #126, resulted in an elevated TEQ value for this household compared to other upwind locations. These findings align with studies indicating that dl-PCBs can be redistributed through microclimatic factors such as turbulence, localized wind eddies, and dry deposition, which may result in unexpected hotspots of contamination even in upwind areas [15]. Similarly, H8 exhibited higher levels of #118 (5.6 ng/g), indicative of potential industrial processes or secondary contamination sources. #118 is commonly linked to incomplete combustion and industrial waste, suggesting that localized emissions or historical deposition may contribute to its elevated levels. Despite being upwind, the moderate TEQ values in households like H6 and H8 reflect the complexity of dl-PCB distribution, influenced not only by direct emissions but also by secondary processes such as resuspension, urban runoff, or volatilization from contaminated surfaces.
The findings highlight the need for targeted mitigation measures, particularly in downwind areas where the incineration plant's emissions have a pronounced impact. Enhanced emission controls, such as advanced filtration systems, are critical to reducing the release of dl-PCBs from the plant. Regular monitoring of air quality and indoor dust in both upwind and downwind areas is necessary to track contamination trends and evaluate the effectiveness of mitigation efforts. Further studies should employ source apportionment techniques to identify the relative contributions of the incineration plant versus other localized sources to the dl-PCB burden in the area. Additionally, understanding the role of building characteristics, such as age, ventilation systems, and construction materials, provided valuable insights into indoor contamination pathways and potential exposure risks for residents. Public awareness campaigns must be implemented, aimed at educating residents about dl-PCB exposure pathways and mitigation strategies, such as improving indoor air filtration, which could be instrumental in mitigating health hazards among vulnerable populations.
3.2.2 Major congener contributions to TEQ
The contributions of individual dl-PCB congeners to WHO-PCB-TEQ across all sampled households were dominated by #157, #156, #126, and #118, with #156 emerging as the most consistent contributor to TEQ values in both upstream and downstream locations. Among these, #157 accounted for 10.93% of the total PCB-TEQs, with concentrations reaching up to 31.7 ng/g dry weight, highlighting its significant role in driving the toxicity profile in indoor dust. The predominance of #156 and #157 reflects the influence of industrial and legacy contamination sources, as these congeners are commonly associated with materials used in electrical equipment and insulation. The prevalence of penta- and hexachlorinated congeners, contributing 33.75% and 36.62% of the total TEQs, respectively, highlights their importance as key drivers of dl-PCB toxicity in this study. Penta- and hexachlorinated congeners are known for their environmental stability and lower rates of degradation, which allow them to persist in indoor environments over extended periods [14]. These congeners are also more likely to adsorb onto fine particulate matter, facilitating their transport and deposition indoors, especially in areas affected by industrial emissions or incineration activities.
In contrast, less chlorinated congeners, such as #81 and #123, were among the least detected, likely due to their limited sources and higher susceptibility to environmental degradation. These congeners typically exhibit shorter atmospheric lifetimes and are less likely to accumulate in indoor environments compared to their higher chlorinated counterparts [31]. Their low detection rates across both upstream and downstream households further suggest that local contamination sources are dominated by emissions rich in highly chlorinated congeners. The observed discrepancies in congener profiles between upstream and downstream households highlight the influence of the incineration plant in shaping the toxic burden of dl-PCBs in residential environments. Downstream households not only had higher TEQ values but were also exposed to congeners with higher TEFs, increasing their potential health risks. In contrast, upstream households were dominated by congeners with lower TEFs, resulting in reduced toxicity despite higher overall PCB concentrations. The observed pattern emphasizes that the overall health impact of PCB exposure depends on the specific congener involved and its concentration. The dominance of highly chlorinated congeners such as #156 and #157 across all households’ further points to the persistence of legacy contamination in indoor environments. These findings align with previous studies indicating that older homes are more likely to harbour higher levels of PCBs due to the historical use of PCB-containing materials.
3.2.3 Comparison of dl-PCBs concentrations with global results
The WHO-PCB-TEQ values observed in this study, which reached a maximum of 271.28 pg TEQ1998/g, are moderate compared to those reported in other regions globally, highlighting regional differences in dl-PCB contamination levels and sources. In South Africa, Abafe and Martincigh [33] reported substantially elevated levels of PCBs in household dust, linking these findings to the legacy use of PCB-based materials in both industrial and domestic settings. Similarly, research conducted in South Korea [11] and New York [34] revealed much higher dl-PCB levels in residential environments, reflecting the legacy of industrial emissions, improper waste management practices, and historical reliance on PCB-containing equipment like transformers, capacitors, and building sealants. In both regions, industrial sites and waste disposal facilities were identified as primary contributors to elevated PCB levels in nearby residential areas, comparable to the influence of the incineration plant in this study. Conversely, studies conducted in Denmark [35] and other parts of Europe have documented significantly lower dl-PCB concentrations in indoor environments. These reduced levels can be attributed to stringent environmental regulations, proactive industrial practices, and improved waste management systems that have minimized the release and persistence of PCBs in residential areas. The European Union's early adoption of policies aimed at reducing POPs, including the Stockholm Convention on POPs, has been instrumental in limiting PCB contamination [33].
In this study, the observed positive correlations among key congeners, such as #156, #118, #157, #126, and #167 (correlation coefficient rs > 0.5), suggest common contamination pathways or sources. These congeners are often associated with industrial processes, including emissions from waste incineration and combustion, as well as their adherence to particulate matter, which facilitates their transport and deposition indoors. For example, #118 and #156, both mono-ortho congeners, are known to dominate indoor dust contamination profiles due to their widespread use in industrial applications and high environmental stability [36]. Despite the observed correlations among specific PCB congeners, the lack of significant relationships between residential features (e.g., building age, flooring materials) and PCB concentrations in house dust suggests that external contamination sources play a predominant role in shaping indoor dl-PCB levels. Previous research, such as Abafe and Martincigh [33], supports this notion, showing strong correlations between PCB concentrations in house dust and entryway dust, indicating that PCB-contaminated particulates may be tracked indoors from external sources. Additionally, atmospheric deposition is likely a major contributor, with particulates from industrial emissions and incineration being deposited on household surfaces.
Compared to other regions, the moderate WHO-PCB-TEQ values observed in this study reflect a combination of industrial activity, legacy contamination, and external particulate transport. While the levels are below the levels reported in heavily industrialized regions such as New York and South Korea, they remain concerning given the health risks associated with chronic PCB exposure. The findings emphasize the need for regular monitoring and stricter control of PCB emissions from industrial facilities such as incinerators. Furthermore, improved waste management practices, including safe disposal of PCB-containing materials, are critical to reducing long-term environmental and health risks. Lessons from regions with stringent environmental regulations, such as Europe, provide valuable insights into effective strategies for managing and mitigating PCB contamination in affected areas. This study highlights the variability in dl-PCB concentrations and WHO-PCB-TEQ values across upstream and downstream households, reflecting the influence of local contamination sources and the incineration plant's emissions. Upstream households, while having higher ΣPCB concentrations, exhibited lower TEQ values due to the dominance of less toxic congeners. In contrast, downstream households displayed a more toxic congener profile, suggesting the contribution of industrial emissions to their contamination burden.
3.3 PCA-based apportionment of PCDD/F and dl-PCB sources
This study assessed four different source apportionment approaches, including Non-negative Matrix Factorization (NMF), Alternating Least Squares (ALS), and Positive Matrix Factorization (PMF) and Procrustes Variance Analysis (PVA) to determine the most effective method for analysing PCDD/F and dl-PCB sources. Each model was tested twice, except for PVA, which provided consistent outcomes requiring only one run. The generated profiles were evaluated against known Aroclor patterns as reported by Rushneck et al. [37] and Frame et al. [38]. Rushneck's data was ultimately chosen for comparison due to higher cosine similarity, though both datasets yielded comparable results. This rigorous evaluation ensured robustness and accuracy in source apportionment. To manage the complexity of the congener data, Principal Component Analysis (PCA) was applied to reduce dimensionality, while retaining the majority of its variance, as outlined by Aslam et al. [1]. PCA transformed the PCDD/F and dl-PCB congener concentrations into Principal Components (PCs), facilitating the identification of dominant sources and patterns in pollutant distribution.
PC1 findings and source attribution
PC1, which accounted for the largest variance, was primarily influenced by highly chlorinated congeners, comprising OCDD, 1,2,3,4,6,7,8-HpCDD, and 1,2,3,7,8,9-HxCDD as key contributors. These congeners are consistent with emissions from waste incineration processes, indicating the incineration plant as a significant source of PCDD/F contamination. The high loading scores of these congeners suggest that heavily chlorinated PCDDs are key contributors to the indoor PCDD/F burden. PCA score plots revealed clustering of PCDD/F samples, further supporting the hypothesis of a common source, likely linked to emissions from the MSWI facility.
dl-PCB variability and dispersion
In contrast, dl-PCBs exhibited a more dispersed pattern on PCA score plots, particularly among samples from upwind households. This variability reflects contributions from multiple sources, including historical PCB use in construction materials, indoor dust deposition, outdoor dust tracked indoors, smoking, and industrial emissions. OCDD emerged as the most abundant congener across several locations (e.g., H7, H8, H9, and H10), emphasising the influence of heavily chlorinated congeners associated with industrial activities and waste incineration.
Correlation and spatial patterns
A significant linear correlation (R² = 0.635, p < 0.05) between TEQ values across the ten households highlights the importance of indoor pollutant deposition in driving PCDD/F concentrations. Downwind households near the incineration plant (e.g., H5) consistently showed higher TEQ concentrations, influenced by emissions adsorbed onto fine particulate matter (PM2.5 and PM10). Upwind locations, such as H6 and H9, also displayed elevated TEQ levels, which may be attributed to secondary sources, localized factors like wind eddies, and building-specific characteristics. The study emphasizes that heavily chlorinated congeners, particularly OCDD, including 1,2,3,4,6,7,8-HpCDD, dominate the observed contamination profiles. Proximity to the MSWI plant strongly correlates with higher pollutant levels, as seen in households like H7, whereas other households upwind or farther away still showed moderate contamination due to pollutant dispersion. Environmental factors, including atmospheric conditions, topography, and building ventilation systems, significantly shape the geographic dispersion patterns of PCDD/Fs and dl-PCBs. These findings highlight the need for enhanced mitigation strategies, such as improving emission control technologies at the MSWI plant, and emphasising the role of both direct and indirect sources in shaping the pollutant profiles in indoor environments.
3.4 Estimation of dust ingestion and dermal absorption and cancer risk
The results of the risk assessment reveal notable differences in exposure levels and potential health risks between upwind and downwind households near the incineration facility (Table 3). The calculated values for CDI, CR, and HI indicate that individuals in downwind households are at a higher risk compared to those in upwind households.
Table 3. Mean concentrations of PCDD/F congeners and TEQ in dust from upwind and downwind households near an incineration facility
|
Congeners |
Upwind Mean |
Downwind Mean |
|
2,3,7,8-TCDD |
6.54 |
7.51 |
|
1,2,3,7,8-PeCDD |
9.80 |
10.83 |
|
1,2,3,4,7,8-HxCDD |
17.23 |
18.72 |
|
1,2,3,6,7,8-HxCDD |
21.56 |
23.42 |
|
1,2,3,7,8,9-HxCDD |
27.19 |
29.07 |
|
1,2,3,4,6,7,8-HpCDD |
32.30 |
34.38 |
|
OCDD |
52.91 |
55.72 |
|
2,3,7,8-TCDF |
8.29 |
9.99 |
|
1,2,3,7,8-PeCDF |
11.95 |
13.47 |
|
2,3,4,7,8-PeCDF |
14.68 |
16.69 |
|
1,2,3,4,7,8-HxCDF |
21.08 |
22.94 |
|
1,2,3,6,7,8-HxCDF |
24.88 |
27.41 |
|
2,3,4,6,7,8-HxCDF |
30.99 |
33.82 |
|
1,2,3,7,8,9-HxCDF |
37.79 |
40.42 |
|
TEQ |
40.34 |
44.82 |
3.4.1 Cancer risk
The findings from the risk evaluation for populations residing near the incineration facility highlight concerning levels of CR, particularly in downwind households (Table 3). For adults, the total CR was estimated at 1.18 for upwind households and 1.31 for downwind households. For children, these risks were even higher, at 2.72 and 3.03 for upwind and downwind households, respectively. These figures far exceed the widely accepted threshold for CR of 1E-6, as recommended by the EPA and the WHO. This threshold represents the level below which CR is considered negligible. The elevated CRs observed in children are a cause for significant concern. Children are more vulnerable to environmental contaminants due to physiological and behavioural factors. Due to their lower body mass, children experience greater doses from the same exposure levels, leading to higher intake per kilogram of body weight than adults. Additionally, children exhibit higher dust ingestion rates due to hand-to-mouth activities, which increases their exposure to toxic contaminants in household dust. The developmental immaturity of their detoxification systems further exacerbates their susceptibility, as their bodies are less capable of metabolizing and excreting harmful compounds.
The carcinogenic potential of PCDD/Fs is primarily linked to their interaction with the aryl hydrocarbon receptor (AhR), a ligand-activated transcription factor [16]. When PCDD/Fs bind to AhR, the receptor migrates into the nucleus and influences the regulation of genes associated with xenobiotic metabolism and cellular proliferation. Dysregulation of these pathways can lead to genotoxic and non-genotoxic mechanisms of carcinogenesis, including oxidative stress, DNA damage, and disruption of cellular signalling [23]. Prolonged exposure to low levels of PCDD/Fs has been associated with a heightened risk of developing cancers, including non-Hodgkin lymphoma, soft-tissue sarcoma, and lung cancer [21]. The CR is notably higher in downwind households compared to upwind households. This discrepancy is likely attributable to the dispersal pattern of emissions from the incineration plant, where prevailing winds carry toxic particulates and gaseous emissions toward downwind areas. The higher total toxicity equivalent (TEQ) values measured in downwind areas, 44.82 ng/kg compared to 40.34 ng/kg in upwind areas, corroborate this pattern. Elevated TEQ levels indicate higher cumulative exposure to PCDD/Fs, which are among the most potent carcinogens known. The magnitude of CR identified in this study raises serious public health concerns. Chronic exposure to carcinogenic substances like PCDD/Fs has long latency periods, meaning that health effects might not manifest until years or decades after initial exposure. This emphasises the urgent need for proactive interventions to mitigate exposure, particularly among the most vulnerable populations such as children. Reducing emissions through advanced combustion technologies, implementing stringent regulatory controls, and monitoring ambient air and indoor dust quality are critical measures to protect public health.
3.4.2 Hazard index
The HI is a critical parameter in evaluating potential non-carcinogenic health effects associated with chronic exposure to environmental contaminants (Table 4). HI values exceeding 1 indicate that the exposure level surpasses the established RfD and may lead to adverse health effects [13]. In the current study, the HI levels for both ingestion and dermal exposure significantly exceed this threshold, indicating a considerable risk of non-cancer health effects for populations residing near the incineration plant. For adults, the total HI is 467.98 in upwind households and 519.95 in downwind households. These exceedingly high values suggest that non-cancer health risks are prevalent for adults in both areas, with a more pronounced risk in downwind households. The elevated HI in downwind areas can be attributed to higher concentrations of toxic contaminants, as evidenced by the greater TEQ values measured in these regions. This suggests that adults residing in downwind households experience greater exposure to harmful pollutants via both ingestion and skin contact with contaminated dust. The HI values for children are alarmingly higher, with a total HI of 989.34 in upwind households and 1099.21 in downwind households. These values are nearly double those observed in adults, highlighting the heightened vulnerability of children to non-carcinogenic health effects.
Ingestion and skin contact are the primary contributors to the elevated HI values observed. Dermal exposure contributes substantially to the overall HI due to the large skin surface area exposed to contaminated dust and the adherence properties of fine particulate matter. The adherence factor and absorption efficiency further exacerbate dermal exposure risks, especially in children, whose thinner and more permeable skin enhances the uptake of contaminants. An HI significantly greater than 1 indicates a potential risk of adverse health effects for the exposed population, such as respiratory problems, endocrine disruption, neurodevelopmental impairments, and immune system dysfunction [23]. POPs like dioxins and furans, which dominate the contamination profile near incineration plants, are known to disrupt hormonal pathways, impair liver function, and increase susceptibility to infections and inflammatory conditions. Children, due to their developing organ systems, are particularly vulnerable to such outcomes, which could have long-term implications for their growth and overall health. The consistently higher HI values in downwind households compared to upwind households reflect the influence of pollutant dispersion from the incineration facility. The elevated contaminant concentrations observed in downwind areas are likely attributed to prevailing wind patterns that facilitate the transport and subsequent deposition of pollutants in these regions. This highlights the importance of considering local meteorological conditions when assessing health risks and implementing mitigation strategies.
While the spatial patterns and elevated TEQ, CR, and HI values strongly suggest a significant influence from the incineration facility, it is important to acknowledge that other environmental pollution sources may contribute to the observed contaminant levels. These include traffic emissions, nearby industrial operations, and local combustion practices (e.g., waste burning or domestic coal use). The absence of detailed source apportionment beyond incineration-specific emissions limits the ability to isolate and quantify each source's exact contribution. As such, the health risk assessment presented here may reflect a cumulative exposure burden rather than a facility-specific risk alone. Future studies incorporating multi-source attribution methods and broader environmental monitoring are warranted to disaggregate the impacts of various pollution sources more precisely.
3.5 Limitations of the study
While this study offers valuable insights into the concentrations of PCDD/Fs and dl-PCBs in indoor dust from households near the MSWI facility and evaluates the associated health risks, certain limitations should be acknowledged.
-Limited Sample Size: A key limitation of this study is the relatively small sample size, with only ten households included. This restricts the generalizability of the findings and may not fully capture the variability in exposure and risk across the wider population. A larger sample would enhance statistical robustness, improve the accuracy of exposure estimates, and allow for more representative risk assessments. Future research should aim to incorporate a broader and more diverse sample to strengthen the reliability and applicability of the results at the community or regional level.
Table 4. CDI, CR, and hazard indices for adults and children in upwind and downwind households near an incineration facility
|
Area |
CDI Ingestion (Adults) |
CDI Dermal (Adults) |
CR (Ingestion) |
CR (Dermal) |
Total CR |
HI (Ingestion) |
HI (Dermal) |
Total HI |
|
Upwind |
0.02 |
23.39 |
0.008 |
1.17 |
1.18 |
0.035 |
467.944 |
467.98 |
|
Downwind |
0.02 |
25.99 |
0.009 |
1.30 |
1.31 |
0.04 |
519.912 |
519.95 |
|
Area |
CDI Ingestion (Children) |
CDI Dermal (Children) |
CR (Ingestion) |
CR (Dermal) |
Total CR |
HI (Ingestion) |
HI (Dermal) |
Total HI |
|
Upwind |
0.50 |
49.42 |
0.25 |
2.47 |
2.72 |
1.01 |
988.33 |
989.34 |
|
Downwind |
0.56 |
54.90 |
0.28 |
2.75 |
3.03 |
1.12 |
1098.09 |
1099.21 |
-Absence of a Reference Site: Another notable limitation is the absence of a reference site or control group in the study. In environmental exposure assessments, it is common practice to include a reference site that is not impacted by the potential contamination source (in this case, the MSWI facility). Without a reference site, it is difficult to assess the background levels of PCDD/Fs and dl-PCBs and distinguish between contamination originating from the incineration plant and potential other local sources of pollution. Future research should incorporate a reference site to provide a more accurate baseline for comparison.
-Temporal and Seasonal Factors: The study was carried out during a single period (June - October 2021), and temporal variations, including seasonal changes, were not accounted for. Wind patterns, ambient temperature, and humidity can fluctuate throughout the year, potentially impacting the dispersion and deposition of airborne pollutants. Conducting longitudinal studies that span different seasons would allow for a better understanding of how these factors influence PCDD/F and dl-PCB concentrations in indoor dust.
The primary objective of this study was to assess the concentration levels, spatial distribution, and associated health risks of PCDD/Fs and dl-PCBs in indoor dust from residences located near a MSWI facility in Johannesburg, South Africa. The findings highlight the significant environmental and public health threats posed by these POPs, with downwind households exhibiting markedly higher TEQ concentrations, CR, and HI compared to upwind households. These spatial differences reflect the influence of prevailing wind patterns and proximity to the emission source. Highly chlorinated congeners such as OCDD and 2,3,7,8-TCDD were identified as major contributors to the overall toxic burden. Children were particularly vulnerable, often exceeding acceptable thresholds for both carcinogenic and non-carcinogenic effects due to their greater exposure rates and physiological susceptibility. These findings call for urgent intervention namely, the implementation of advanced emission control technologies, stricter environmental regulations, and greater public awareness of exposure pathways. While the study offers critical insights, it is not without limitations. These include a relatively small sample size, the absence of a reference or control site, and a lack of seasonal or longitudinal data to capture temporal variability in pollutant levels. Such constraints may limit the generalizability of the findings and warrant cautious interpretation.
Future research should address these gaps by incorporating control sites, expanding the geographic and temporal scope of sampling, and increasing sample size to enhance statistical robustness. Nonetheless, this study lays a critical foundation for policy formulation, targeted risk communication, and community engagement in mitigating pollution associated with MSWI operations. Comparative analysis with international datasets revealed that contamination levels in the study area are significantly higher than those reported in regions with stringent regulatory frameworks. This highlights the urgent need to adopt global best practices to improve emission control, reduce health risks, and safeguard vulnerable communities.
We extend our gratitude to families who provided us access to their homes and the Department of Environmental Sciences at the University of South Africa for providing the technical infrastructure necessary for this study. We also gratefully acknowledge the valuable technical support received from the Scientific Services Unit of Capricorn District Municipality.
Nomathemba Themba developed the study concept and methodology, drafted the original manuscript, and contributed to its review and revision. Tlou B. Chokwe contributed to the study design and methodology, provided supervision throughout the project, and participated in the manuscript review and editing process. Linda L. Sibali was responsible project administration and Supervision.
[1] Aslam, I., Baqar, M., Qadir, A., Mumtaz, M., et al. (2021). Polychlorinated biphenyls in indoor dust from urban dwellings of Lahore, Pakistan: Congener profile, toxicity equivalency, and human health implications. Indoor Air, 31(5): 1417-1426. https://doi.org/10.1111/ina.12788
[2] Themba, N., Sibali, L.L., Chokwe, T.B. (2023a). A review on the formation and remediations of polychlorinated dibenzo p-dioxins and dibenzo-furans (PCDD/Fs) during thermal processes with a focus on MSW process. Air Quality, Atmosphere & Health, 16(10): 2115-2132. https://doi.org/10.1007/s11869-023-01394-1
[3] Ying, Y., Wang, X., Song, W., Ma, Y., et al. (2023). Assessment of PCDD/Fs emission during industrial-organic-solid-waste incineration process in a fluidized-bed incinerator. Processes, 11(1): 251. https://doi.org/10.3390/pr11010251
[4] Themba, N., Sibali, L.L., Chokwe, T.B. (2024). Absorption of PCDD/F emissions in flue gas using activated carbon injections in South Africa. International Journal of Sustainable Development and Planning, 19(7): 2527-2538. https://doi.org/10.18280/ijsdp.190709
[5] Wang, P., Yan, F., Cai, J., Xie, F., et al. (2022). Emission levels and phase distributions of PCDD/Fs in a full-scale municipal solid waste incinerator: The impact of wet scrubber system. Journal of Cleaner Production, 337: 130468. https://doi.org/10.1016/j.jclepro.2022.130468
[6] Bo, X., Guo, J., Wan, R., Jia, Y., et al. (2022). Characteristics, correlations and health risks of PCDD/Fs and heavy metals in surface soil near municipal solid waste incineration plants in Southwest China. Environmental Pollution, 298: 118816. https://doi.org/10.1016/j.envpol.2022.118816
[7] Themba, N., Togo, M., Semenya, K. (2023). Evaluating optimum hydrated lime dosage in reducing stack emissions during incineration of waste. International Journal of Environmental Impacts, 6(1): 7-12. https://doi.org/10.18280/ijei.060102
[8] Dvoršćak, M., Živančev, J., Jagić, K., Buljovčić, M., et al. (2024). Contamination levels, influencing factors, and risk assessment of polybrominated diphenyl ethers in house dust of Northern Serbia. Environmental Science and Pollution Research, 31: 25033-25045. https://doi.org/10.1007/s11356-024-32836-7
[9] Yu, J., Li, H., Liu, Y., Wang, C. (2023). PCDD/Fs in indoor environments of residential communities around a municipal solid waste incineration plant in East China: Occurrence, sources, and cancer risks. Environment International, 174: 107902.
[10] Viel, J., Floret, N., Deconinck, E., Focant, J.F., et al. (2011). Increased risk of non-Hodgkin lymphoma and serum organochlorine concentrations among neighbors of a municipal solid waste incinerator. Environment International, 37(2): 449-453. https://doi.org/10.1016/j.envint.2010.11.009
[11] Kim, S.J., Moon, H.B. (2013). Occurrence and human exposure of PCDD/Fs and dioxin-like PCBs in house dust from Busan, Korea: Comparison with seafood consumption. Toxicology and Environmental Health Sciences, 5: 155-162. https://doi.org/10.1007/s13530-013-0169-2
[12] Pronk, A., Nuckols, J.R., De Roos, A.J., Airola, M., et al. (2013). Residential proximity to industrial combustion facilities and risk of non-Hodgkin lymphoma: A case-control study. Environmental Health, 12: 20. https://doi.org/10.1186/1476-069X-12-20
[13] Deziel, N.C., Nuckols, J.R., Jones, R.R., Graubard, B.I., et al. (2017). Comparison of industrial emissions and carpet dust concentrations of polychlorinated dibenzo-p-dioxins and polychlorinated dibenzofurans in a multi-center U.S. study. Science of the Total Environment, 580: 1276-1286. https://doi.org/10.1016/j.scitotenv.2016.12.090
[14] Lei, R., Liu, W., Wu, X., Ni, T., et al. (2020). A review of levels and profiles of polychlorinated dibenzo-p-dioxins and dibenzofurans in different environmental media from China. Chemosphere, 239: 124685. https://doi.org/10.1016/j.chemosphere.2019.124685
[15] Zhang, B., Guo, M., Liang, M., Gu, J., et al. (2023). PCDD/F and DL-PCB exposure among residents upwind and downwind of municipal solid waste incinerators and source identification. Environmental Pollution, 331: 121840. https://doi.org/10.1016/j.envpol.2023.121840
[16] Sau, T.K. (2023). Concentrations of PCDD/Fs and dl-PCBs in ambient air in Hanoi, Vietnam, between 2017 and 2021, and health risk assessments. Environmental Science and Pollution Research, 30(43): 98440-98451. https://doi.org/10.1007/s11356-023-29323-w
[17] Herrero, M., González, N., Rovira, J., Marquès, M., et al. (2022). Health risk assessment of polychlorinated biphenyls (PCBs) in baby clothes. A preliminary study. Environmental Pollution, 307: 119506. https://doi.org/10.1016/j.envpol.2022.119506
[18] International Agency for Research on Cancer (IARC). (2012). IARC Monographs on the Evaluation of Carcinogenic Risks to Humans Volume 100D: A Review of Human Carcinogens. https://publications.iarc.fr/Book-And-Report-Series/Iarc-Monographs-On-The-Identification-Of-Carcinogenic-Hazards-To-Humans/Radiation-2012.
[19] Jiang, W., Peng, Y., Tang, M., Xiong, S., et al. (2023). PCDD/Fs emissions in a large-scale hazardous waste incinerator under different operation conditions: Effective reduction strategies and an applicable correlation. Journal of the Energy Institute, 107: 101186. https://doi.org/10.1016/j.joei.2023.101186
[20] Themba, N., Sibali, L.L., Chokwe, T.B. (2024a). Optimizing the elimination of dioxin-like compounds (PCDD/Fs and PCBs) through effective combustion practices in the flue gas in the medical waste incineration facility. International Journal of Sustainable Development & Planning, 19(6): 2079-2093. https://doi.org/10.18280/ijsdp.190608
[21] Dziubanek, G., Marchwińska-Wyrwał, E., Ćwieląg-Drabek, M., Spychała, A., et al. (2017). Preliminary study of possible relationships between exposure to PCDD/Fs and dl-PCBs in ambient air and the length of life of people. Science of the Total Environment, 598: 129-134. https://doi.org/10.1016/j.scitotenv.2017.03.289
[22] Colt, J.S., Severson, R.K., Lubin, J., Rothman, N., et al. (2005). Organochlorines in carpet dust and non-Hodgkin lymphoma. Epidemiology, 16(4): 516-525. https://doi.org/10.1097/01.ede.0000164811.25760.f1
[23] Li, M., Tang, B., Zheng, J., Ma, S., et al. (2020). PCDD/Fs in paired hair and serum of workers from a municipal solid waste incinerator plant in South China: Concentrations, correlations, and source identification. Environment International, 144: 106064. https://doi.org/10.1016/j.envint.2020.106064
[24] Tang, H.Y., Cui, K.P., Xing, J., Zhu, J.N., et al. (2017). Part I: PM2.5 and polychlorinated dibenzo-p-dioxins and dibenzofurans (PCDD/Fs) in the ambient air of southern China. Aerosol and Air Quality Research, 17: 1550-1569. https://doi.org/10.4209/aaqr.2017.03.0117
[25] Xing, J., Cui, K.P., Tang, H.Y., Lee, W.J., et al. (2017). Part II: PM2.5 and polychlorinated dibenzo-p-dioxins and dibenzofurans (PCDD/Fs) in the ambient air of Northern China. Aerosol and Air Quality Research, 17: 2010-2026. https://doi.org/10.4209/aaqr.2017.06.0211
[26] Heo, J., Kim, D., Lee, G. (2014). Congener profiles and source-wise phase partitioning analysis of PCDDs/Fs and PCBs in Gyeonggi-do ambient air, South Korea. International Journal of Environmental Research and Public Health, 11(11): 11065-11080. https://doi.org/10.3390/ijerph111111065
[27] Ssebugere, P., Sillanpaa, M., Matovu, H., Mubiru, E. (2019). Human and environmental exposure to PCDD/Fs and dioxin-like PCBs in Africa: A review. Chemosphere, 223: 483-493. https://doi.org/10.1016/j.chemosphere.2019.02.065
[28] Hovmand, M.F., Vikelsoe, J., Andersen, H.V. (2007). Atmospheric bulk deposition of dioxin and furans to Danish background areas. Atmospheric Environment, 41(11): 2400-2411. https://doi.org/10.1016/j.atmosenv.2006.10.036
[29] Castro-Jimenez, J., Mariani, G., Eisenreich, S.J., Christoph, E.H., et al. (2008). Atmospheric input of POPs into Lake Maggiore (Northern Italy): PCDD/F and dioxin-like PCB profiles and fluxes in the atmosphere and aquatic system. Chemosphere 73(S1): S122-S130. https://doi.org/10.1016/j.chemosphere.2007.06.097
[30] Nunes, M., Vernisseau, A., Marchand, P., Le Bizec, B., et al. (2014). Occurrence of PCDD/Fs and dioxin-like PCBs in superficial sediment of Portuguese estuaries. Environmental Science and Pollution Research, 21: 9396-9407. https://doi.org/10.1007/s11356-014-2891-y
[31] Dai, Q., Min, X., Weng, M. (2016). A review of polychlorinated biphenyls (PCBs) pollution in indoor air environment. Journal of the Air & Waste Management Association, 66(10): 941-950. https://doi.org/10.1080/10962247.2016.1184193
[32] Andersen, H.V., Frederiksen, M. (2021). Sorption of PCB from air to settled house dust in a contaminated indoor environment. Chemosphere, 266: 129139. https://doi.org/10.1016/j.chemosphere.2020.129139
[33] Abafe, O.A., Martincigh, B.S. (2015). Polybrominated diphenyl ethers and polychlorinated biphenyls in indoor dust in Durban, South Africa. Indoor Air, 25(5): 547-556. https://doi.org/10.1111/ina.12168
[34] Fitzgerald, E.F., Shrestha, S., Palmer, P.M., Wilson, L.R., et al. (2011). Polychlorinated biphenyls (PCBs) in indoor air and in serum among older residents of upper Hudson River communities. Chemosphere, 85(2): 225-31. https://doi.org/10.1016/j.chemosphere.2011.06.027
[35] Frederiksen, M., Meyer, H.W., Ebbehøj, N.E., Gunnarsen, L. (2012). Polychlorinated biphenyls (PCBs) in indoor air originating from sealants in contaminated and uncontaminated apartments within the same housing estate. Chemosphere, 89(4): 473-479. https://doi.org/10.1016/j.chemosphere.2012.05.103
[36] Simonetti, G., Di Filippo, P., Riccardi, C., Pomata, D., et al. (2020). Occurrence of halogenated pollutants in domestic and occupational indoor dust. International Journal of Environmental Research and Public Health, 17(11): 3813. https://doi.org/10.3390/ijerph17113813
[37] Rushneck, D.R., Beliveau, A., Fowler, B., Hamilton, C., et al. (2004). Concentrations of dioxin-like PCB congeners in unweathered Aroclors by HRGC/HRMS using EPA Method 1668A. Chemosphere, 54(1): 79-87. https://doi.org/10.1016/S0045-6535(03)00664-7
[38] Frame, G.M., Cochran, J.W., Bøwadt, S.S. (1996). Complete PCB congener distributions for 17 Aroclor mixtures determined by 3 HRGC systems optimized for comprehensive, quantitative, congener-specific analysis. Journal of High Resolution Chromatography, 19(12): 657-668. https://doi.org/10.1002/jhrc.1240191202