Adil Ibrahim Khalil![]()
© 2025 The author. This article is published by IIETA and is licensed under the CC BY 4.0 license (http://creativecommons.org/licenses/by/4.0/).
OPEN ACCESS
Water security is a critical issue that occupies a significant place in scientific research due to its impact on water resource management. Monitoring the lake surface area is essential for understanding environmental transformations and planning sustainable water management. Image processing tools facilitate the separation of water bodies from the rest of the image, enhancing the accuracy of lake surface area estimation in complex environments. This study employs satellite imagery and advanced image processing algorithms to examine the changes in the surface area of Habbaniyah and Tharthar lakes in Iraq. For this purpose, satellite images from 2000 to 2024 were analysed. Water pixels were identified using threshold-based binarisation and segmentation techniques implemented in Mathematica. The accuracy of the proposed methodology was evaluated using three statistical performance metrics: R2, RMSE, and MAPE. The results revealed a 7.1% reduction in surface area for Habbaniyah Lake and a 1.15% reduction for Tharthar Lake in 2024. The method achieved an accuracy of 0.954. These findings support the development of automated monitoring and early warning systems to investigate changes in the area of freshwater bodies. Further research is recommended to analyse flow rates, evaporation, and rainfall patterns.
binarization, freshwater resources, image processing, segmentation, lake surface monitoring, satellite image, water security
Water security is defined as the availability of sufficient, quality water for life requirements. Lakes are an essential part of providing water sources. Lakes are formed by water flow from rivers upstream or the release from outlets downstream. Within the water cycle, lakes hold immense value by acting as essential regulators and storing precious water resources, effectively cleansing them of harmful elements [1]. The majority of water used for farming practices, approximately 70%, is sourced from lakes [2]. Studying fluctuations in lake surface area is essential for enhancing the regulation of operational water supplies, particularly in the face of shifting climate conditions. In managing water resources, preserving and utilizing the water in lakes and reservoirs is necessary. Floods can be prevented with integrated surface area monitoring and water flow control. Additionally, continuous monitoring of lake surface areas provides essential and in-depth insights into hydrology, environmental changes, and climate [3-5].
Satellite images and remote sensing facilitate monitoring long-term changes in lake surface area [6]. Today, advancements in remote sensing allow for more detailed tracking of lake surfaces [7]. The evolution of remote sensing technology has completely transformed how we observe lake surface areas, providing us access to invaluable resources and innovative techniques for data collection efficiency [7-10].
From an international point of view, various investigations have been published on water security, particularly to regulate and assess the changes of lakes [11, 12]. Water security in Iran has been evaluated over the past 20 years using eight indicators [13]. The study [14] revealed a decline in water security between 1996 and 2016, underscoring the need for sustainable management and a balance between water use and available resources. The volume and area of the Aral Lake were investigated through geospatial quantitative analysis of satellite images from 1987 to 2018, utilizing the NDWI index. Chipman [15] published a study on monitoring the trends in area, volume, and water level of Toshka Lake in Egypt. The author used the Normalized Difference Lake Index (NDLI) and Enhanced Lake Index (ELI) metrics to calculate water areas. Another study utilized satellite images to investigate the relationship between temporal-spatial changes and water temperature at the surface of Burdur, Egirdir, and Beysehir lakes in Turkey, as presented in the study [16].
In contrast, managing the area of lakes in dry locations, such as Iraq, is crucial for conserving water, strengthening resistance to drought, averting salinity, and sustaining harmony within the ecosystem [17, 18]. Therefore, several researchers have presented their efforts to study geo-climatic changes in order to determine their impact on Iraq’s water bodies. The study by Husain [1] examined changes in water levels in five different lakes across five regions of Iraq over a 40-year period (1972-2012). Archived remotely sensed images were used to determine surface areas around lakes and dams, providing insights on lake level and surface area fluctuations. The water system of these lakes was assessed using GIS and remote sensing. The results revealed a decrease in the total surface area and water volume of the lake. Recently, the paper of Al-lami et al. [19] evaluated the changes in the area of Razzaz Lake. Their study used satellite images and Normalized Difference Vegetation Index (NDVI), Normalized Difference Moisture Index (NDMI), Normalized Difference Water Index (NDWI), and Water Index (WI) indices to extract the water area. In addition, detecting the temperature and calculating the water area of a Hamrin lake were the main goals of another study [20]. This study recommends taking rapid measures to address the community's water needs in areas with multiple sources of human consumption. It also emphasized the need to make the most of rainy seasons and water abundance to develop long-term plans for preserving water resources. In addition, research worldwide has focused in recent years on water security and conserving water resources such as lakes, as presented in Refs. [21, 22]. For example, a study highlighted the importance of integrating climate adaptation into water governance frameworks by discussing how climate change exacerbates water insecurity, particularly in arid and semi-arid regions [23]. In contrast, it is worth noting that research into freshwater resources in Iraq over the last 20 years has remained limited, especially given that water security has become increasingly at risk in recent years [11].
Digital image processing has gained increasing importance in recent decades due to its ability to extract information from images and transform it into data that can be analyzed quantitatively [24]. This field has become an essential component for many scientific and engineering applications (see refs. [25-27]). Using techniques such as visual enhancement, segmentation, and feature extraction enhances analysis accuracy and reduces human error. The methods of binarizing satellite images and utilizing Landsat data are not entirely novel; however, no study has yet been conducted to examine the Therthar and Habbaniyah lakes in Iraq over long periods. Therefore, the current study highlights this research gap. Furthermore, this study analyzes the directional changes in lake morphology and uses non-spectral techniques to enhance accuracy, which is less common in similar studies. Although spectral indices such as NDWI and NDMI have been used in numerous previous lake monitoring studies, many of these studies lack directional analysis or may have difficulty extracting accurate lake boundaries, especially in complex environments (see refs. [1, 19]). Table 1 provides a comparison between the current study and a number of other local studies.
The primary goal of this study is to identify and examine the fluctuations in water surface size and shape alterations of the Therthar and Habbaniyah lakes in Iraq over a 24-year period (2000-2024). This study uses Mathematica software to process satellite images within the lakes region. In addition, by examining the shape of the lake and the extent of its changes from different directions, the greatest or least regional changes were estimated.
The present study analyzes performance using Root Mean Squared Error (RMSE), Coefficient of determination (R2), and Mean Absolute Percentage Error (MAPE), enabling quantitative evaluation of watershed extraction. On the other hand, challenges such as the influence of vegetation or spectral noise may affect spectral analysis indices. In this paper, we employed image processing techniques, including binarization and segmentation, to more accurately calculate the lake surface area, thereby enabling better identification of actual water boundaries and reducing errors caused by inconsistent spectral values.
Table 1. An analytical comparison between the current study and a number of other local studies
|
Study |
Period |
Analysis Tools |
Lake Area Calculation |
Directional Analysis |
|
Ref. [1] |
1972–2012 |
Landsat images |
NDWI only |
No |
|
Ref. [19] |
2000–2020 |
NDVI، NDMI |
Spectral indicators |
No |
|
Ref. [20] |
2000–2021 |
NDWI, surface temperature |
Thermal indicators |
No |
|
The current study |
2000–2024 |
Binarization and segmentation |
Direct image processing |
Yes |
2.1 Study area
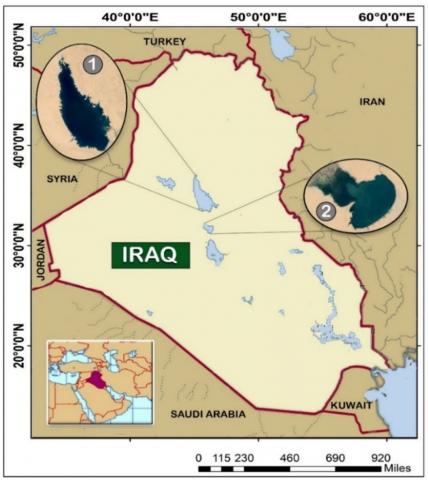
Lakes Tharthar and Habbaniyah in Iraq were selected based on the ease of access to data and the lack of effective monitoring of their surface area (see Figure 1). Furthermore, changes in recent years, such as decreased rainfall, necessitate studies to evaluate these water bodies.
Figure 1. The lakes distribution: (1) Tharthar, and (2) Habbaniyah
Table 2. Specifications of two selected lakes (Tharthar and Habbaniyah)
|
Lake |
Maximum Area (km2) |
Type |
Maximum Depth (m) |
Surface Elevation (m) |
Purpose of Use |
|
Tharthar |
2710 |
Freshwater |
65 |
3 |
Irrigation, tourism, and shipping |
|
Habbaniyah |
425 |
Freshwater |
13 |
49 |
Drinking water, irrigation, and agriculture |
A summary of the characteristics of the lakes used is given in Table 2. Lakes Habbaniyah and Tharthar are two natural water bodies in Iraq. Lake Tharthar, locally known as Buhayrat al-Tharthar, is at 33.9847° N, 43.2522° E and was artificially formed in 1956. It is located 100 kilometers northwest of Baghdad, between the Tigris and Euphrates rivers. The surface area of this Lake is approximately 2,710 square kilometers, with a length reaching a maximum of 120 kilometers and a width of up to 48 kilometers [1]. The lake ranges from 40 to 65 meters deep and has an estimated water volume of 35.18 to 85.59 cubic kilometers. Lake Habbaniyah is located in Anbar Province, with coordinates 33.2919° N, 43.4645° E. This lake is considered a significant body of water in Iraq with a surface area of 140 square kilometers [1]. Ranging in depth from 9 to 13 meters and measuring 35 kilometers long by up to 25 kilometers wide. The Euphrates River mainly feeds the lake. Agriculture irrigation, drinking water needs, and animal activities benefit from the water sourced from Lake Habbaniyah.
2.2 Data description
Spatial and temporal transformations in the study area from 2000 to 2024 were analyzed by processing 48 high-quality Landsat images using the USGS Global Visualization. These images are accessible via the Landsat look platform (https://landsatlook.usgs.gov/explore) and are suitable for assessing lake surface areas and geospatial mapping.
2.3 Water body detection
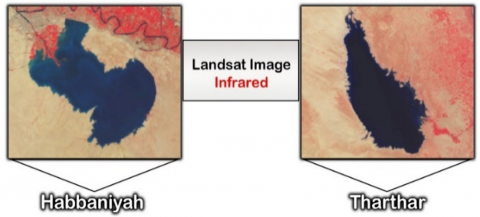
In the first step, high-resolution infrared Satellite images with minimal cloudiness were extracted. Figure 2 shows a sample image extracted from the Landsat sensor for Tharthar and Habbaniyah lakes.
Figure 2. Landsat sensor image for Tharthar and Habbaniyah lakes
In the next step, to increase the accuracy and efficiency of the used method, the images were cut and scaled. Image scaling plays an essential role in estimating lake area changes in this study. On the other hand, all tasks related to image processing and calculations have been performed using the Mathematica software.
In this study, the key approach and method for detecting the water body in the lake is the binarization of images. This process involves dividing the pixels into two groups: white and black. In the binarization method, a threshold limit is specified, and pixels within that range are assigned the value 1 (white), while pixels outside that range are assigned the value 0 (black). The segmentation step improves the analysis of features in the image. Therefore, white pixels indicate pixels relating to the lake, whereas black pixels indicate pixels in places unrelated to the lake.
2.4 Estimation of surface area
Pre-processing steps were applied to Landsat satellite images to address potential spectral noise and atmospheric influences.
These stages include atmospheric correction, noise removal, and contrast enhancement. Then, the binarization and segmentation approaches were used. After processing the images and determining the water body of the lake, the area of each pixel is calculated based on the determined scale in square kilometers. To complete this procedure, it was necessary to calculate the Euclidean distance between two specific points on the scale.
$E D=\sqrt{\operatorname{Abs}[a-x]^2+\operatorname{Abs}[b-y]^2}$ (1)
$Scale~Factor =\frac{E D}{S c}$ (2)
Sc denotes the accurate scale of the image, measured in kilometers squared. Following this, the size of every individual pixel was determined based on the equation below:
$Pixel~Area =\frac{1}{{ Scale~Factor }{ }^2}$ (3)
After determining the area of each pixel, the total number of white pixels corresponding to the lake is counted. Multiplying the area of each pixel by the number of white pixels, the total area of the lake is determined in square kilometers for each lake.
2.5 The proposed method
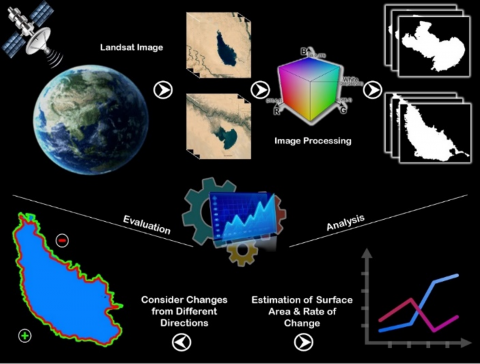
This section summarizes the methodological steps sequentially adopted in the study. Figure 3 illustrates the research workflow stages. These stages include data collection, processing, binarization, segmentation, area calculation, and statistical evaluation using R², RMSE, and MAPE.
For each pixel in the image:
If pixel value < threshold:
Set pixel = 0 (background)
Else:
Set pixel = 1 (lake)
Software: Mathematica was chosen due to its high capacity for performing advanced image processing steps and its immediate support for equations and statistical analysis, eliminating the need for external plugins.
This section summarizes the methodological steps sequentially adopted in the study. Figure 3 illustrates the research workflow stages, including data collection, processing, binarization, segmentation, area calculation, and statistical evaluation using R², RMSE, and MAPE.
Figure 3. A detailed flowchart illustrating the steps performed in this paper, including data collection, preprocessing, methodological development, experimental implementation, and evaluation of results
2.6 Model performance measurement
To evaluate the performance of predictive or analytical models, a set of statistical indicators is used to measure the accuracy of model and its ability to represent actual data. These indicators help determine how close predicted values are to actual values and contribute to comparing the performance of different models. In this study, RMSE, R², and MAPE have been calculated and analyzed.
2.6.1 Root Mean Squared Error
RMSE measures the average difference between the actual and predicted values after squaring these differences and taking the square root. The smaller the RMSE value, the closer the predictive model produces results that are closer to the actual values.
$\mathrm{RMSE}=\sqrt{\sum_{i=1}^m \frac{\left(y_i-y_i^{\wedge}\right)^2}{m}}$ (4)
$y_i-y_i^{\wedge}$ presented obove represents the absolute difference between the actual and predicted value, respectively. The value of m is the total number of observations.
2.6.2 Coefficient of determination
$R^2$ represents the percentage of variance in the dependent variable explained by the independent variables in the model. Its value ranges from 0 to 1.
$R^2=1-\frac{\sum_{i=1}^m\left(y_i-y_i^{\wedge}\right)^2}{\sum_{i=1}^m\left(y_i-y^{-}\right)^2}$ (5)
$R^2$ equal to 1 means that 100% of the variance in the real data and is considered a perfect model whose predictions match the actual values perfectly.
2.6.3 Mean Absolute Percentage Error
MAPE is a measure that expresses the absolute error ratio between the predicted and actual values relative to the true value, expressed as a percentage. It is used to measure the relative accuracy of a model and is easy to interpret because it expresses the error as a percentage.
MAPE $=\frac{1}{m} \sum_1^m\left|\frac{y_i-y_i^{\wedge}}{y_i}\right| \times 100$ (6)
3.1 Results analysis
This study calculates the surface area of Habbaniyah and Tharthar lakes for the period from 2000 to 2024 by processing Landsat images using binarization and segmentation techniques. Furthermore, to evaluate the performance of the proposed method, RMSE, R2, and MAPE criteria were calculated.
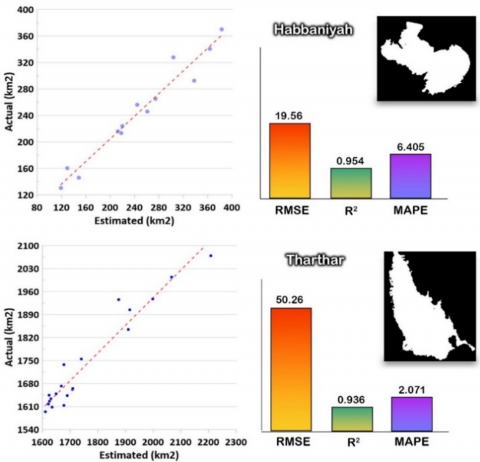
Table 3 provides an overview on the results, highlighting the range of lake area values observed during the research timeframe. According to Table 3, the results show that the model provides high accuracy in representing spatial changes, with a MAPE of 2.071% for Tharthar Lake, while it reached 6.405% for Habbaniyah Lake. The RMSE values reached 50.269 km² and 19.561 km² for both Tharthar and Habbaniyah Lakes, respectively.
Table 3. Statistical values related to the surface area of Tharthar and Habbaniyah lakes for the period 2000–2024
|
Lake |
Minimum Area (km²) |
Maximum Area (km²) |
RMSE (km2) |
R2 |
MAPE |
|
Tharthar |
1595 |
2069.11 |
50.269 |
0.936 |
2.071 |
|
Habbaniyah |
130.54 |
370.12 |
19.561 |
0.954 |
6.405 |
The R² values for Lake Habbaniyah and Lake Tharthar are 0.954 and 0.936, respectively, indicating a high level of agreement between the extracted values and the actual references. The R² values exceeded 0.93 for both lakes, indicating the ability of our method to interpret temporal changes in lake surface area accurately. The RMSE and MAPE statistical values demonstrated the proposed methodology's good performance for both Tharthar and Habaniyah lakes.
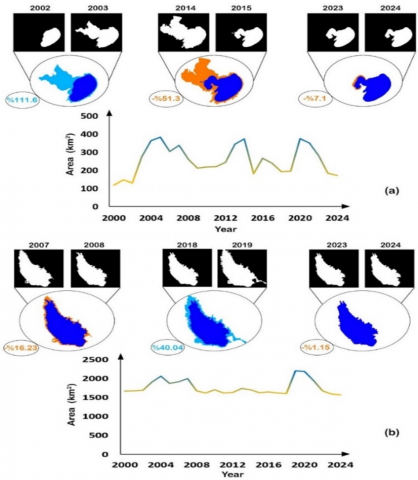
Figure 4 illustrates the shape changes of the two lakes in different directions and their corresponding rates in most cases. According to Figure 4 (a), which relates to Habbaniyah Lake, the highest increase in surface area occurred in 2003, with a rate of 111.6%, compared to 2002. In contrast, a reduction in surface area happened in 2015, with a rate of 51.3%. On the other hand, one can notice that Lake Habbaniyah lost a new part of its remaining area in 2024, reaching 7.1%. Alternatively, in Figure 4 (b), which is related to Tharthar Lake, one can notice that the most significant increase, with a rate of 40.04%, occurred in 2019, and the most significant decrease, with a rate of 16.23%, occurred in 2008. A new reduction of 1.15% in the Lake Tharthar area was observed in 2024.
The decline in recent years, in the surface area of Habbaniyah and Tharthar lakes indicates the possibility of climatic or human influences on the balance of water resources. These implications will be discussed in detail in section 3.3. It is worth noting that the accuracy of the results was not limited to numerical measures only, but it is also supported by visual analysis of the time maps, as shown in Figure 4, which contributes to providing an integrated reading that combines quantitative and qualitative aspects.
Figure 4. Shape changes in different directions for (a) Habbaniyah, and (b) Tharthar, Iraq lakes
3.2 Data validation
The accuracy of our model was verified using a set of standard statistical indicators, including RMSE, R², and MAPE (see Table 3). MAPE is one of the most widely used metrics for measuring error rates independently of data size. The achieved MAPE values indicate that the model can predict the actual lake area values, especially since the error rate did not exceed 7% in either case (see Table 3). Low MAPE values also supported the RMSE results, indicating that absolute deviations were limited. This enhances the reliability of our model and applicability in various environmental contexts, whether for monitoring seasonal changes or for preparing accurate temporal maps of water bodies. For Habbaniyah Lake, as shown in Table 3, the RMSE was 19.56 km², the R² reached 0.954, and the MAPE was 6.405%. In contrast, Tharthar Lake had an RMSE of 50.27 km², an R² of 0.936, and a MAPE of 2.071%. These values indicate a high level of agreement between the estimated and actual surface area measurements in both lakes. The high R² values reflect the consistent output of the proposed model. The relatively low RMSE and MAPE suggest minimal deviation between predicted and reference values. These findings confirm the validity and robustness of the binarization and segmentation techniques employed in this study. Figure 5 shows the scatter plots and evaluation criteria of two lakes (Tharthar and Habaniyah).
From the scatter diagram of Habbaniyah Lake in Figure 5, it can be seen that the points are less scattered than those of Lake Tharthar. Additionally, Figure 6 shows a box plot between actual and estimated values for Tharthar and Habaniyah lakes. According to the box plot of Habbaniyah lake (Figure 6), the minimum, average, and maximum values for both the actual and estimated values are equal to Min=)130, 118(, Mean=)245, 255(, and Max=)370, 383(. Also, for Tharthar lake Min= (1594,1575), Mean=(1741,1769) and Max=(2069,2208).
Figure 5. Scatter plots and evaluation criteria of two selected lakes provide insights into their similarities, differences, and the performance of the proposed assessment method
Figure 6. Box plots and evaluation criteria of two selected lakes
Graphics such as scatter plots and box plots (Figures 5 and 6) accurately illustrate the distribution and correlation between the actual and extracted values. The time series from 2000 to 2024 presented a significant decrease in the surface area of the two lakes, especially in 2009 and 2015. While both lakes showed a strong correlation between estimated and actual surface areas, comparing the validation metrics reveals that the method performed slightly better for Habbaniyah Lake. This can be attributed to the lake’s more regular shape and more apparent spectral separation from surrounding land and vegetation, which facilitates more accurate segmentation.
In contrast, Tharthar Lake, with its larger surface area and more complex shoreline geometry, presents more challenges for image thresholding and pixel classification. These geographical and spectral characteristics likely contributed to the higher Root Mean Square Error (RMSE) observed in its estimation. Nonetheless, the overall results for both lakes indicate that the proposed method is reliable and suitable for monitoring surface water bodies, particularly in regions with limited ground-based observations.
3.3 Discussion and environmental implications
The primary focus of this study was on utilizing satellite imagery to examine the ever-changing surface water regions of two critical lakes in Iraq (Habbaniyah and Tharthar). Compared to traditional monitoring programs, satellite remote sensing provides a more comprehensive approach to collecting geographically and temporally dense data for estimating lake surface area. Efficient processing of satellite images within Mathematica software enabled detailed analysis of spatiotemporal changes occurring in the lakes. Most studies in the field of monitoring lake surface area using satellite images have employed standard indicators to extract the water area of lakes [16, 28-30]. There have been limited studies thus far on assessing the size and outline of Iraq's lakes. Research has been scarce specifically on surface area monitoring of Lake Habbaniyah and Tharthar in Iraq.
The slight variation in the results accuracy between Lake Habbaniyah and Lake Tharthar suggests that the lake shape and vegetation cover influence the quality of the extraction. Lake Habbaniyah has a more regular shape and clearer spectral reflectances.
The results from previous research are similar to those obtained through the binarization-oriented methodology [1, 28]. The Landsat series data stands out with its sophisticated sensors, tailored spectral bands for diverse uses, fluctuating spatial resolutions, and a track record of ongoing advancements in satellite technology for observing Earth [31]. By applying remote sensing technology, a highly capable technique, decision-makers and officials can gain significant insight into water level fluctuations over time at a lower cost and with exceptional performance.
The results of this study are consistent with trends reported by the Iraqi Ministry of Water Resources, which indicate declining water levels during drought periods. Unlike the method used by Al-Lami et al. [19], which relied solely on the NDWI index, this study demonstrates an improvement in monitoring both morphological transformations and temporal changes in lake surfaces. Therefore, we can infer that relying on direct image analysis instead of spectral indices increases the system's detection efficiency and reduces the impact of changing environmental conditions. These results may significantly contribute to designing effective decision support frameworks for managing lake systems, especially in areas prone to drought or experiencing agricultural expansion.
It is worth noting that the reduction in the surface area of Lake Habbaniyah and Lake Tharthar, particularly in recent years, reflects the impact of climate change on water resources. Furthermore, it also points to shortcomings in long-term water management policies and calls for developing flexible adaptation plans. For example, a 7.1% decrease in the surface area of Lake Habbaniyah could negatively impact local water security, given the dependence of neighbouring agricultural communities on its water for irrigation. The loss of water areas also affects biodiversity and threatens the habitats of aquatic species and migratory birds, requiring proactive environmental intervention.
One may infer that the previous studies, such as the analysis of changes in the Aral Lake or the lakes of Central Asia, the gradual reduction in lake area often precedes severe environmental and economic crises [32, 33]. Therefore, the changes observed in our study in Lakes Tharthar and Habbaniyah should be considered early signs calling for urgent management and environmental action. From a management perspective, it is recommended to develop an integrated water resources management framework that includes continuous satellite monitoring, periodic updating of Lake data, and linking them to water allocation plans. Comparisons with similar lakes in arid environments, such as Lake Toshka in Egypt, highlight the importance of incorporating water quality indicators and evaporation levels into future analysis [34]. This will provide deeper insights into the causes and prognosis of changes. Continued shrinkage of water areas without appropriate interventions could lead to environmental disturbances and direct threats to agriculture, biodiversity, and food security in the region.
The low MAPE values indicate that the prediction errors for the areas were minor compared to the actual values, demonstrating the effectiveness of the model used. Specifically, the MAPE value of 2.071% for Lake Tharthar represents a very high estimation accuracy, especially given the large area of the lake (between 1,595 and 2,069 km²), as the relative error decreases significantly over larger areas. In contrast, the MAPE value for Lake Habbaniyah (6.405%) remains within the acceptable range. It indicates a relatively higher impact of error due to the lake's small area, making the error percentage more significant. Furthermore, the high R² values (over 0.93) confirm that the model can explain more than 93% of the variance in the data, thereby enhancing the reliability of the results obtained and providing a strong basis for employing the model in water body monitoring studies.
While the present study employed remote sensing techniques and Landsat data, several advancements and distinctions are notable. Our results demonstrate that segmentation techniques yield higher accuracy compared to spectral indices, enabling the identification of lake boundaries even in conditions where spectral values are not ideal. This makes this method a powerful tool for more accurate water body analysis. This method overcomes the drawbacks of mixed-pixel settings by improving pixel-level water identification precision and reducing dependency on conventional spectral indices.
The binary analysis and segmentation methods are highly efficient in extracting lake surface areas by processing satellite images. To the best of our knowledge, the results reveal valuable insights into surface changes in two lakes in Iraq through satellite image analysis over a 24 years.
Based on the observed results, the proposed methodology offers higher accuracy in identifying water bodies, especially in environments with high spectral variances. This enhances its potential for use in remote sensing applications to monitor water bodies with greater accuracy and reliability. It may be of utility in developing automatic monitoring and early warning systems for fluctuations in lake surface area. In addition, it might be interest to investigat other related parameters, such as discharge rate, nutrition, precipitation, and evapotranspiration. This research expands its scope by integrating predictive implications for drought resilience and water management, advocating for the use of automated systems to address emerging challenges. The results showed that temporal changes in area reflect the impact of lakes on climatic conditions, particularly the drought periods between 2003 and 2015. These results demonstrate the potential for using this approach in monitoring surface water resources and support decision-makers. It could be interesting now to apply the system to other lakes in Iraq and integrating it with ground-based hydrological data to enhance the accuracy of analysis and predict future changes.
[1] Husain, Y. (2016). Monitoring and calculating the surface area of lakes in northern Iraq using satellite images. Applied Research Journal, 2(2): 54-62.
[2] Bunting, L., Leavitt, P.R., Simpson, G.L., Wissel, B., Laird, K.R., Cumming, B.F., Amand, A.S., Engstrom, D.R. (2016). Increased variability and sudden ecosystem state change in Lake Winnipeg, Canada, caused by 20th century agriculture. Limnology and Oceanography, 61(6): 2090-2107. https://doi.org/10.1002/lno.10355
[3] Vickers, H., Malnes, E., Høgda, K.A. (2019). Long-term water surface area monitoring and derived water level using synthetic aperture radar (SAR) at Altevatn, a medium-sized arctic lake. Remote Sensing, 11(23): 2780. https://doi.org/10.3390/rs11232780
[4] Ptak, M., Szyga-Pluta, K., Heddam, S., Zhu, S., Sojka, M. (2023). A century of changes in the surface area of lakes in west Poland. Resources, 12(9): 110. https://doi.org/10.3390/resources12090110
[5] Purevdorj, Z., Jargal, N., Ganbold, O., Munkhbayar, M., Purevee, E., Jargalsaikhan, A., Paik, I.H., Paek, W.K., Lee, J.W. (2023). Spatial and temporal variations in waterfowl assemblage structures in Mongolian lakes and the changes linked to the gradient of lake surface areas. Diversity, 15(3): 334. https://doi.org/10.3390/d15030334
[6] Li, J., Ma, R., Cao, Z., Xue, K., Xiong, J., Hu, M., Feng, X. (2022). Satellite detection of surface water extent: A review of methodology. Water, 14(7): 1148. https://doi.org/10.3390/w14071148
[7] Rubin, H.J., Lutz, D.A., Steele, B.G., Cottingham, K.L., Weathers, K.C., Ducey, M.J., Palace, M., Johnson, K.M., Chipman, J.W. (2021). Remote sensing of lake water clarity: Performance and transferability of both historical algorithms and machine learning. Remote Sensing, 13(8): 1434. https://doi.org/10.3390/rs13081434
[8] Belal, M., Aly, E.B., Noha, S.D., Ayman, N.H.N. (2021). Developing an innovative technique to enable estimate of surface area of Aswan high dam lake using satellite images. Journal of Environmental Science, 50(6): 1-19. https://doi.org/10.21608/jes.2021.183634
[9] Soltani, K., Amiri, A., Zeynoddin, M., Ebtehaj, I., Gharabaghi, B., Bonakdari, H. (2021). Forecasting monthly fluctuations of lake surface areas using remote sensing techniques and novel machine learning methods. Theoretical and Applied Climatology, 143: 713-735. https://doi.org/10.1007/s00704-020-03419-6
[10] Attiah, G., Kheyrollah Pour, H., Scott, K.A. (2023). Lake surface temperature retrieved from Landsat satellite series (1984 to 2021) for the North Slave Region. Earth System Science Data, 15(3): 1329-1355. https://doi.org/10.5194/essd-15-1329-2023
[11] Lebu, S., Lee, A., Salzberg, A., Bauza, V. (2024). Adaptive strategies to enhance water security and resilience in low-and middle-income countries: A critical review. Science of the Total Environment, 925: 171520. https://doi.org/10.1016/j.scitotenv.2024.171520
[12] Sun, X., Armstrong, M., Moradi, A., Bhattacharya, R., Antão-Geraldes, A.M., Munthali, E., Grossart, H., Matsuzaki, S.S., Kangur, K., Dunalska, J.A., Stockwell, J.D., Borre, L. (2025). Impacts of climate-induced drought on lake and reservoir biodiversity and ecosystem services: A review. Ambio, 54: 488-504. https://doi.org/10.1007/s13280-024-02092-7
[13] Zakeri, M.A., Mirnia, S.K., Moradi, H. (2022). Assessment of water security in the large watersheds of Iran. Environmental Science & Policy, 127: 31-37. https://doi.org/10.1016/j.envsci.2021.10.009
[14] Wu, Q., Yue, H., Liu, Y., Hou, E. (2022). Geospatial quantitative analysis of the Aral Sea Shoreline changes using RS and GIS techniques. Earth Science Informatics, 15: 137-149. https://doi.org/10.1007/s12145-021-00714-2
[15] Chipman, J.W. (2019). A multisensor approach to satellite monitoring of trends in lake area, water level, and volume. Remote Sensing, 11(2): 158. https://doi.org/10.3390/rs11020158
[16] Albarqouni, M.M., Yagmur, N., Bektas Balcik, F., Sekertekin, A. (2022). Assessment of spatio-temporal changes in water surface extents and lake surface temperatures using Google Earth Engine for lakes region, Türkiye. ISPRS International Journal of Geo-Information, 11(7): 407. https://doi.org/10.3390/ijgi11070407
[17] Ortega-Gaucin, D., Pérez, M.L., Cortés, F.A. (2016). Drought risk management in Mexico: Progress and challenges. International Journal of Safety and Security Engineering, 6(2): 161-170. https://doi.org/10.2495/SAFE-V6-N2-161-170
[18] Hussien, B.M., Rabeea, M.A., Mekhlef, H.N. (2021). Characterization of the groundwater within regional aquifers and suitability assessment for various uses and purposes-western Iraq. Baghdad Science Journal, 18(1 (Suppl.)): 0670-0670. https://doi.org/10.21123/BSJ.2021.18.1(SUPPL.).0670
[19] Al-lami, A.K., Abbood, R.A., Al Maliki, A.A., Hussain, H.M., Alabidi, A.J. (2023). Using of different satellite-derived indices to detect the spatiotemporal changes of the Al-Razzaza Lake, Iraq. Iraqi Journal of Science, 64(2): 1030-1040. https://doi.org/10.24996/ijs.2023.64.2.44
[20] Khalaf, A.B. (2022). Using remote sensing and geographic information systems to study the change detection in temperature and surface area of Hamrin Lake. Baghdad Science Journal, 19(5): 1130-1130. https://doi.org/10.21123/bsj.2022.6420
[21] Kanaoujiya, R., Roy, O.S., Jaiswal, A., Singh, S.K., et al. (2025). Agricultural water scarcity: An emerging threat to global water security. In Sustainable Agriculture under Drought Stress, pp. 15-22. https://doi.org/10.1016/B978-0-443-23956-4.00002-8
[22] Oiganji, E., Igbadun, H., Amaza, P.S., Lenka, R.Z. (2025). Innovative technologies for improved water productivity and climate change mitigation, adaptation, and resilience: A review. Journal of Applied Sciences and Environmental Management, 29(1): 123-136. https://doi.org/10.4314/jasem.v29i1.17
[23] Mishra, B.K., Kumar, P., Saraswat, C., Chakraborty, S., Gautam, A. (2021). Water security in a changing environment: Concept, challenges and solutions. Water, 13(4): 490. https://doi.org/10.3390/w13040490
[24] Antonino, M., Nicola, M., Claudio, D.M., Luciano, B., Fulvio, R.C. (2019). Office building occupancy monitoring through image recognition sensors. International Journal of Safety and Security Engineering, 9(4): 371-380. https://doi.org/10.2495/SAFE-V9-N4-371-380
[25] Khalil, A., Humeau-Heurtier, A., Abraham, P., Mahé, G. (2014). Microvascular blood flow with laser speckle contrast imaging: analysis of static scatterers effect through modelling and simulation. In 2014 European Modelling Symposium, Pisa, Italy, pp. 82-86. https://doi.org/10.1109/EMS.2014.53
[26] Stefan, C., Beleznai, C., Erdelean, I., Hahn, M. (2019). Image-based identification and GIS-integration of vehicle restraint systems and evaluation of safety effects. International Journal of Safety and Security Engineering, 9(4): 344-355. https://doi.org/10.2495/SAFE-V9-N4-344-355
[27] Lega, M., Teta, R. (2016). Environmental forensics: Where techniques and technologies enforce safety and security programs. International Journal of Safety and Security Engineering, 6(4): 709-719. https://doi.org/10.2495/SAFE-V6-N4-709-719
[28] Dawood, A., Kalaf, Y., Abdulateef, N., Falih, M. (2018). Investigation of surface area of lakes and marshes from satellite images by using remote sensing and geographic information system integration in Iraq. MATEC Web of Conferences, 162: 03016. https://doi.org/10.1051/matecconf/201816203016
[29] Abbas, M.R., Hason, M.M., Ahmad, B.B., Rasib, A.W.B., Abbas, T.R. (2020). Variations size investigation in vegetation and surface water body for central part of Iraq using satellite imagery bands. IOP Conference Series: Materials Science and Engineering, 928(2): 022064. https://doi.org/10.1088/1757-899X/928/2/022064
[30] Rashed, A.M., Alattar, F.M. (2024). Applying geographic information systems (GIS) techniques to estimate surface area of Al-Razzaza lake, Karbala province, Iraq. IOP Conference Series: Earth and Environmental Science, 1300(1): 012008. https://doi.org/10.1088/1755-1315/1300/1/012008
[31] Butt, M. J., Waqas, A., Mahmood, R., Climate, Snow and Hydrology Research Group (CSHRG). (2010). The combined effect of vegetation and soil erosion in the water resource management. Water resources Management, 24: 3701-3714. https://doi.org/10.1007/s11269-010-9627-7
[32] Liu, H., Chen, Y., Ye, Z., Li, Y., Zhang, Q. (2019). Recent lake area changes in Central Asia. Scientific Reports, 9(1): 16277. https://doi.org/10.1038/s41598-019-52396-y
[33] Wang, X., Zhang, J., Wang, S., Ge, Y., Duan, Z., Sun, L., Meadows, M.E., Luo, Y., Fu, B., Chen, X., Huang, Y., Ma, X., Abuduwaili, J. (2023). Reviving the Aral Sea: A hydro-eco-social perspective. Earth's Future, 11(11): e2023EF003657. https://doi.org/10.1029/2023EF003657
[34] Abdelmoneim, H., Eldardiry, H., Moghazy, H.M., Eladawy, A. (2022). Inferring the joint operation of high Aswan dam and Toshka depression using multi-sensor satellite approach. Geocarto International, 37(26): 14088-14104. https://doi.org/10.1080/10106049.2022.2086632