Zulfan*![]() | Jonathan Liviera Marpaung
| Jonathan Liviera Marpaung![]() | Rahmadsyah Rangkuti
| Rahmadsyah Rangkuti![]() | Andi Pratama Lubis
| Andi Pratama Lubis![]() | Windi Chaldun
| Windi Chaldun![]()
© 2025 The authors. This article is published by IIETA and is licensed under the CC BY 4.0 license (http://creativecommons.org/licenses/by/4.0/).
OPEN ACCESS
This study investigates the mechanisms of hate speech propagation on social media through a novel interdisciplinary framework combining digital humanities, mathematical modeling, and dynamic simulation. A modified Susceptible-Infected-Susceptible (SIS) model is applied to a directed interaction network constructed from Twitter data related to the 2019 Indonesian presidential election. The methodology integrates sentiment analysis, engagement metrics, and social network centrality to simulate hate speech spread over time. Key innovations include cluster-based visualization, time-lapse simulations, and threshold analysis to detect influential users and network vulnerabilities. Results show that highly central users significantly amplify the spread of hate speech, while sentiment clustering reveals polarized communities that reinforce negative discourse. These insights provide actionable implications for platform moderators and policymakers seeking to develop targeted intervention strategies and foster healthier online ecosystems.
hate speech analysis, social network analysis, mathematical modeling, digital humanities, political polarization, sentiment clustering, SIS model
In the era of digital communication, social media platforms have emerged as crucial spaces for public conversation, facilitating the unrestricted interchange of ideas and perspectives. Nevertheless, these platforms have also contributed to the widespread problem of hate speech, which presents substantial obstacles to social cohesion and personal welfare. The dissemination of hate speech can result in tangible outcomes, such as prejudice, aggression, and societal disintegration. Gaining insight into the mechanisms by which hate speech disseminates through social networks is crucial for devising efficient strategies to combat it and cultivating a more secure digital space. This study utilizes the discipline of Digital Humanities, which combines conventional humanities research with digital tools and techniques, to investigate the occurrence of hate speech on social networks. Digital humanities are an interdisciplinary field that applies computational techniques to humanities data, enabling the large-scale analysis of cultural, historical, and social phenomena. In the context of online discourse, it facilitates network analysis, linguistic sentiment modeling, and media archaeology. Recent advancements in digital humanities have shown its potential in identifying sociopolitical trends, user polarization, and digital activism across platforms such as Twitter, Reddit, and Facebook. By applying digital humanities tools, this study aims to bridge qualitative cultural inquiry and quantitative computational analysis to investigate hate speech dynamics on social media. This study seeks to reveal the underlying patterns and structures that enable the spread of hate speech on social media by utilizing Gephi, a robust open-source software for network analysis and visualization. The primary aim of this research is to create a visual representation and examine the social connections that contribute to the dissemination of hate speech. This involves identifying the main individuals engaged, influential points of connection, and groups of people with shared interests. Through the process of visualizing these networks, we can acquire valuable knowledge about the various roles played by different users and how their interactions lead to the spread of detrimental content. In addition, this study will analyze temporal patterns to gain insight into the progression of hate speech over time, specifically in relation to notable social or political occurrences. By conducting this analytical investigation, our aim is to offer practical and influential observations that can guide policy-making, platform moderation methods, and public awareness efforts. This project seeks to examine the methods by which hate speech is spread, with the goal of aiding in the overall endeavor to reduce its influence and promote a digital public space that is more inclusive and courteous.
Hate speech, defined as any form of communication that belittles individuals or groups based on attributes such as race, religion, ethnic origin, sexual orientation, disability, or gender, has profound and far-reaching impacts on society. At its core, hate speech fosters an environment of intolerance and discrimination, undermining the social fabric by perpetuating stereotypes and prejudices. When unchecked, it can lead to the marginalization and dehumanization of targeted groups, stripping away their dignity and basic human rights. This environment of hostility can escalate into acts of violence and hate crimes, as individuals who are repeatedly exposed to hate speech may become desensitized and more likely to engage in aggressive behavior. For instance, numerous studies have shown a correlation between the prevalence of hate speech and the incidence of hate-motivated violence, where inflammatory rhetoric acts as a catalyst for physical attacks [1]. In addition to physical harm, the psychological impact on victims is substantial, leading to feelings of fear, anxiety, and depression. This constant state of emotional distress can severely diminish the quality of life for those targeted, as they may feel unsafe and unwelcome in their communities [2]. Beyond the immediate effects on individuals, hate speech can polarize societies, deepening existing divisions and creating new fault lines. This polarization undermines social cohesion and trust, making it difficult for diverse groups to coexist peacefully and collaborate on common goals. In democratic societies, the proliferation of hate speech can erode the principles of equality and justice, as it distorts public discourse and influences political processes. By promoting extremist ideologies, hate speech can sway public opinion and policy in ways that marginalize minority groups, leading to discriminatory laws and practices. Moreover, the impact of hate speech extends to the digital realm, where social media platforms often serve as breeding grounds for such harmful rhetoric. The anonymity and reach of the internet enable hate speech to spread rapidly, reaching vast audiences and normalizing harmful views. This digital amplification not only exacerbates the real-world impact but also complicates efforts to monitor and regulate hate speech effectively. Governments and social media companies face significant challenges in balancing the regulation of hate speech with the protection of free speech, often leading to debates over censorship and civil liberties. To mitigate the impact of hate speech, a multifaceted approach is required, involving legal frameworks, public education, and community engagement. Legal measures must be clear and enforceable, ensuring that hate speech is addressed without infringing on free expression. Educational initiatives can raise awareness about the dangers of hate speech and promote digital literacy, helping individuals recognize and challenge harmful rhetoric. Community programs can foster dialogue and understanding, bridging divides and building resilience against the divisive effects of hate speech. Ultimately, addressing hate speech requires a collective effort from all sectors of society to create an inclusive and respectful environment where diversity is celebrated, and all individuals can coexist peacefully. By tackling hate speech head-on, societies can protect the rights and dignity of all their members, ensuring a more harmonious and just world for future generations.
The dynamics of online discourse, particularly regarding hate speech, disinformation, and civic engagement, have attracted significant scholarly attention across disciplines. A wide range of methods, including semantic network analysis, sentiment analysis, and machine learning, have been employed to better understand these phenomena. Blokland et al. [3] conducted a digital forensic analysis of darknet forums to understand social incentives that drive illegal content sharing, applying group-based trajectory modeling and network analysis. Their findings suggest that persistence in deviant behavior online is often linked to social identity and association processes. Richards [4] explored the instructional design of researcher-designed digital games, advocating for Mayer’s value-added approach to isolate specific game mechanics affecting language pragmatics. This emphasis on methodological rigor parallels efforts in computational media studies that seek to isolate causal mechanisms in digital behavior. In terms of youth civic engagement, Chan [5] implemented a digital storytelling intervention, demonstrating that participatory media can cultivate critical thinking and reduce ethnocentric attitudes. This is echoed by Hudha [6], whose research on Indonesian students confirms that multicultural attitudes and public discourse engagement contribute to democratic values though with varied impact depending on media engagement levels. A macro-level perspective is offered by Helbing et al. [7], who introduced the concept of Computational Diplomacy and argued for the use of digital platforms in participatory governance. Their work lays a foundation for the integration of semantic network tools in analyzing collective intelligence. From a policy angle, Reisach [8] focused on ethical guidelines for digital platforms during political manipulation, recommending responsibility-based governance models to mitigate algorithmic bias and disinformation. This concern is mirrored in Mueller’s analysis [9] of AI governance, where he emphasized that real-world control requires systemic oversight of the entire digital ecosystem not merely algorithmic outputs [10-12].
Disinformation remains a recurring theme. Taranenko [13] showed how Ukraine used rhetorical strategies in UN speeches to combat Russian disinformation, illustrating the performative function of political communication. Oleksiyuk [14] complemented this by identifying legislative and infrastructure gaps in Ukraine’s information governance during wartime, particularly on platforms like Telegram. Addressing extremist rhetoric, Dillon et al. [15] presented a pedagogical framework to counter radicalization by combining historical narrative correction with social connectedness. A similar preventive lens is found in Sánchez-Sánchez et al. [16], whose meta-analysis of bias-based aggression identifies schools as key intervention sites, rooted in theories of mind and ecological psychology. The role of memes in political discourse is examined by Liagusha and Iarovyi [17], who argued that memes operate as emotionally resonant tools of information warfare, particularly in autocratic contexts. Bernstein [18] extended this by analyzing memes around space tourism, noting the emergence of “counterpublics” resisting elite narratives through digital humor. Several studies have emphasized the computational methodologies that make these analyses feasible. Suitner et al. [19] applied semantic network analysis to climate activism on Twitter, revealing discursive shifts aligned with social identity theory. Macanovic [20] offered a comprehensive review of computational text analysis, charting how methods such as supervised learning and semantic models are reshaping sociological inquiry. In the context of digital religion, Wahid [21] examined the emergence of “digital Islam” using bibliometric and sentiment analysis, uncovering gender dynamics and the use of Instagram in contemporary Islamic discourse. On the technological side, Arslan and Munawar [22] introduced a political event extraction system using Retrieval-Augmented Generation (RAG) and large language models (LLMs), pointing to scalable methods for structured political analysis. Similarly, Ghaly et al. [23] reviewed Arabic hate speech detection systems and found limitations stemming from sparse linguistic resources and morphological complexity. Scotland et al. [24] analyzed public reactions to the George Floyd video using sentiment analysis, finding mixed emotional responses that pointed to underlying racial tensions. Nairn and Matthews [25] similarly investigated pandemic-related Facebook discourse in New Zealand, revealing widespread misinformation, racial scapegoating, and distrust in government. Recent studies have also explored the ethical boundaries of AI in relation to fundamental rights. Malgieri and Santos [26] critiqued existing EU frameworks like GDPR and the AI Act for their vague risk-assessment criteria and proposed a rights-based framework that accounts for non-material harms. Efforts to counter online hate also include legislative and corporate governance. Nave and Lane [27] examined how EU directives shape the responsibilities of online platforms in moderating hate speech, stressing the need to integrate human rights into Terms of Service policies. Lastly, in the context of cyberbullying, Joshi et al. [28] proposed an efficient supervised machine learning approach using TF-IDF and NLP, offering a scalable solution for detection tasks [29-32].
This study aims to enhance the understanding of digital interaction dynamics by analyzing the mechanisms underlying the spread of hate speech on social media. It seeks to inform the development of effective technological and legislative frameworks for mitigating harmful online behavior. The core objective is to bridge digital technology and humanities scholarship, demonstrating the value of interdisciplinary approaches in addressing complex societal challenges in the digital age.
2.1 Algorithm of research process
The research process involves several key steps, starting with data collection from social media posts related to the 2019 Indonesian presidential election. The data is then preprocessed to clean the text by removing URLs, mentions, hashtags, and non-alphanumeric characters, followed by converting the text to lowercase. Sentiment analysis is performed using the VADER sentiment analyzer to classify posts as positive, neutral, or negative. Engagement metrics, including engagement rate, response rate, and engagement sentiment, are calculated.
|
AHP Algorithm |
|
Step 1: Data Collection
Step 2: Data Preprocessing
Step 3: Sentiment Analysis Use the VADER sentiment analysis tool to determine the sentiment polarity (positive, negative, or neutral) of each post. Step 4: Engagement Metrics Calculation
Step 5: Network Graph Construction
Step 6: Centrality Measures Calculation
Step 7: Clustering Analysis
Step 8: Result Interpretation
|
A directed graph is constructed to represent user interactions, where nodes represent users and edges represent mentions or replies. Centrality measures (degree centrality, betweenness centrality, eigenvector centrality) are calculated for each node. K-means clustering is then applied to these centrality measures to identify distinct clusters of users. The results are interpreted to identify key influencers, core clusters, peripheral participants, and isolated nodes. Insights and recommendations are generated based on the engagement metrics and clustering analysis, providing a comprehensive understanding of user interaction dynamics and strategies for enhancing engagement within the network.
2.2 Main hypotheses
Positive sentiments tend to evoke favorable emotions such as happiness, enthusiasm, and agreement, which can lead to more likes, shares, and comments as users are motivated to express their support and share the positive content with others. This increased interaction is reflected in higher engagement rates. Conversely, neutral posts may not elicit strong emotional reactions, resulting in lower engagement, while negative posts, although they may provoke interaction, often lead to less frequent positive actions such as liking and sharing. Therefore, the hypothesis is that positive sentiment in social media posts will correlate with higher user engagement, as users are generally more inclined to interact with and promote content that aligns with their positive feelings and attitudes.
Hypothesis 1: Posts with positive sentiment will have higher engagement rates compared to posts with neutral or negative sentiment.
Users with higher degree and eigenvector centrality are more influential and can effectively disseminate information within the network is grounded in the rationale that central users possess extensive connections and are linked to other key influencers, thereby amplifying their reach and impact. Degree centrality measures the number of direct connections a user has, indicating their immediate influence within the network. Users with high degree centrality can quickly disseminate information to a large audience [33]. Eigenvector centrality goes a step further by considering not just the number of connections, but also the quality of those connections; it assigns greater influence to users who are connected to other highly influential users. This interconnectedness enhances their ability to spread information effectively, as they can leverage their influential connections to propagate messages more broadly and rapidly. Consequently, users with high degree and eigenvector centrality are pivotal in shaping discussions, driving engagement, and ensuring that information reaches a wide and relevant audience within the network.
Hypothesis 2: Users with higher degree and eigenvector centrality are more influential and can effectively disseminate information within the network.
The core cluster of highly active users will drive the majority of interactions and engagement within the network is supported by the rationale that a small group of engaged users frequently dominates online discussions, thereby shaping the overall conversation and engagement patterns. In social networks, these core users are typically the most active and influential, contributing a substantial portion of the content and interactions. Their high activity levels and frequent engagement attract attention, encouraging other users to participate and respond [34]. This creates a feedback loop where the core cluster's discussions set the tone and direction of the broader conversation, effectively steering the network's dynamics. Their influence is amplified by their connections and interactions with other users, further solidifying their role as the primary drivers of engagement. As a result, understanding and engaging with this core cluster is crucial for influencing the network's overall activity and fostering a vibrant, interactive online community. This hypothesis aligns with classical social network theory, where centrality measures are indicative of influence. Degree centrality denotes direct connectivity, while eigenvector centrality captures the influence of neighbors, effectively measuring a user's position within the broader network. As Wei et al. [35], Yu et al. [36], and Namisango [37] have shown, users with high centrality often act as key disseminators of information, amplifying diffusion processes in both online and offline systems. These theoretical foundations support the assertion that users with high degree and eigenvector centrality drive the spread of content such as hate speech.
Hypothesis 3: The core cluster of highly active users will drive the majority of interactions and engagement within the network.
Negative sentiment posts will cluster together and exhibit higher levels of contention and debate is based on the rationale that posts expressing disagreement or criticism are likely to attract responses from users with opposing views, leading to concentrated areas of negative engagement. In social media networks, negative sentiment posts often serve as focal points for controversy and debate, drawing in users who feel compelled to counter or support the negative opinions expressed [38]. This interaction creates dense clusters of activity around these posts, characterized by heightened levels of contention and debate. Users engaged in these discussions are typically more vocal and reactive, leading to a proliferation of comments and interactions centered on the negative sentiment. As a result, areas of the network with frequent negative posts become hotspots for intense discussions and polarized interactions, reflecting the dynamic and often contentious nature of online discourse driven by conflicting viewpoints.
Hypothesis 4: Negative sentiment posts will cluster together and exhibit higher levels of contention and debate.
2.3 Mathematical model
The model is expressed as:
$\frac{d u_i}{d t}=\beta\left(1-u_i\right) \sum_{j \in \mathrm{~N}(i)} A_{i j} u_j-\gamma u_i, \forall i \in V$ (1)
The parameters of the Susceptible-Infected-Susceptible (SIS) model, particularly the transmission rate (β) and the recovery rate (γ), are calibrated based on empirical observations of engagement behavior in political Twitter networks. Similar values have been applied in prior studies examining rumor spread, misinformation diffusion, and content virality in digital social systems. The chosen β reflects the rapidity of content reshares and replies, while γ approximates the average time users stop engaging with hate content following moderation or personal disengagement. Sensitivity analyses were also conducted to validate threshold behaviors around these values. Where $u_i(t)$ is the probability that user $i$ is “infected” with hate speech at time $t$, $A_{i j}$ represents the connection between user $j$ and user $i$ in the network (1 if there is an interaction, 0 otherwise), $N_i$ denotes the set of users connected to user $i$, β is the transmission rate, reflecting how quickly hate speech spreads through interactions, γ is the recovery (or moderation) rate, indicating the likelihood of a user ceasing to spread hate speech. This equation models the change in the probability that a user is propagating hate speech. The first term, $\beta\left(1-u_i\right) \sum j \in N(i) A_{i j} u_j$, describes the rate at which a non-infected user becomes infected based on the influence from their connected users. The second term, $\gamma u_i$ accounts for the recovery process where infected users reduce their hate speech propagation.
Under a mean-field approximation, where $u(t)=\frac{1}{N} \sum_{i=1}^N u_i(t)$ and assuming a homogeneous network with an average degree $\langle k\rangle$, the dynamics can be approximated by:
$\frac{d u}{d t}=\beta\langle k\rangle u(1-u)-\gamma u$ (2)
This logistic-type equation reveals that if the effective reproduction number $R_0=\frac{\beta\langle k\rangle}{\gamma}>1$, hate speech can become endemic in the network. Conversely, if $R_0<1$, the spread will eventually die out.
2.4 Dynamic network evolution
In this approach, a directed graph $G=(V, E)$ is first constructed from social media data by treating each user as a node and each mention or reply as a directed edge where each node $i \in V$ represents a user, and each directed edge $(j \rightarrow i) \in E$ indicates a mention or reply from user j to user i. Each user is then assigned an initial probability of propagating hate speech, reflecting their past behavior. The model evolves in discrete time steps using a modified SIS equation, where the probability of hate speech transmission depends on both the user’s neighbors and a recovery rate. To visualize this process, nodes are color-coded based on their current likelihood of posting hateful content, with higher intensities indicating a stronger propensity. Finally, time-lapse animations of these updates reveal how clusters of hate speech emerge, grow, and potentially dissipate, illustrating the network’s dynamic evolution and identifying key influencers.
2.5 Time series and histogram analysis
In this method, we first calculate the global measure of hate speech propagation across the network by averaging each user’s probability of posting hateful content, given by $\bar{u}(t)=\frac{1}{|V|} \sum_{i=1}^{|V|} u_i(t)$. Plotting $\bar{u}(t)$ over discrete time steps provide a time series illustrating how the overall level of hate speech evolves, where a steep rise indicates rapid spread and a plateau suggests a stable equilibrium. In parallel, histograms of engagement metrics (e.g., response rates, sentiment scores) are generated at each time step or at key intervals to reveal how user interactions change in conjunction with $\bar{u}(t)$. By comparing shifts in these histograms such as increases in negative sentiment or spikes in commenting behavior with fluctuations in $\bar{u}(t)$, we gain insights into how engagement dynamics correlate with the spread of hateful content.
2.6 Cluster-based visualization enhancements
In this method, users in the network are first grouped into clusters (e.g., via K-means or modularity-based algorithms) based on centrality measures or interaction patterns. The SIS equation $\frac{d u_i}{d t}=\beta\left(1-u_i\right) \sum_{j \in \mathrm{~N}(i)} A_{i j} u_j-\gamma u_i, \forall i \in V$ remains the core model driving each user’s probability of spreading hate speech. By overlaying cluster labels on the network visualization, we can track cluster-level averages of the probability of hate speech propagation, computed as
$\overline{u_C}(t)=\frac{1}{|C|} \sum_{i \in|C|} u_i(t)$ (3)
where, C denotes a specific cluster. This reveals which clusters are more prone to hate speech and how bridging nodes those with high betweenness centrality may facilitate or inhibit spread across clusters. Tailored interventions can then focus on these critical clusters or bridging nodes, aiming to reduce the overall network-wide hate speech prevalence.
3.1 Summary of simulation
The engagement metrics from the social media analysis of the 2019 Indonesian presidential election reveal significant insights into user interaction patterns. The mean engagement rate is 132.57, with a substantial standard deviation of 52.83, indicating varied user responses across different posts. The response rate, with a mean of 27.29% and a standard deviation of 17.96%, shows that comments are a notable part of user interactions, although higher response rates are less common. The engagement sentiment, averaging at 40.27 with a standard deviation of 53.79, suggests a predominance of positive sentiment, but there is also a notable presence of negative sentiment, as evidenced by the range from -87.81 to 162.41. This spread highlights diverse emotional reactions from users, with many posts generating significant positive engagement while others attract negative sentiment. The top engaging posts, primarily supporting Prabowo, underline the influence of specific content in driving user engagement. Understanding these metrics can help in tailoring strategies to enhance user interaction and foster a more engaged and positive community.
Table 1 presents key engagement metrics that shed light on the variability and nature of user interactions. The mean engagement rate of 132.57, with a standard deviation of 52.83, indicates moderate-to-high variability, suggesting that some posts attract significantly more user responses than others. At the lower bound, the engagement rate can be as small as 8.00, while the highest value recorded is 255.00, highlighting the uneven distribution of user activity. Meanwhile, the mean response rate stands at 27.29%, with a range extending from 0.00% to 97.35%, underscoring differences in how users engage through comments. Sentiment values span from -87.81 (highly negative) to 162.41 (strongly positive), reflecting a wide spectrum of emotional reactions. Overall, these figures underscore the complexity of social media engagement, where content can elicit varying degrees of participation and sentiment, ranging from supportive to contentious discourse.
Table 1. Engagement metrics
|
Metric |
Value |
|
Mean Engagement Rate |
132.57 |
|
Standard Deviation |
52.83 |
|
Minimum Engagement Rate |
8.00 |
|
Maximum Engagement Rate |
255.00 |
|
Mean Response Rate |
27.29% |
|
Standard Deviation |
17.96% |
|
Minimum Response Rate |
0.00% |
|
Maximum Response Rate |
97.35% |
|
Mean Engagement Sentiment |
40.27 |
|
Standard Deviation |
53.79 |
|
Minimum Engagement Sentiment |
-87.81 |
|
Maximum Engagement Sentiment |
162.41 |
The Table 2 analysis of the top engaging posts from the 2019 Indonesian presidential election reveals those posts supporting Prabowo dominate in terms of engagement rate. The highest engaging post, "Prabowo is the best #2019GantiPresiden" by user11, achieved an engagement rate of 255.00, followed closely by similar posts from user18, user39, user14, and user91, each with engagement rates exceeding 243.00. These posts consistently resonate with users, driving significant interactions. The prominence of Prabowo-supportive content among the top engaging posts highlights a strong and active user base rallying around this political figure. The high engagement rates indicate that these posts effectively capture user attention and provoke interaction, suggesting that content aligned with popular political sentiments can significantly boost user engagement. This insight can inform future content strategies, emphasizing the importance of aligning messages with the audience's interests and sentiments to maximize engagement.
Table 2. Top engaging posts
|
Rank |
Username |
Text |
Engagement Rate |
|
1 |
user11 |
Prabowo is the best #2019GantiPresiden |
255.00 |
|
2 |
user18 |
Prabowo is the best #2019GantiPresiden |
247.67 |
|
3 |
user39 |
@user30 Prabowo has great policies |
245.33 |
|
4 |
user14 |
Prabowo is the best #2019GantiPresiden |
244.00 |
|
5 |
user91 |
@user90 Prabowo has great policies |
243.33 |
The positive engagements in Table 3 cluster in the social media analysis of the 2019 Indonesian presidential election predominantly features posts expressing support for Jokowi and Prabowo. These posts have engagement sentiments ranging from 5.49 to 102.48, indicating varying levels of positive emotional reactions from users. Examples include "I support Jokowi #Pilpres2019" and "@user70 Prabowo has great policies," which generate significant positive interaction. This cluster, with 685 posts, underscores the effectiveness of positive political endorsements in fostering user engagement. The widespread positive sentiment suggests that users are more likely to engage with content that aligns with their political preferences and expresses supportive views. This insight highlights the importance of crafting positive, affirming messages to drive higher user engagement and build a more active and supportive online community.
Table 3. Positive engagements cluster
|
Username |
Text |
Engagement Sentiment |
|
user38 |
I support Jokowi #Pilpres2019 |
69.26 |
|
user16 |
I support Jokowi #Pilpres2019 |
88.82 |
|
user49 |
@user70 Prabowo has great policies |
102.48 |
|
user17 |
I support Jokowi #Pilpres2019 |
43.81 |
|
user21 |
@user14 Prabowo has great policies |
47.91 |
The negative engagements in Table 4 cluster in the social media analysis of the 2019 Indonesian presidential election comprises 148 posts characterized by sentiments of disagreement or criticism. These posts have engagement sentiments ranging from -61.98 to -11.71, indicating strong negative reactions from users. Common examples include "@user31 I disagree with you!" and similar posts directed at other users. This cluster reflects significant contention and disagreement within the user base, often centering around contentious political views or direct rebuttals to other users' opinions. The prevalence of negative engagements highlights the presence of polarized opinions and active debate among users. Understanding this cluster is crucial for managing and mitigating conflict within the online community, as it underscores the need for strategies that address and resolve disagreements constructively. By fostering respectful dialogue and addressing the underlying causes of negative sentiment, it is possible to reduce friction and enhance the overall quality of user interactions.
Table 4. Negative engagements cluster
|
Username |
Text |
Engagement Sentiment |
|
user66 |
@user31 I disagree with you! |
-61.98 |
|
user96 |
@user93 I disagree with you! |
-57.40 |
|
user95 |
@user98 I disagree with you! |
-30.16 |
|
user36 |
@user51 I disagree with you! |
-42.13 |
|
user79 |
@user80 I disagree with you! |
-29.40 |
3.2 Social network analysis
To understand the pattern of user engagement across social media posts during the 2019 Indonesian presidential election, we analyzed the distribution of engagement rates. This measure reflects the overall interaction each post received, including likes, shares, and comments. The histogram below illustrates how these engagement rates are distributed, providing insight into the frequency and variability of user interactions with political content.
Figure 1 shows that the engagement rate distribution approximates a normal distribution, with most posts clustered between 100 and 150 interactions. The peak frequency falls around the 125 marks, indicating that a significant number of posts received moderate engagement. The symmetrical shape suggests balanced user interaction across the dataset, though outliers exist at both the low and high ends. This pattern implies that while a majority of posts generated average engagement, a select few were either highly successful or largely overlooked. Such distribution characteristics provide a basis for identifying viral content and understanding the dynamics of digital political discourse.
Figure 1. Engagement rate distribution
The majority of posts have an engagement rate between 50 and 200, with the highest frequency observed in the 100-150 range, indicating moderate user interaction with most posts. The distribution shows a range from 0 to about 250, with a few posts having very low (below 50) or very high (above 200) engagement rates, suggesting variability in post effectiveness. The standard deviation of 52.83 highlights this spread around the mean, confirming significant variability in user engagement. The histogram suggests that while most posts received moderate engagement, certain posts were exceptionally successful, and some failed to engage users. Further analysis of the top-engaging posts could provide insights into effective content strategies, while understanding low-engagement posts might help identify areas for improvement.
To further examine user engagement behavior, we analyzed the distribution of response rates, defined as the proportion of total engagements that are comments or replies rather than passive interactions like likes or shares. This metric offers insight into the extent of active participation in online discussions. The following histogram displays how response rates are distributed across the dataset, highlighting the level of conversational depth within user interactions.
Figure 2 illustrates a right-skewed distribution of response rates, with the majority of values falling between 0.1 and 0.4, and a peak around the 0.2 to 0.3 interval. This indicates that while a subset of posts generated substantial user conversation, most received only moderate levels of active engagement. The long tail extending toward higher response rates suggests that a small number of posts triggered highly interactive discussions. Such findings reveal that although conversation exists, it tends to be concentrated around specific content, pointing to the presence of potentially polarizing or highly resonant messages within the network.
Figure 2. Response rate distribution
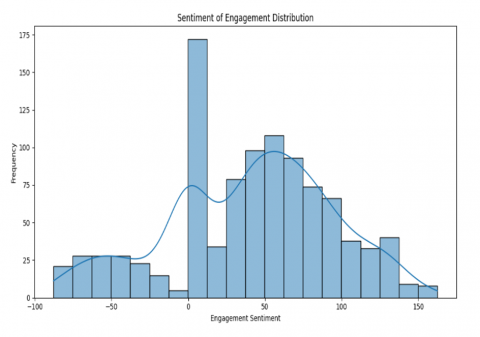
To evaluate the emotional tone of user interactions, we analyzed the engagement sentiment distribution, which reflects the polarity of reactions to each post. Sentiment scores are derived from natural language processing tools that classify content along a scale from negative to positive. The histogram below illustrates how sentiment is distributed across all engagement instances, offering insights into the emotional climate of online discourse during the election period.
Figure 3 reveals a bimodal sentiment distribution with two prominent peaks one near zero, indicating neutral sentiment, and another between 50 and 75, representing a strong prevalence of positive interactions. The left tail of the distribution indicates a substantial number of negative sentiments, though these are less frequent than positive ones. The concentration around zero suggests that a large portion of user interactions were emotionally neutral, while the positive skew indicates a tendency toward favorable content engagement. This pattern highlights both the presence of polarized emotional responses and a dominant preference for affirming or supportive content among users.
Figure 3. Sentiment of engagement distribution
To complement the visual representation of sentiment distribution, a detailed statistical analysis was conducted to quantify key sentiment engagement metrics. This analysis provides a comprehensive overview of emotional responses to social media content during the 2019 Indonesian presidential election. Table 5 summarizes central tendency measures, sentiment polarity ranges, and analytical insights related to the skewness and implications of user sentiment.
As shown in Table 5, the mean sentiment of engagement is 40.27 with a standard deviation of 53.79, indicating a wide range of emotional responses. The sentiment values range from a highly negative minimum of -87.81 to a strongly positive maximum of 162.41, with the most frequent sentiment score recorded at 0, highlighting the dominance of neutral posts. The skewness toward positive sentiment reveals that users were generally more responsive to affirming content. These findings suggest that leveraging positive sentiment posts may be effective for increasing engagement, while neutral posts present opportunities for improvement through enhanced content design or messaging strategies.
Table 5. Analysis of sentiment of engagement distribution
|
Metric |
Value |
|
Mean sentiment of engagement |
40.27 |
|
Standard deviation |
53.79 |
|
Minimum sentiment of engagement |
-87.81 |
|
Maximum sentiment of engagement |
162.41 |
|
Most frequent sentiment value |
0 |
|
Positive sentiment range |
0 to 150 |
|
Negative sentiment range |
-100 to 0 |
|
Skewness |
Towards positive sentiment |
|
Implication |
Positive engagements are more frequent and varied compared to negative engagements |
|
Recommendation |
Leverage positive sentiment posts to enhance user engagement strategies and investigate neutral posts for potential improvements |
To visualize the interaction structure within the social media dataset, a directed network graph was constructed where nodes represent users and edges indicate mentions or replies between them. This visualization provides insight into the topology of communication, the formation of influential user clusters, and the directional flow of information. Figure 4 below illustrates the resulting network and highlights the interaction density among users during the political discourse.
Figure 4. Network graph
As seen in Figure 4, the network is characterized by a densely interconnected core cluster at the center, surrounded by multiple peripheral nodes and several isolated users. The central cluster represents highly active users who frequently engage with one another, indicating their potential role as key influencers or discussion leaders. The directed edges converging toward certain central nodes emphasize the existence of opinion leaders or information hubs. Meanwhile, the peripheral and isolated nodes suggest sporadic participation or limited influence. This structural composition reinforces the importance of targeting central clusters for intervention strategies aimed at mitigating hate speech and enhancing discourse quality within the network. Additionally, a few isolated nodes with minimal connections are present, indicating users with low engagement or sporadic participation. Overall, the network structure reveals a central hub of active engagement, surrounded by less active users, with key influencers playing a significant role in facilitating discussions. This structure can provide insights into how information and influence propagate within the network, highlighting potential strategies for increasing user engagement and integrating peripheral users more effectively. The network graph reveals a densely connected central cluster of highly active users who frequently engage with one another, indicating a core group that likely includes key influencers or opinion leaders shaping the discourse. The convergence of many edges towards central nodes highlights these influential users, whose reach within the network can be leveraged for targeted communication strategies. Peripheral nodes connected to the central cluster suggest occasional engagement from a broader audience, while isolated nodes with minimal connections point to users with low engagement. Enhancing engagement strategies could involve leveraging the influence of central nodes, promoting user-generated content, and creating opportunities for peripheral and isolated users to participate more actively. Overall, the network's structure suggests a healthy community with active participation, but continuous monitoring and adaptive strategies are recommended to maintain balance and inclusivity.
3.3 Clustering analysis
To further analyze the structure and influence patterns within the social media network, users were grouped into clusters based on three centrality metrics: degree centrality, betweenness centrality, and eigenvector centrality. These measures respectively capture a user’s direct connections, bridging role, and influence within the broader network. The clustering process helps identify key actors and structural roles that facilitate or constrain the spread of information. Table 6 presents the clustering results, showing centrality values and cluster assignments for representative users.
Table 6. Clustering results based on centrality measures
|
Node |
Degree Centrality |
Betweenness Centrality |
Eigenvector Centrality |
Cluster |
|
user38 |
0.050505 |
0.016125 |
0.049268 |
1 |
|
user16 |
0.040404 |
0.005441 |
0.010346 |
1 |
|
user49 |
0.050505 |
0.003991 |
0.002061 |
1 |
|
user70 |
0.070707 |
0.063157 |
0.055477 |
2 |
|
user17 |
0.030303 |
0.000000 |
0.000000 |
1 |
|
user21 |
0.020202 |
0.000000 |
0.000000 |
1 |
|
user14 |
0.080808 |
0.054964 |
0.073266 |
2 |
|
user62 |
0.101010 |
0.054662 |
0.166909 |
0 |
|
user97 |
0.070707 |
0.017842 |
0.184073 |
0 |
|
user74 |
0.060606 |
0.039082 |
0.150285 |
2 |
As shown in Table 6, three distinct clusters emerge from the centrality analysis. Cluster 0 consists of highly influential users with the highest eigenvector centrality, indicating strong integration into the network's most connected core. Cluster 1 includes users with moderate connectivity but limited bridging or influence, suggesting they are regular participants without significant outreach. Cluster 2 features users with elevated betweenness centrality, positioning them as strategic bridges who facilitate information flow between otherwise disconnected groups. These findings reinforce the importance of both core influencers and bridging nodes in shaping the dynamics of hate speech propagation. Tailored moderation and communication strategies can be developed by focusing on these structurally significant user groups.
3.4 Discussion
The integrated approach combining social network analysis, a modified SIS model, and cluster-based visualization offers a comprehensive understanding of hate speech dynamics on social media. From the network perspective, the directed graph analysis confirmed that a small set of highly connected nodes users with elevated degree or eigenvector centrality plays a disproportionately large role in disseminating hateful content. These findings align with the SIS model’s prediction that influential users act as “super-spreaders,” accelerating transmission if the effective reproduction number $R_0=\frac{\beta\langle k\rangle}{\gamma}>1$ exceeds unity. The dynamic network evolution revealed that hate speech tends to concentrate within certain clusters, underscoring the importance of community structure in moderating online discourse. The animated simulations showed that once a core group of users reached a high probability of hate speech engagement, peripheral clusters became progressively infected, indicating a strong bridging effect. This phenomenon was particularly visible in nodes with high betweenness centrality, which served as conduits connecting otherwise distinct sub-communities.
Meanwhile, time series analyses of the average propagation level $\bar{u}(t)$ demonstrated threshold behavior: in scenarios with a high transmission rate $(\beta)$ relative to the recovery rate $(\gamma)$, $\bar{u}(t)$ reached a stable yet high level, reflecting an endemic state of hate speech. When moderation efforts increased or user-to-user transmission decreased, $\bar{u}(t)$ eventually dropped, pointing to the model’s sensitivity to interventions. The histogram analyses further supported these observations, as spikes in hate speech probability were frequently accompanied by increases in negative sentiment and conflict-laden engagement. Overall, the results highlight the value of a multidisciplinary lens that combines quantitative modeling with digital humanities approaches. The SIS framework elucidates the underlying mechanisms of hate speech spread, while the visualization and clustering methods pinpoint where interventions are most needed. Future research can refine this model by incorporating user-specific attributes (e.g., demographics, language preferences) and by examining how real-time content moderation strategies such as automated detection and prompt takedown alter the network’s threshold dynamics. This integrative methodology thus provides both a theoretical foundation and practical guidance for platforms and policymakers aiming to curtail hateful content and foster healthier online communities.
This research underscores the value of combining digital humanities approaches, social network analysis, and mathematical modeling to address hate speech on social media. By identifying influential users, core clusters, and critical bridging nodes, the study points toward targeted interventions that can substantially reduce the overall prevalence of hateful content. Specifically, platform moderators and policymakers can prioritize monitoring and engagement strategies for the most influential and connective users, who have a disproportionate effect on hate speech dissemination. Furthermore, the SIS-based model illustrates threshold dynamics, showing how even modest improvements in moderation (increasing recovery rate $(\gamma)$ or reductions in transmission $(\beta)$ can significantly lower the steady-state level of hate speech. These findings inform content moderation policies and platform design features aimed at interrupting transmission pathways and promoting de-escalation within highly active clusters. Ultimately, the integrative methodology provides a framework for more evidence-based decisions, helping social media platforms and legislators to foster healthier, more respectful online communities.
This study presents a novel interdisciplinary framework that merges mathematical modeling and digital humanities to understand hate speech propagation on social media. Using a modified SIS model integrated with sentiment analysis and network centrality, we identify core influencers, polarized clusters, and propagation thresholds. Unlike prior studies that relied on static analysis or single-layer metrics, this research incorporates dynamic simulations and cluster-based visualization, offering deeper insights into how hate speech evolves in time and space within digital networks. The findings underscore the importance of targeted moderation policies focusing on key influencers and bridging nodes. By understanding the interplay between sentiment, structure, and user behavior, platforms can design more proactive and adaptive strategies for mitigating online hate speech. This work contributes a scalable methodology applicable to other forms of harmful content and opens avenues for further integration of sociotechnical models in content moderation research.
[1] Tulus, T., Sy, S., Sugeng, K.A., Simanjuntak, R., Marpaung, J.L. (2024). Improving data security with the utilization of matrix columnar transposition techniques. In E3S Web of Conferences. EDP Sciences, 501: 02004. https://doi.org/10.1051/e3sconf/202450102004
[2] Sinulingga, S., Marpaung, J.L., Sibarani, H.S., Amalia, A., Kumalasari, F. (2024). Sustainable tourism development in Lake Toba: A comprehensive analysis of economic, environmental, and cultural impacts. International Journal of Sustainable Development & Planning, 19(8): 2907-2917. https://doi.org/10.18280/ijsdp.190809
[3] Blokland, A., Daser, A., de Boer, M., Gannon, C. (2024). Why do users continue to contribute to darknet child sexual abuse material forums? Examining social exchange, social capital, and social learning explanations using digital forensic artifacts. Child Abuse & Neglect, 153: 106815. https://doi.org/10.1016/j.chiabu.2024.106815
[4] Richards, P.M. (2025). Using researcher designed digital games to examine how game-mechanics impact pragmatic development: Some issues at play. Research Methods in Applied Linguistics, 4(2): 100203. https://doi.org/10.1016/j.rmal.2025.100203
[5] Chan, C. (2019). Using digital storytelling to facilitate critical thinking disposition in youth civic engagement: A randomized control trial. Children and Youth Services Review, 107: 104522. https://doi.org/10.1016/j.childyouth.2019.104522
[6] Hudha, C. (2025). Shaping democracy in Indonesia: The influence of multicultural attitudes and social media activity on participation in public discourse and attitudes toward democracy. Social Sciences & Humanities Open, 11: 101440. https://doi.org/10.1016/j.ssaho.2025.101440
[7] Helbing, D., Mahajan, S., Fricker, R.H., Musso, A., et al. (2023). Democracy by design: Perspectives for digitally assisted, participatory upgrades of society. Journal of Computational Science, 71: 102061. https://doi.org/10.1016/j.jocs.2023.102061
[8] Reisach, U. (2021). The responsibility of social media in times of societal and political manipulation. European Journal of Operational Research, 291(3): 906-917. https://doi.org/10.1016/j.ejor.2020.09.020
[9] Mueller, M.L. (2025). It's just distributed computing: Rethinking AI governance. Telecommunications Policy, 102917. https://doi.org/10.1016/j.telpol.2025.102917
[10] Marpaung, T.J. (2019). Computational analysis of water wheel for hydro-electric power. Journal of Physics: Conference Series. IOP Publishing, 1376(1): 012017. https://doi.org/10.1088/1742-6596/1376/1/012017
[11] Hasibuan, C.D., Siahaan, D.A.S., Manurung, A., Marpaung, J.L. (2024). Stability analysis of spread of infectious diseases COVID-19 using SEIAR-V1V2Q model for asymptomatic condition with runge-kutta order 4. Mathematical Modelling of Engineering Problems, 11(5): 1348-1354. https://doi.org/10.18280/mmep.110526
[12] Gultom, P., Marpaung, J.L., Weber, G.W., Sentosa, I., Sinulingga, S., Putra, P.S.E., Agung, V.R. (2024). Optimizing the selection of the sustainable micro, small, and medium-sized enterprises development center using a multi-criteria approach for regional development. Mathematical Modelling of Engineering Problems, 11(11): 2977-2987. https://doi.org/10.18280/mmep.111110
[13] Taranenko, A. (2024). Ensuring information security: Countering Russian disinformation in Ukrainian speeches at the United Nations. Social Sciences & Humanities Open, 10: 100987. https://doi.org/10.1016/j.ssaho.2024.100987
[14] Oleksiyuk, T. (2025). The right to access official information as a resilience-improving tool: Ukrainian lessons during wartime. Social Sciences & Humanities Open, 11: 101549. https://doi.org/10.1016/j.ssaho.2025.101549
[15] Dillon, C., Joshi, V., Sabic-El-Rayess, A. (2024). Addressing extremist abuses of medieval pasts: A connection-first approach to narratives of hate. International Journal of Educational Development, 111: 103160. https://doi.org/10.1016/j.ijedudev.2024.103160
[16] Sánchez-Sánchez, A.M., Ruiz-Muñoz, D., Sánchez-Sánchez, F.J. (2024). Research trends in the bias-based aggression among youth. Children and Youth Services Review, 158: 107444. https://doi.org/10.1016/j.childyouth.2024.107444
[17] Liagusha, A., Iarovyi, D. (2025). Memes, freedom, and resilience to information disorders: Information warfare between democracies and autocracies. Social Sciences & Humanities Open, 11: 101247. https://doi.org/10.1016/j.ssaho.2024.101247
[18] Bernstein, J.D. (2024). The billionaire space race: Internet memes and the netizen response to space tourism. Annals of Tourism Research Empirical Insights, 5(1): 100122. https://doi.org/10.1016/j.annale.2024.100122
[19] Suitner, C., Badia, L., Clementel, D., Iacovissi, L., Migliorini, M., Casara, B.G.S., Solimini, D., Formanowicz, M., Erseghe, T. (2023). The rise of# climateaction in the time of the FridaysForFuture movement: A semantic network analysis. Social Networks, 75: 170-185. https://doi.org/10.1016/j.socnet.2022.06.003
[20] Macanovic, A. (2022). Text mining for social science–The state and the future of computational text analysis in sociology. Social Science Research, 108: 102784. https://doi.org/10.1016/j.ssresearch.2022.102784
[21] Wahid, S.H. (2024). Exploring the intersection of Islam and digital technology: A bibliometric analysis. Social Sciences & Humanities Open, 10: 101085. https://doi.org/10.1016/j.ssaho.2024.101085
[22] Arslan, M., Munawar, S., Cruz, C. (2024). Political events using RAG with LLMs. Procedia Computer Science, 246: 5027-5035. https://doi.org/10.1016/j.procs.2024.09.576
[23] Ghaly, R., ElKorany, A., Ezzat, C.A. (2024). Hate speech detection in Arabic Text: Survey. Procedia Computer Science, 244: 166-177. https://doi.org/10.1016/j.procs.2024.10.222
[24] Scotland, J., Thomas, A., Jing, M. (2024). Public emotion and response immediately following the death of George Floyd: A sentiment analysis of social media comments. Telematics and Informatics Reports, 14: 100143. https://doi.org/10.1016/j.teler.2024.100143
[25] Nairn, A., Matthews, J. (2024). Are people's COVID-19 attitudes discriminatory or justified? A thematic analysis of New Zealander's responses to the pandemic. Social Sciences & Humanities Open, 9: 100890. https://doi.org/10.1016/j.ssaho.2024.100890
[26] Malgieri, G., Santos, C. (2025). Assessing the (severity of) impacts on fundamental rights. Computer Law & Security Review, 56: 106113. https://doi.org/10.1016/j.clsr.2025.106113
[27] Nave, E., Lane, L. (2023). Countering online hate speech: How does human rights due diligence impact terms of service? Computer Law & Security Review, 51: 105884. https://doi.org/10.1016/j.clsr.2023.105884
[28] Joshi, B., Joshi, B.K., Pant, S., Kumar, A., Sharma, H.K. (2025). An efficient method for detecting cyberbullying using supervised machine learning techniques. Procedia Computer Science, 258: 1254-1261. https://doi.org/10.1016/j.procs.2025.04.359
[29] Sofiyah, F.R., Dilham, A., Lubis, A.S., Hayatunnufus, Marpaung, J.L., Lubis, D. (2024). The impact of artificial intelligence chatbot implementation on customer satisfaction in Padangsidimpuan: Study with structural equation modelling approach. Mathematical Modelling of Engineering Problems, 11(8): 2127-2135. https://doi.org/10.18280/mmep.110814
[30] Silalahi, A.S., Yulinda, A.S.L., Gultom, P., Marpaung, J.L., Nurhadi, I. (2024). International journal of energy production and management. Management, 9(3): 161-170. https://doi.org/10.18280/ijepm.090305
[31] Rasani, M.R., Rahman, M.M., Marpaung, T.J., Siringoringo, Y.B., Marpaung, J.L. (2024). Biomedical simulation of non-newtonian fluid dynamics in cardiovascular systems: A finite volume method approach to pulsatile flow and atherosclerosis analysis. International Journal of Energy Production and Management, 9(4): 275-285. http://dx.doi.org/10.18280/ijepm.090408
[32] Sofiyah, F.R., Dilham, A., Hutagalung, A.Q., Yulinda, Y., Lubis, A.S., Marpaung, J.L. (2024). The chatbot artificial intelligence as the alternative customer services strategic to improve the customer relationship management in real-time responses. International Journal of Economics and Business Research, 27(5): 45-58. https://doi.org/10.1504/IJEBR.2024.139810
[33] Akar, E. (2022). Let's get united and cleartheshelters: The factors contributing to users' network centrality in online social networks. Journal of Information Technology Research (JITR), 15(1): 1-18. https://doi.org/10.4018/JITR.299943
[34] Li, S., Quan, Y., Luo, X., Wang, J. (2025). Influential nodes identification for complex networks based on multi-feature fusion. Scientific Reports, 15(1): 11440. https://doi.org/10.1038/s41598-025-94193-w
[35] Wei, Q., Ling, X., Hu, J. (2025). Quantification and analysis of group sentiment in electromagnetic radiation public opinion events. Applied Sciences, 15(9): 5209. https://doi.org/10.3390/app15095209
[36] Yu, Q., Yu, Z., Ma, D. (2020). A multiplex network perspective of innovation diffusion: An information-behavior framework. IEEE Access, 8: 36427-36440. https://doi.org/10.1109/ACCESS.2020.2975357.
[37] Namisango, F. (2020). Realising service co-creation through social media: A Nonprofits’ perspective. Available: https://opus.lib.uts.edu.au/handle/10453/143894%0Ahttps://opus.lib.uts.edu.au/bitstream/10453/143894/2/02whole.pdf.
[38] Deng, W., Deng, J., Arebi, P. (2025). Detection of effective devices in information dissemination on the complex social internet of things networks based on device centrality measures. Complexity, 2025(1): 2919169. https://doi.org/10.1155/cplx/2919169