Abdelkarim Slimani*![]() | Lylia Bahmed
| Lylia Bahmed![]() | Djilali Chacha
| Djilali Chacha![]() | Kamel Gouaref
| Kamel Gouaref![]() | Mohammed Bougofa
| Mohammed Bougofa![]() | Hefaidh Hadef
| Hefaidh Hadef![]()
© 2025 The authors. This article is published by IIETA and is licensed under the CC BY 4.0 license (http://creativecommons.org/licenses/by/4.0/).
OPEN ACCESS
Pipelines play an important role in Algeria’s economy, transporting large volumes of oil and gas across vast geographical areas, often passing through forested regions disposed to forest fires. The primary objective of this study is to explore the use of Geographic Information Systems (GIS) as a decision-support tool for emergency planning and management at pipeline-forest interfaces. The proposed approach involves generating decision maps (forest fire risk maps) through a structured forest fire risk assessment methodology. Based on these maps, a strategic intervention plan is developed to enhance forest fire response and mitigation efforts. Indeed, GIS technology is utilized to analyze and map critical areas, particularly those enclosures protected ecosystems, enabling rapid intervention and effective forest fire containment. The findings highlight the effectiveness of the proposed proactive management that integrates dynamic risk assessment (spatio-temporal) and GIS for rapid and targeted interventions. Expert segmentation and decision maps are used to optimize strategies, reducing the severity and spread of fires.
decision-making, forest fires, risk management, mitigation strategies, Geographic Information Systems (GIS)
Transmission pipeline is one of the most economical and efficient ways to transport; liquid resources over long distances. Fluid transportation, including oil, gas, and petroleum products, is critical around the world [1]. Due to Algeria’s constantly increasing transportation needs, the development of the transport network resulted in the construction of the first pipeline in 1959, necessitating the continuous extension of new transmission capacity, resulting in a length of 20 705 kilometers. Pipeline construction involves a variety of disciplines, including engineering, data collection, mapping, path determination, geographical information systems (GIS), and environmental and safety concerns [1].
In the context of rapid industrialization, an increasing number of pipelines have been built through forests, exposing them to a variety of failures and degradations that could cause disasters. In this regard, the Forest fires are a major environmental and safety concern, both natural and anthropogenic factors contribute to their emergence and spread. Incidents involving the loss of containment in oil and gas transmission pipelines are among the less commonly discussed but potentially catastrophic causes of forest fires [2, 3]. These critical infrastructure components cross vast expanses of forested land and, if compromised, can pose a significant fire risk.
Also, the intersection of industrial infrastructure and wildland areas, known as the wildland-industrial interface (WII), poses unique challenges for fire prevention and management [4]. Indeed, Oil and gas pipelines, which are critical for energy transportation, are potential ignition sources in the event of a containment failure. Such incidents can result in rapid and intense fire propagation, potentially causing large-scale forest fires with serious ecological, economic, and human consequences [3, 5]. In 2018, A fire broke out from an LPG pipeline of 10’’diameter, at PK10+7 in an agriculture field in Baraki (Algeria), killing three people and injuring one, causing material damage, Fruit trees burned (Land burned over an area of approximately 50,000 m²) and air pollution [6].
Transmission pipeline containment failure can be caused by a variety of factors, including corrosion, material defects, external damage, or operational errors [3]. The release of flammable hydrocarbons, often at high pressure, can create conditions favorable to ignition and subsequent fire spread. The heat generated by these incidents, combined with the abundance of fuel in forested areas, can accelerate the development and spread of forest fires [2, 4]. Understanding how fire spreads from pipeline accidents into forest areas is critical for developing effective prevention, intervention, and mitigation strategies. Likewise, analyzing historical incidents, assessing risk factors, and evaluating current preventive measures can help us better understand this emerging issue at the intersection of industrial safety and forest fire management [4].
In addition, the given the diversity and size of the pipeline database, as well as its geography, the risk assessment process can be carried out using a variety of methods depending on the problem being studied and the desired results [7], making it complex, time-consuming, and costly. To effectively plan and manage forest fires, accurate data for modeling information is required [8] for weather, topography and fuel patterns, socioeconomic conditions, and all other factors that contribute to the complexity and uncertainty of forest fire management [9]. Furthermore, this information must be easily maintained and updated to reflect current information from a variety of sources. The GIS to align with these objectives and the current applications that use the GIS technology combined by the risk assessment method have clearly demonstrated its importance and viability as a mechanism for improving program management and decision-making [8].
This study reviews the state of the art in forest fire risk and examines the benefits of GIS in risk assessment and management, bridging the two realities through the use of spatial databases and MCDM tools. These tools are advantageous in identifying high-risk areas, allowing for the optimization of prevention strategies. The source analysis enables us to subdivide the significant contributions of the GIS in forest fire risk assessment, classified into the following two main thematic categories:
(1) GIS and Fire Risk Mapping
The study carried out by Demir and Akay [10] identified tree species and stand age as significant risk factors, and the GIS-based models demonstrated a 74% accuracy in predicting fire occurrence. In addition, the Rota et al. [11] used GIS to model the forest fire risk, considering topography, stand structure, and anthropogenic variables. This approach has practical implications; in fact, the support systems have been development for effective forest fire management. Furthermore, the study by Goodchild [12] utilized GIS to assess the forest fire risk through a spatial analysis of slope, elevation, and vegetation. The risk estimates are then mapped to support targeted interventions for enhancing fire prevention actions and mitigating the fire's impact. For a more detailed understanding, refer to these studies [13-15].
(2) Integration with Multi-Criteria Decision Analysis (MCDA)
The use of GIS in combination with MCDM models, including the Analytic Hierarchy Process (AHP) method, enables more accurate forest fire risk assessment using various criteria [16]. The AHP approach, which has been successfully applied to obtain fire risk mapping, aligns well with past forest fire occurrences, instilling confidence in its reliability for future assessments [10]. And the integration the AHP method and GIS mapping was used to map fire-sensitive areas in the southern region of Amazonia [17].
Likewise, Akay and Erdoğan [18] proposed a refined and advanced GIS-based MCDM technique to address the complex issue of natural gas pipeline corridors. Here, a significant trade-off exists between environmental sensitivity and economic benefits. The study presented by Sakellariou et al. [19] provided a survey of geomatics tools for forest fire management applicable to integrated forest fire analysis.
The forest fire risk assessment tools, such as GIS, are used to map spatial fire hazard zones incorporating criteria such as human activity patterns, vegetation conditions and terrain types. This spatial approach is in line with the search for evidence-based decision making in the prevention and management of forest fires [20, 21].
The analysis of the literature review demonstrates two major methodologies for forest fire management by GIS as follows: (i) Risk zone mapping, based on the GIS database, was used for identifying vulnerable zones and cross-sectorial vulnerability for climate risk assessment. And (ii) integration of multiple criteria. The integration of GIS and decision-support methods permits a simultaneous evaluation of several criteria (e.g., environmental hazard, economic cost, accessibility) to optimize management decisions for prediction and/or mitigation in forest fire prevention systems.
While GIS and MCDM techniques have made significant progress in forest fire risk assessment [16, 22, 23], their application is compromised by two major constraints: (i) uncertainty in spatial data quality and (ii) the temporal variability of environmental conditions (i.e., climate, vegetation, etc.). These limitations emphasize the necessity for the integration of dual models.
To address this research gap, this study focuses on proposing the integration of GIS with a fire risk modeling system to enhance risk assessment and decision-making skills. The system estimates fire severity, generating forest fire risk maps for pipeline routes. These maps provide a valuable knowledge base that can be confidently used for effective planning and the development of fire-fighting strategies to protect the environment. This analysis considers factors such as vegetation type variability, topography, pipeline characteristics, accessibility, and human activity.
The remainder of this paper is organized as follows: Section 2 outlines the methodology used. The results of case study are presented and discussed in Section 3, and Section 4 concludes the paper and offers some perspectives.
The objective of the proposed method is to assess forest fire risks and develop an emergency response strategy using quantitative risk analysis (QRA). The process, outlined in the following steps:
2.1 Inputs data: Analysis of factors leading to forest fires and their impacts
Based on the cause–consequence analysis presented in Figure 1, the factors contributing to forest fires and their impacts will be evaluated within the framework of quantitative risk analysis (QRA). This evaluation supports a more profound understanding of forest fire risk by assessing hazard intensity, vulnerability, and the interrelationships between causal factors and their consequences. The risk of forest fires along pipeline routes is influenced by various variables, including loss of containment causes such as corrosion, third-party interference, design flaws, operational errors, and natural forces, as well as topography, vegetation types, and proximity to roads, railways, power lines, and populated areas. GIS-based models provide a better understanding of conditions in which a significant portion of forest land is being encroached upon by populations and pipelines [17], as well as how intervention and evacuation should be carried out.
Figure 1. Cause consequence analysis to study the role of pipelines in forest fires and their impact
2.2 Forest fire risk assessment process
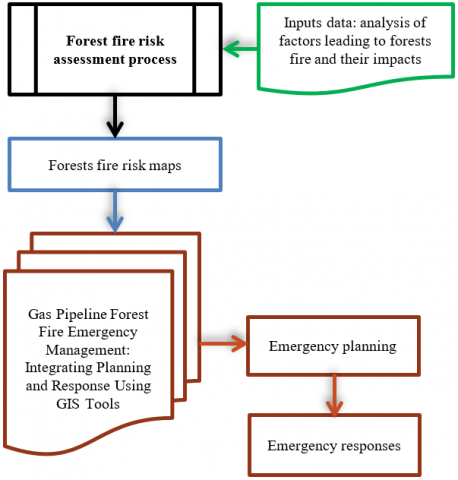
Building on the previous cause–consequence analysis, the quantitative assessment of forest fire risk in this step is structured into several key components, as defined in Figure 2: Forest Fire and Pipeline Risk Management Process. These components include the identification of critical pipeline segments, the selection of relevant risk scenarios, risk assessment procedures, and the development of forest fire risk maps (decision maps). The process additional incorporates emergency planning and response measures using GIS tools to enhance preparedness and intervention capabilities in forested areas traversed by oil and gas pipelines.
Figure 2. Forest fire and pipeline risk management process
2.2.1 Critical segment identification
This step allows the pipeline to be segmented into manageable sections using two approaches: the fixed length approach, The fixed-length approach, characterized by the application of predefined rules such as: every mile, between pump stations or between block valves, offers implementation simplicity. However, it fails to reflect the spatial variations in risk, intrinsically linked to exogenous factors. In contrast, the dynamic approach, which is based on the change of risk image, which is not constant throughout the pipeline due to the influence of climatic, demographic, geological, and other factors [24]. Being adaptable increases accuracy and responsiveness by including the risk's growth due to various environmental changes. Therefore, it is highly essential in high-sensitive areas or those through which a pipeline crosses places that have enormous geological or climatic dangers while maintaining more rigorous control of critical components.
The process involves dynamic segmentation, which is fundamental for risk assessment and comprises dividing a pipeline into units of homogeneous risk (criticality homogeneity). These zones are defined according to evolving or variable criteria depending on the case to ensure a dynamic and adaptable approach to risk management. They are based on a cross-analysis of three categories of risk factors: forest density (fuel load and natural vulnerability), proximity to firefighting units (response time) and accessibility to medical facilities (availability of emergency care).
As part of our study, segmentation was carried out using expert opinion. This approach, which draws on professional experience, field knowledge, and contextual analysis, is a highly reliable method for informing decisions. Although initially formulated, this expertise provides a solid basis for identifying high-risk areas, prioritizing safety efforts, and proposing concrete preventive measures, instilling a sense of security in the process.
This step generates a set of descriptive attributes regarding the overall segmentation of the pipeline and the vulnerability of adjacent forested areas.
2.2.2 Risk identification and scenario selection
The identification of forest fire risk as a result of a pipeline accident is dependent on various criteria unique to hydrocarbon transportation pipelines, including pipeline and transported hydrocarbon-related factors, aggravating environmental conditions, and human and industrial components. Furthermore, after the risks have been determined, the most dangerous scenarios are chosen based on their possible consequences. This selection procedure is governed by the various criteria such as: high likelihood of occurrence, major human and economic damage, and difficulty of intervention and extinction. For an enhanced implementation of this step, a multidisciplinary workshop can facilitate the identification and analysis of risks using a variety of tools and techniques [25].
2.2.3 Risk assessment
Following the identification of hazard scenarios, the next step involves analyzing the likelihood of forest fires and their potential consequences. This forest fire risk assessment prioritizes risk levels, thereby delineating areas that necessitate immediate mitigation measures. For instance, risk stratification has been categorized into High-Risk Areas, Moderate-Risk Areas, and Low-Risk Areas [25, 26].
2.3 Forests fire risk maps: Decision maps
The fire hazard decision maps generated by the merging of various layers are an important tool for decision-makers to manage and implement the best strategy to handle and confront the forest fire based on intervention planning.
For multiple stakeholders (police, towns, pipeline operators, etc.) to respond quickly, accurately, and cooperatively during emergencies like forest fires, geographic information is essential for successful decision-making. In order to assist with emergency choices, geo-information systems combine [27]:
Organizational information (risk factors, forest specifics, and topographic maps).
Decisional mapping, movement tracking, and reaction strategy optimization are all made possible by dynamic, real-time data (including incident location, size, and impacts). This integration, crucial for reducing hazards, is also a life-saving tool that protects resources and, most importantly, saves lives.
During the step of the forest fire risk assessment process that determines the various scenarios subject to intervention. Within the framework of this study, the fire risk maps are created by merging layers of flame length, surface fuel, and canopy bulk density [20]. However, some scenarios are insufficient to keep their consequences below the acceptable level. These cases should be managed through fire prevention measures [28]. And the GIS were used to create forest fire risk maps by modeling fires along pipeline routes and vegetation variations. Buffer zones were generated to identify vulnerable areas requiring prioritized protection.
2.4 Gas pipeline forest fire emergency management: Integrating planning and response using GIS tools
During the preparedness phase, decision maps developed in the preceding step were used to help decision-makers choose the most effective firefighting strategy in the event of a fire. According to decision-making research, incident commanders typically make decisions based on recognition for choosing a familiar set of actions rather than pursuing the best ones to address challenges. They evaluate potential consequences and action requirements based on danger evaluations and prior fire and accident experiences for a likely scenario [28, 29].
Emergency management must engage in a cycle of preparedness, mitigation, response, and recovery activities to save forests from significant destruction and reduce damages through timely intervention and the availability of means such as firebreaks, controlled burns, and firefighting equipment to contain fires, protect animals, and safeguard plant species.
Emergency planning (preparedness) and response is the most complex phase of the emergency management cycle, requiring complete and immediate collaboration from various actors across other sectors. The importance of collaboration cannot be overstated, as it is critical for forest fire management.
In the following section, these two steps will be explained:
2.4.1 Emergency planning
The GIS had played a key role in not just locating vital assets (like pipelines), but also in analyzing how they interact with sensitive regions in the context of emergency preparation. GIS identifies susceptible sectors where response times may be delayed due to distance or a lack of road access by mapping the geographical distribution of emergency units (firefighters, health services) about risk zones [12]. In this regard, there are two essential components were respected for emergency planning:
-Localized time evaluations for emergency actions to ensure timely interventions.
-Extinguishing capacity analysis, informed by fire growth rates and guided by invaluable fire risk maps, ensures the effectiveness of our mitigation strategies.
-Re-planning and coordination among actors from various sectors are significantly enhanced by the robust capabilities of GIS, which enables seamless integration of diverse data sources for instance: (i) static data (topography, vulnerable species, and pipeline risk factors). And, (ii) dynamic data, constantly updated in real-time (incident location, scale, and impacts), these data is used to produce decisional maps for rapid, damage-minimizing responses, ensuring the highest accuracy level.
-GIS is instrumental in identifying pipeline vulnerabilities, thereby enabling us to prioritize high-risk zones. For instance, it can distinguish between remote forested areas and urban-proximate sections, guiding our planning efforts effectively.
-Resource organization, including: (i) accessibility mapping (optimal routes, alternative access for isolated zones). (ii) Response time estimation (buffer zones around firefighting/health units to classify readiness levels). And (iii) Risk-based sector prioritization for targeted resource deployment.
-Validating contingency plans through collaboration with stakeholders (firefighting units, forest services, and pipeline operators….etc).
By integrating risk assessment, real-time data analysis, and strategic planning, GIS serves as a key decision-support tool that enhances emergency preparedness, accelerates response times, and safeguards people, property, and ecosystems.
2.4.2 Emergency response
Although the locations, scales, and intensity of the phenomena are difficult to predict, GIS can account for various scenarios based on prepared data models. This adaptability permits for the design and programming of evacuation and intervention methods from a database already prepared, ensuring readiness for a range of potential emergencies.
GIS, with its comprehensive approach, provides all possible logistics and intervention methods. It chooses the shortest routes and closest areas to intervene in the accident or incident, ensuring a thorough response that saves time and minimizes human and material damage. This approach instills confidence in the system's ability to handle emergencies effectively.
In this study, the proposed approach was validated in the following section through a case study on a gas pipeline crossing a forest area.
Without the framework of applying the proposed approach to a case study, the results and discussion of our case study are presented in this section.
3.1 Case study
The proposed methodology was applied to a 48-inch gas pipeline section operating at a pressure of 69.6 bar, traversing a 93 km route through six municipalities in the province of Guelma, northeastern Algeria—an area characterized by predominantly agricultural land use. The pipeline crosses diverse vegetation zones and mountainous, forested terrain, notably areas dominated by Mount of Olives, wild olive trees, and cork oaks. These ecosystems support rich biodiversity, including protected species under Algerian law, such as the Barbary deer, striped hyena, and kestrel.
The pipeline section reaching the village of Tamlouka splits into two branches: one extending approximately 70 km toward Skikda province, which is not included in the scope of this study, and the other stretching about 93 km toward the boundary of El Taref province, passing through the Guelma region, which constitutes the focus of the present analysis. The area experiences a humid to sub-humid Mediterranean climate, with average annual precipitation ranging between 500 and 600 mm, temperatures fluctuating between 4°C and 47℃, and relatively stable wind speeds averaging 1.9 m/s. Relative humidity remains high, ranging between 40% and 50%.
3.2 Forest fire risk assessment process
The application of the forest fire risk assessment process to the GK3 pipeline has yielded critical insights into the interaction between pipeline infrastructure and surrounding land uses.
For the segmentation process, the first step is to define objectives, explicitly finding the risks of wildfires potentially triggered by the GK3 gas pipeline and delineating the forested section of the pipeline route. The segmentation criteria, selected based on local context and available knowledge, include forest cover density (fuel load and natural vulnerability), proximity to firefighting units (response time), and accessibility to healthcare infrastructures (emergency care for victims). A qualitative evaluation framework was developed to standardize expert judgments. These experts, with their field experience and knowledge, play a leading role in mapping critical segments. Finally, a criticality-level map was produced, enabling the identification of sensitive areas and the prioritization of emergency planning, response efforts, and safety measures.
Through dynamic segmentation of the pipeline route, key landscape categories were identified including dense forests (notably cork oak woodlands), reforestation areas, mountainous terrain, rangelands, and agricultural plots. This geospatial categorization enabled a precise and reliable evaluation of risk exposure based on land cover, topography, and accessibility.
The study modeled a loss of containment (LOC) scenario affecting a pipeline segment traversing high-risk forested areas dominated by cork oak and reforested vegetation. The analysis was comprehensive, focusing on estimating both the surface area potentially impacted by fire and the associated environmental and material losses.
To assess the likelihood of such an event, the study utilized established databases and international benchmarks to determine failure frequencies for gas transmission pipelines due to corrosion, third-party interference, and operational faults. These frequency values were used to calculate the probability of failure and ignition, summarized in Table 1. The methodological foundation of our study line up with recognized standards for Quantitative Risk Assessment (QRA), and the robust probabilistic modeling techniques have been employed to ensure the reliability of our findings.
Table 1. Modeling scenario
|
Hole Size Frequency 100% Section (/yr) |
Hole Size Frequency 10% Section (/yr) |
Hole Size Frequency 1% Section (/yr) |
Source |
|
3.0 E-09 L/D |
2.0 E-08 L/D |
5.4 E-08 L/D |
ARAMIS |
Note: L: Length of buried pipeline, D: Pipe diameter
Figure 3. Event Tree Analysis of the selected scenario
The outcomes (consequence analysis) were evaluated through Event Tree Analysis (ETA) (Figure 3), which illustrates the possible consequences following a loss of containment, including immediate and delayed ignition events. Among the credible scenarios, jet fire and flash fire were identified as the most probable thermal effects based on substance characteristics, release pressure, and environmental conditions, which reinforce the reliability of our findings.
The study's findings have significant practical implications for understanding the physical impacts of the scenarios. By employing a combination of Phast and ArcGIS software, the study was able to simulate the thermodynamic behavior of released gas, predict flame lengths, heat flux contours, and overpressure zones. This information underpins the evaluation of potential damage to vegetation, threats to forest fire, and secondary ignition risks in contiguous areas, thereby informing future environmental management strategies.
With Algeria facing a growing threat from forest fires and ecological fragility, especially in areas like Guelma, the modeling outputs are of utmost importance. They play a key role in identifying high-criticality segments along the pipeline and shaping prevention and emergency preparedness strategies. This risk assessment framework, which takes into account both the probability of occurrence and the severity of consequences, offers a scientifically grounded basis for pipeline safety management in forest fire-prone ecosystems, making it directly applicable to your work.
3.3 Forest fire risk mapping
Following the fire behavior modeling phase, the integration of GIS technologies enabled the creation of forest fire risk maps along the pipeline route. By digitalizing the pipeline path and applying GIS buffer functions, buffer zones were generated to represent areas of forest influence and potential fire exposure.
These zones incorporated multi-layered data, including vegetation type, topography, land use, and proximity to anthropogenic activity, to assess spatial vulnerability.
The analysis, conducted on a 400-meter-wide buffer, revealed that approximately 40 hectares of forested land and 1,680 meters of the gas pipeline are located in high-risk zones.
These areas were identified as being particularly sensitive to reforestation pressures and nearby population growth, both of which can exacerbate fire ignition and propagation risks. Figure 4 shows the spatial distribution of these vulnerabilities through a composite fire risk map, clearly highlighting priority protection zones.
Figure 4. Forest fire risk map
These findings emphasize the importance of spatial intelligence for pipeline emergency preparedness. The fire risk map assists as a strategic decision-making tool; permitting stakeholders for instance pipeline operators, foresters, and emergency responders, to identify pipeline sections requiring enhanced monitoring, vegetation management, and protection measures.
Also, the study suggested that pipeline infrastructure intersecting vulnerable forest zones must be subject to proactive risk mitigation strategies, such as the establishment of firebreaks, regular maintenance access clearance, and localized fire suppression resources. The application of GIS significantly this enhanced efficiency in case for real-time situational awareness and long-term planning, ensuring that emergency measures can be prioritized where the risk is greatest.
3.4 Gas pipeline forest fire emergency management: Integrating planning and response using GIS tools
Emergency management associated to forest fires potentially triggered by loss of containment incidents along the GK3 gas pipeline begins with the identification of risk scenarios by the hazard study required by Algerian regulations. This study identifies all potential hazards that could compromise the integrity of the pipeline and mandates the development of specific contingency plans for each identified risk.
Although statistical data indicate that underground long-distance oil and gas pipelines in Algeria pose a relatively low risk of causing forest fires with no major fire events having been directly attributed to the infrastructure, except for the previously documented case, the interaction of various environmental and infrastructural factors significantly increases the risk of loss of containment. These factors include the agricultural use of surrounding land, seismic activity, landslides, and the proximity of roads and power lines, all of which may heighten the likelihood of an incident resulting in a forest fire.
Therefore, geographic information is essential for decision-making because when an incident occurs, it is required to react accurately, quickly, and effectively in a complex process that involves various actors from different sectors, such as police, municipalities, pipeline operators, owners, and fire-fighting units, health infrastructures, that they collaborate to set a good decision and build a cross-sector mechanism to help manage and control forest fires to save humans and animals' lives, plants, and assets [27].
Geoinformation systems provide powerful decision support for emergency response by utilizing two types of data to generate a decisional map [27]:
Data from various organizations includes topographic maps, forest surface, vulnerable species and animals, pipeline loss of containment factors like landslides, and third-party presence in the area;
Dynamic data collected during emergencies includes incident details such as location, nature, scale, and fire effects. This up-to-date information is based on the current situation and can be used to analyze potential consequences and take precautions. The location of emergency dynamic data is critical for tracking moving objects and determining the route to the incident site. Dynamic data generated in real time can help control emergency response activities by leveraging existing data.
This important step of our proposed method is based on two substeps, emergency planning and emergency response, discussed below.
3.4.1 Emergency planning
From an emergency planning perspective, GIS provides precise geolocation of the GK3 pipeline and its intersection with sensitive areas.
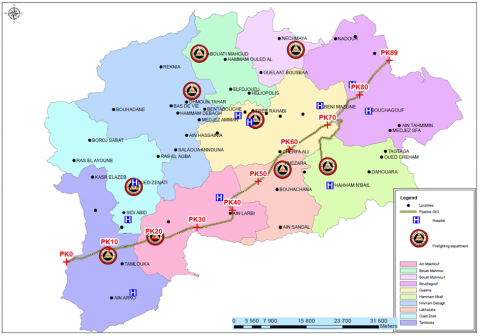
As shown in Figure 5, the spatial distribution of firefighting units and health infrastructures near the pipeline corridor has been meticulously mapped to assess the proximity of first-response resources to high-risk sections.
Figure 5. GIS for emergency planning
The GIS-based analysis significantly enriches the emergency planning framework with the following operational inputs: the pipeline, particularly those running through heavily forested and mountainous terrain (e.g., in the eastern parts of Guelma province, such as Beni Mezline or Bouchegouf), are situated farther from firefighting units and lack immediate access roads. This understanding, made possible by GIS analysis, is crucial in identifying potential delays in emergency intervention, highlighting the importance of our work.
Conversely, the urban pipeline segments, such as those in Hammam Nbail and Lakhzara, within 5 to 10 km of central firefighting units and health infrastructures, are of paramount importance. These areas, with their infrastructural readiness and central role in logistics coordination, are key nodes in our emergency planning strategy.
The GIS-based analysis significantly enriches the emergency planning framework with the following operational inputs:
Accessibility mapping: The road networks associated with each pipeline segment were analyzed to identify the optimal access routes for emergency vehicles. Alternative routes were proposed for forested areas with limited direct access.
Response time estimation: Buffer zones of 5, 10, and 20 km around each firefighting unit and health facility provide estimated average travel times under both standard and emergency conditions. This helps to classify pipeline sections by response readiness (high, moderate, or low).
Prioritized intervention sectors: GIS data will help rank sectors by their risk level and response capacity gap, enabling the targeted deployment of firefighting and healthcare personnel during the fire season.
In this context, Figure 5 illustrates a practical example of how GIS serves as a powerful decision-support tool.
It highlights both the strengths and weaknesses of the current emergency coverage along the GK3 pipeline route and supports the prepositioning of resources in advance of fire season. Importantly, it fosters the validation or revision of existing contingency plans in close cooperation with regional stakeholders (firefighting units, Forest Directorate, health infrastructure, Sonatrach pipeline operations).
3.4.2 Emergency response
In the event of an incident occurring along a segment of the GK3 pipeline, as illustrated in Figure 6, GIS analysis. The GIS network analysis function identifies the shortest and most accessible route through the existing road network, significantly increasing the likelihood of a rapid and effective response. This proximity and logistical advantage enhance the ability of firefighting teams to act promptly, control fire propagation, and contain the incident, ultimately reducing environmental and infrastructure losses.
In parallel, Figure 7 maps the surrounding health infrastructures along the pipeline route. These facilities are evaluated not only by their distance from the incident site but also by their response capacity and risk ranking.
Figure 6. GIS for emergency response–intervention
Figure 7. GIS for emergency response-evacuation
Facilities closer to the incident segment are shown to be critical in ensuring the swift evacuation and treatment of potential victims. However, the analysis reveals varying levels of preparedness among these facilities—highlighting gaps in medical response capacity that may influence the outcome in high-risk scenarios. GIS were mapping, by integrating health infrastructures data with pipeline routing and road accessibility supports decision-makers in pre-identifying the most suitable evacuation paths and optimal facilities for casualty management, thus minimizing human losses and improving emergency response efficiency.
Together, the integration of GIS-based firefighting intervention analysis (Figure 6) and evacuation to health facilities (Figure 7) provides a dynamic and data-driven approach to emergency incident management along the GK3 pipeline. It enhances situational awareness, supports pre-emptive planning, and strengthens operational readiness for both environmental and human impact mitigation.
This study marks a pivotal step forward in rethinking pipeline safety by repositioning the GK3 gas pipeline not merely as a passive infrastructure exposed to forest fire threats, but as a potential ignition source that demands proactive and spatially informed risk management. By integrating QRA and PHAST modeling with GIS, the research offers a practical and replicable framework for emergency planning that is both data-driven and responsive to real-world terrain, infrastructure, and vegetation dynamics.
The application of this integrated approach proposed by this study to the GK3 pipeline corridor in Guelma province reveals critical spatial gaps in emergency response capacity, particularly in forested and mountainous segments with limited access. GIS-based mapping of firefighting units, health infrastructures, road networks, and environmental variables enables the prioritization of intervention zones, optimization of access routes, and prepositioning of emergency resources, all of which are essential to reducing response times and minimizing fire spread in the event of an incident.
Most importantly, the study presents a transformative operational tool that enables real-time emergency planning and simulation. It moves beyond static hazard identification to dynamic scenario-based decision-making, instilling confidence in its adaptability. This proposed integrated tool not only supports multi-stakeholder coordination among pipeline operators, firefighting units, health authorities, and forestry departments but also addresses the urgent need to mitigate climate change impacts by laying the groundwork for a more resilient and climate adaptive safety model in Algeria's high-risk forested regions.
With the increasing frequency and severity of forest fires due to climate change, this proposed methodology is not just a tool for local preparedness around the GK3 pipeline; it is an essential resource that can immediately enhance local preparedness. Also, it assists as a scalable template for emergency planning across similar hydrocarbon transport corridors, both nationally and internationally, addressing the urgent need for adaptive strategies in response to climate change.
Future research should focus on advanced GIS applications and methodologies to improve risk assessment and address emerging challenges in environmental management. These advances could have a significant impact on sustainable development and resilience to natural and anthropogenic hazards. The most significant advancement identified as a potential focus of this study is dynamic segmentation based on multi-criteria methods, which enables the generation of dynamic fire maps in real time.
Furthermore, it is necessary to strengthen emergency management by integrating monitoring and early detection systems. For instance, satellite monitoring using NASA's VIIRS and MODIS systems enables real-time detection of fires. Similarly, the integration of IoT sensors and AI-based detection, such as smart cameras and infrared sensors, can help identify ignition points and significantly improve rapid response capabilities, providing a sense of reassurance and confidence.
The authors gratefully acknowledge the pivotal role played by the collaborating research laboratories, whose support was instrumental in the successful execution of this study. Furthermore, the authors express their sincere appreciation to the anonymous reviewers for their insightful feedback and constructive suggestions, which significantly enhanced the quality and rigor of this research.
[1] Yildirim, V., Yomralioglu, T., Nisanci, R., Colak, E.H., Bediroglu, S., Memisoglu, T. (2016). An integrated spatial method for minimizing environmental damage of transmission pipelines. Polish Journal of Environmental Studies, 25(6): 2653-2563. https://doi.org/10.15244/pjoes/63655
[2] Filkov, A.I., Tihay-Felicelli, V., Masoudvaziri, N., Rush, D., et al. (2023). A review of thermal exposure and fire spread mechanisms in large outdoor fires and the built environment. Fire Safety Journal, 140: 103871. https://doi.org/10.1016/j.firesaf.2023.103871
[3] Robinne, F.N., Secretariat, F. (2021). Impacts of disasters on forests, in particular forest fires. UNFFS Background Paper. https://www.un.org/esa/forests/wp-content/uploads/2021/08/UNFF16-Bkgd-paper-disasters-forest-fires_052021.pdf.
[4] Planas, E., Paugam, R., Àgueda, A., Vacca, P., Pastor, E. (2023). Fires at the wildland-industrial interface. Is there an emerging problem? Fire Safety Journal, 141: 103906. https://doi.org/10.1016/j.firesaf.2023.103906
[5] Speck, O., Speck, T. (2024). Is a forest fire a natural disaster? Investigating the fire tolerance of various tree species—An educational module. Biomimetics, 9(2): 114. https://doi.org/10.3390/biomimetics9020114
[6] Publications Office of the EU. (2024). Lessons learned from oil pipeline natech accidents and recommendations for natech scenario development: Final report. https://op.europa.eu/en/publication-detail/-/publication/bae22600-64dd-4e0c-9c01-26ce0b76934b/language-en.
[7] Martin, D., Tomida, M., Meacham, B. (2016). Environmental impact of fire. Fire Science Reviews, 5(1): 5. https://doi.org/10.1186/s40038-016-0014-1
[8] Wybo, J.L., Guarnieri, F., Richard, B. (1995). Forest fire danger assessment methods and decision support. Safety Science, 20(1): 61-70. https://doi.org/10.1016/0925-7535(94)00067-D
[9] Kalabokidis, K., Ager, A., Finney, M., Athanasis, N., Palaiologou, P., Vasilakos, C. (2016). AEGIS: A wildfire prevention and management information system. Natural Hazards and Earth System Sciences, 16(3): 643-661. https://doi.org/10.5194/nhess-16-643-2016
[10] Demir, A., Akay, A.E. (2024). Forest fire risk mapping using gis based analytical hierarchy process approach. European Journal of Forest Engineering, 10(1): 15-28. https://doi.org/10.33904/ejfe.1400233
[11] Rota, R., Caragliano, S., Scaioni, M., Ravasi, F. (2008). EPM: A GIS-based tool for emergency preparedness and management of industrial-related accidents. Chemical Engineering Transactions, 13: 437-444.
[12] Goodchild, M.F. (2006). GIS and disasters: Planning for catastrophe. Computers, Environment and Urban Systems, 30(3): 227-229. https://doi.org/10.1016/j.compenvurbsys.2005.10.004
[13] Abedi Gheshlaghi, H. (2019). Using GIS to develop a model for forest fire risk mapping. Journal of the Indian Society of Remote Sensing, 47(7): 1173-1185. https://doi.org/10.1007/s12524-019-00981-z
[14] Abedi Gheshlaghi, H., Feizizadeh, B., Blaschke, T. (2020). GIS-based forest fire risk mapping using the analytical network process and fuzzy logic. Journal of Environmental Planning and Management, 63(3): 481-499. https://doi.org/10.1080/09640568.2019.1594726
[15] Parajuli, A., Gautam, A.P., Sharma, S.P., Bhujel, K.B., et al. (2020). Forest fire risk mapping using GIS and remote sensing in two major landscapes of Nepal. Geomatics, Natural Hazards and Risk, 11(1): 2569-2586. https://doi.org/10.1080/19475705.2020.1853251
[16] Nuthammachot, N., Stratoulias, D. (2021). Multi-criteria decision analysis for forest fire risk assessment by coupling AHP and GIS: Method and case study. Environment, Development and Sustainability, 23(12): 17443-17458. https://doi.org/10.1007/s10668-021-01394-0
[17] Vergara, A.J., Valqui-Reina, V.S., Cieza-Tarrillo, D., Munoz-Astecker, L.D., Ocaña, C.L., Cubas, J., Auquiñivin-Silva, E.A. (2024). Integration of the AHP method and GIS techniques for mapping areas susceptible to forest fires in the Southern Amazon Region (Peru). International Journal of Design & Nature and Ecodynamics, 19(3): 769-778. https://doi.org/10.18280/ijdne.190307
[18] Akay, A.E., Erdoğan, A. (2017). GIS-based multi-criteria decision analysis for forest fire risk mapping. ISPRS Annals of the Photogrammetry, Remote Sensing and Spatial Information Sciences, 4: 25-30. https://doi.org/10.5194/isprs-annals-IV-4-W4-25-2017
[19] Sakellariou, S., Sfougaris, A., Christopoulou, O. (2021). Review of geoinformatics-based forest fire management tools for integrated fire analysis. Polish Journal of Environmental Studies, 30: 5423-5434. https://doi.org/10.15244/pjoes/135614
[20] Keane, R.E., Drury, S.A., Karau, E.C., Hessburg, P.F., Reynolds, K.M. (2010). A method for mapping fire hazard and risk across multiple scales and its application in fire management. Ecological Modelling, 221(1): 2-18. https://doi.org/10.1016/j.ecolmodel.2008.10.022
[21] Wang, W. (2019). Site selection of fire stations in cities based on geographic information system and fuzzy analytic hierarchy process. Ingénierie des Systèmes d'Information, 24(6): 619-626. https://doi.org/10.18280/isi.240609
[22] Naskar, S., Rahaman, A., Biswas, B. (2024). Forest fire susceptibility mapping of West Sikkim District, India using MCDA techniques. Environment, Development and Sustainability. https://doi.org/10.1007/s10668-024-05158-4
[23] Pragya, Kumar, M., Tiwari, A., Majid, S.I., Bhadwal, S., et al. (2023). Integrated spatial analysis of forest fire susceptibility in the Indian Western Himalayas (IWH) using remote sensing and GIS-based fuzzy AHP approach. Remote Sensing, 15(19): 4701. https://doi.org/10.3390/rs15194701
[24] Muhlbauer, W.K. (1996). Pipeline risk management manual (Vol. 35). Houston, TX: Gulf Publishing Company. https://doi.org/10.1016/B978-0-7506-7579-6.X5000-6
[25] Hadef, H., Djebabra, M. (2019). Proposal method for the classification of industrial accident scenarios based on the improved principal components analysis (improved PCA). Production Engineering, 13: 53-60. https://doi.org/10.1007/s11740-018-0859-3
[26] Hefaidh, H., Mébarek, D. (2020). Using fuzzy-improved principal component analysis (PCA-IF) for ranking of major accident scenarios. Arabian Journal for Science and Engineering, 45: 2235-2245. https://doi.org/10.1007/s13369-019-04233-7
[27] Aydinoglu, A.C., Yomralioglu, T., Quak, W., Dilo, A. (2009). Modeling emergency management data by UML as an extension of geographic data sharing model: ASAT approach. In Proceedings of the International Emergency Management Society (TIEMS) 16th Annual Conference, Istanbul, Turkey, pp. 87-98.
[28] Särdqvist, S. (1996). An engineering approach to firefighting tactics. Licentiate thesis, Division of Fire Safety Engineering.
[29] Shakibaei, H., Moosavi, S.A., Aghsami, A., Rabbani, M. (2024). Designing a sustainable-resilient humanitarian supply chain for post-disaster relief process, an earthquake case study in Haiti. Journal of Humanitarian Logistics and Supply Chain Management, 14(4): 349-368. https://doi.org/10.1108/JHLSCM-08-2023-0071