Laberiano Andrade-Arenas![]() | Cesar Yactayo-Arias*
| Cesar Yactayo-Arias*![]()
© 2025 The authors. This article is published by IIETA and is licensed under the CC BY 4.0 license (http://creativecommons.org/licenses/by/4.0/).
OPEN ACCESS
Credit card fraud poses significant financial and security challenges, with negative consequences for consumers and financial institutions. An efficient, accurate detection system is essential. This study aims to determine which machine learning (ML)method performs best for detecting fraudulent credit card transactions by evaluating models such as Naive Bayes, Logistic Regression, k-NN, Decision Trees, as well as Random Forests, XGBoost, and AdaBoost. The models were evaluated using an open-access dataset from Kaggle, which includes actual payment activities conducted with credit cards by European cardholders in 2013. Due to data imbalance, the Synthetic Minority Over-sampling Technique (SMOTE) was applied to enhance performance. Results indicate that Random Forest and XGBoost outperformed other models in terms of accuracy, F1 score, and the areas under the ROC (AUC) and precision-recall (AUPRC) curves. Specifically, Random Forest achieved an accuracy of 0.999, F1 score of 0.872, AUC of 0.978, and AUPRC of 0.871, while XGBoost reached an accuracy of 0.999, F1 score of 0.837, AUC of 0.983, and AUPRC of 0.867. In conclusion, Random Forest and XGBoost demonstrated superior performance, offering promising tools for effective credit card fraud detection. However, the use of 2013 data may limit the generalizability of results to more recent fraud patterns.
class imbalance, credit card fraud, financial institution, machine learning, random forest, SMOTE, XGBoost
The exponential growth of e-commerce and the digitization of financial transactions have revolutionized the way people interact with markets and services, bringing unprecedented convenience to everyday life [1]. However, this increased ease, and accessibility has also led to an increase in fraudulent transactions [2], due both to how these systems are used and the tendency of cybercriminals to obtain sensitive information [3]. This type of fraud, recognized as a sophisticated form of financial misconduct, entails the illegal exploitation of credit card information to carry out illicit transactions. Credit card fraud can occur in a variety of ways. It typically happens when someone unlawfully takes a physical card or gains access to its details and uses them without the owner's consent [4]. The methods used to commit fraud are varied and increasingly sophisticated. The most common methods include hacking billing systems, infiltrating online merchants, taking cards without permission, and placing malicious hardware in payment terminals [5].
In addition, criminals use fake identities and various advanced technologies to trick users into giving up their credit card information [6]. One of the most common and effective tactics is phishing, a technique that uses fraudulent emails, SMS messages, or websites designed to deceive cardholders into revealing their personal information [7]. These methods not only put people's financial assets at risk but also pose a significant threat to the security and trust of digital payment systems. As a result, credit card fraud is a multifaceted problem that affects banks and other organizations that offer credit cards [8], as well as consumers and merchants. The complexity of the problem lies in the variety of methods used by criminals, ranging from the physical theft of cards to the creation of counterfeit cards and the online theft of personal information. In addition, the lack of effective security in payment systems and the increasing sophistication of fraudsters make it increasingly difficult to effectively detect and prevent fraud. Consequently, detecting fraudulent credit card transactions represents one of the main challenges faced by financial institutions [9].
This study tackles the problem of fraudulent credit card activity through the use of ML approaches, aiming to determine which model offers the highest accuracy and efficiency in detecting fraud. Seven algorithms were chosen due to their varied theoretical backgrounds, frequent appearance in fraud detection research, and their capability to manage unbalanced datasets. Naive Bayes (NB) represents a probabilistic baseline model that is simple and computationally efficient. Logistic Regression (LR) provides a strong linear classifier often used as a benchmark. k-Nearest Neighbors (KNN) is included for its instance-based learning approach. Decision Trees (DT) offer interpretability and non-linear decision boundaries. Ensemble methods (Random Forest (RF), XGBoost, and AdaBoost) were selected due to their superior performance in complex classification tasks, especially in fraud detection scenarios. By evaluating models from different paradigms (probabilistic, linear, instance-based, tree-based, and ensemble), this comprehensive approach allows for a fair and insightful comparison to determine the most effective model for early and accurate fraud detection.
This study aims to compare several ML algorithms designed to identify fraudulent credit card transactions. It also addresses the frequent issue of class imbalance present in fraud datasets by applying the SMOTE technique. The goal is to identify which models yield the best results according to evaluation metrics such as accuracy, F1 score, and the area under both the ROC and the precision-recall curves.
Numerous previous studies have addressed this problem by applying different ML techniques and exploring a variety of approaches and algorithms to improve the precision and efficiency of detecting fraudulent activity. This section examines in detail the methods used, and the results obtained in previous research, with the aim of identifying potential gaps and areas that have not been sufficiently explored.
Azim Mim et al. [10] proposed an approach that integrates several models using soft voting, aiming to identify fraudulent credit card activity in datasets with unequal class representation. They evaluated this technique alongside various advanced sampling strategies, including oversampling, undersampling, and hybrid methods, aimed at mitigating class imbalance. Throughout their research, they developed several fraud detection models, some utilizing ensemble methods while others did not. The results demonstrated that the soft voting ensemble consistently outperformed the standalone models, reaching an accuracy of 98.70%, a sensitivity rate of 96.94%, an F1 score near 87.64%, and an area under the ROC curve of 99.36%.
Arjun et al. [11] applied algorithms such as the Isolation Forest (IF) and Local Outlier Factor (LOF) and were able to accurately detect fraudulent transactions. These models were trained and evaluated on a dataset containing 4,092 records of credit card information from European customers. In this dataset, 80% of the transactions are fraudulent, while the rest are legitimate. When compared to other existing models, they achieved an impressive predictive accuracy of 99%. Sinap [12], after evaluating seven supervised classification algorithms, achieved 97% accuracy in detecting credit card fraud using Random Forests and Nearest Neighbors models. The data preparation techniques used, such as scaling and random sampling, were key to addressing the disproportionate distribution of fraudulent versus legitimate transactions.
Mohammed and Maram [13] applied a classification technique based on logistic regression to identify fraudulent credit card activities. Their approach also included a preprocessing step aimed at correcting data errors and improving detection reliability. They assessed the classifier’s performance by analyzing a classification matrix and important evaluation measures such as precision, recall, and accuracy. Achieving an accuracy of 97.2%, their findings indicate that the developed model is very effective, demonstrating strong ability to correctly recognize fraudulent transactions
Alenzi and Aljehane [14] presented a fraud detection system using artificial intelligence, specifically using LR to build a classifier that detects fraud in credit card transactions. In order to ensure high detection accuracy and to handle incorrect data, they incorporated a preprocessing step with two innovative methods: one based on the mean and the other based on clustering. They assessed how well the classifier performed by measuring its accuracy, recall (sensitivity), and error rate. The findings indicate an impressive accuracy of 97.2%, sensitivity of 97%, and an error rate as low as 2.8%.
Pumsirirat and Yan [15] addressed fraud detection in online transactions, recognizing the dynamic and adaptive nature of fraudulent behavior. In their study, they propose an approach based on autoencoders (AE) and restricted Boltzmann machines (RBM) to identify anomalies in normal transaction patterns. This approach is based on unsupervised learning, where the model is trained to reconstruct normal transactions and detect significant deviations that may indicate fraud. Using Google's Tensorflow library and H2O for deep learning, the authors evaluated the results using a variety of metrics, including the root mean square error and area under the curve, to measure the efficiency and accuracy of the model.
The current state of knowledge in credit card fraud detection shows a growing interest in the development and implementation of ML techniques. Earlier research in credit card fraud detection has utilized a narrow selection of models along with common evaluation metrics such as accuracy, recall, F1 score, and ROC-AUC, frequently incorporating ensemble voting approaches and simple data resampling methods. This study differs by evaluating seven diverse machine learning models, applying SMOTE to address class imbalance, and using a broader set of metrics including bootstrap confidence intervals and AUPRC. This comprehensive and statistically robust approach enhances understanding of model performance and stability, advancing the field with practical benchmarking insights.
3.1 Model evaluation process
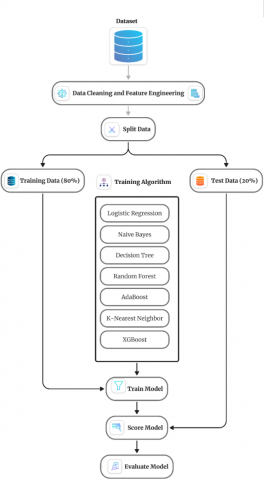
Figure 1 illustrates the model evaluation process in detail, from the initial loading of the dataset to the final stage of model performance evaluation. This process involves several critical phases. First, the data is loaded and examined, then it goes through a preprocessing phase that involves cleaning the dataset, addressing any missing values, and normalizing the variables when needed. The data is then divided into two separate subsets: one used to train the model and another to evaluate its performance. In this phase, model selection and training are performed using the SMOTE oversampling technique to address class imbalance.
Figure 1. Diagram illustrating the evaluation process of the selected models
After training, the models are assessed using multiple evaluation metrics to thoroughly understand how well they perform. This workflow ensures a thorough and rigorous evaluation of each model. In addition, this visual representation provides a comprehensive and structured view of the workflow used to evaluate ML models for credit card fraud detection, highlighting each key step in the process and its contribution to the ultimate goal of identifying the efficient model.
3.2 Oversampling selection
SMOTE was selected over other oversampling methods, such as Adaptive Synthetic Sampling (ADASYN), due to its ability to generate synthetic samples in a more controlled and uniform manner. Unlike ADASYN, which may introduce noise by focusing on harder-to-learn instances, SMOTE helps maintain a balanced class distribution without distorting the decision boundary. Its proven reliability in fraud detection tasks makes it a suitable choice for this study.
3.3 Dataset and preprocessing
3.3.1 Data description
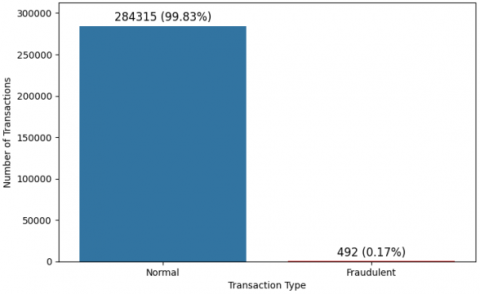
For the purposes of this study, the dataset was acquired from Kaggle, a well-known repository for machine learning datasets. It provides comprehensive records of credit card transactions conducted by European cardholders during a specific period in September 2013. The dataset includes transactions from just two days, totaling 284,807 entries, with only 492 flagged as fraudulent [16]. This highlights a significant class imbalance, as fraudulent cases represent just 0.17% of the data. Despite this, the dataset provides a solid foundation for analyzing and developing effective credit card fraud detection models (see Figure 2).
Figure 2. Number of fraudulent and normal transactions
Figure 3 shows the correlation between the transaction amount and the time at which the transaction took place. Each point represents an individual transaction, some of which are fraudulent and some of which are legitimate, as indicated by the class variable in the dataset. As can be seen, fraudulent transactions tend to cluster in certain ranges of amounts and times, which may indicate suspicious activity. On the other hand, non-fraudulent transactions are more spread out over time and over a wide range of amounts, reflecting the varied and frequent nature of legitimate transactions compared to fraudulent ones.
Figure 3. Transaction scatter plot
3.3.2 Features
The dataset contains 31 columns, including the variables Time, V1 to V28, Amount, and Class. The input variables are numerical and have been modified through the application of Principal Component Analysis (PCA) to ensure the original data remains confidential. Features V1 to V28 represent the principal components resulting from PCA, while time and amount are the only variables that remained in their original form without being altered by the PCA process. Furthermore, as shown in Table 1, there is no missing data in any of the variables. In addition, a detailed description of what each variable represents is provided.
Table 1. Data characteristics
|
Variable |
Type |
Missing Values |
Description |
|
Time |
Float |
0 |
The time feature reflects how much time, measured in seconds, has passed between a particular transaction and the first one recorded in the dataset. |
|
V1 to V28 |
Float |
0 |
The features obtained after dimensionality reduction, implemented for confidentiality reasons. |
|
Amount |
Float |
0 |
This feature reflects the monetary value associated with each individual transaction. |
|
Class |
Int |
0 |
Response variable (1 for fraud and 0 for legitimate transactions). |
3.3.3 Data for training and testing
The dataset was divided into two separate subsets, one used to train the model and the other reserved for evaluating its performance. The dataset was divided so that 80% of the data was served for training purposes, while the other 20% was reserved for testing to assess how well the model performs. This splitting strategy ensures that the model can learn effectively during the training phase, and then its predictive ability can be verified using independent data during the testing phase.
3.3.4 Synthetic minority over-sampling technique
Since fraudulent transactions make up only 0.17% of the data, whereas non-fraudulent one’s account for 99.83%, the dataset presents a highly unbalanced distribution between the two classes. This unevenness may lead the model to become biased, often predicting that most transactions are legitimate. To address this issue, the SMOTE technique was used to equalize the class proportions within the dataset. This approach involves producing artificial data points for the underrepresented class (Specifically, the focus is on transactions identified as fraudulent) by interpolating the attributes of existing samples to enhance class balance. By balancing the amount of data between classes, SMOTE helps prevent the model from showing a bias towards a specific class and improves its ability to more accurately identify fraud.
3.4 Machine learning model
A total of seven supervised machine learning models were applied to thoroughly assess the effectiveness of detecting fraudulent credit card activity.
3.4.1 Naive bayes
NB is a probabilistic classification method that relies on statistical theory to determine the most likely class of an object based on its features, under the assumption that they do not influence one another, which is seldom the case in real-world scenarios, hence the term "naïve." It estimates the likelihood of an outcome occurring by taking into account a prior event that has already taken place [17].
3.4.2 Logistic regression
LR is a classification model mainly used for data sets with binary classifications [18], i.e., when the possible outputs are two different categories. Furthermore, the simplicity and effectiveness of logistic regression make it a valuable tool for binary classification problems.
3.4.3 K-nearest neighbors
KNN is a nonparametric classification method used for both classification and regression problems [19]. It functions by locating the k closest data samples relative to a specific input instance and determining the outcome based on the predominant class among those neighbors for classification or the mean of their values for regression.
3.4.4 Decision tree
The DT algorithm is a technique that organizes data in a hierarchical tree structure [20]. It starts from a root node and branches into different paths depending on the characteristics of the dataset [21]. Each node symbolizes a characteristic or trait, while each branch signifies a decision made based on that specific attribute. These decisions lead to classification or prediction results in the leaves of the tree. Interpreting a decision tree is intuitive and allows us to understand how decisions are made based on the characteristics of the data.
3.4.5 Random forest
RF is a powerful ML technique primarily used for classification, although it can also be applied to regression. This approach constructs multiple decision trees using various randomly selected subsets of the training dataset and aggregates their outputs to enhance the model's precision and stability. It is capable of processing both linear and nonlinear data effectively. RF is particularly effective on unbalanced data sets, where classes are not equally represented [22]. By integrating the results of multiple trees, this algorithm reduces overfitting and provides more accurate and reliable predictions.
3.4.6 XGBoost
The XGBoost algorithm is an advanced ML technique based on the boosting method. In simple terms, boosting is the process of combining several weak models to create a strong model. XGBoost specializes in the sequential generation of decision trees. Each new tree is built to correct the errors made by the previous tree. This is done by updating the residual error, which is the error that remains after the previous tree has made its predictions. Thus, each successive tree focuses on improving the predictions by correcting the accumulated residual errors [22]. This iterative and sequential approach allows XGBoost to achieve high accuracy and robust performance in classification and regression tasks.
3.4.7 AdaBoost
The AdaBoost algorithm is a technique designed to improve the accuracy of classification models by combining several weak classifiers into one stronger classifier. Typically, AdaBoost uses decision trees as its base classifiers. The process starts by fitting a weak classifier to the training data. It then chooses the classifier that has the smallest weighted classification error and adjusts the importance of each data point by assigning higher weights to those that were incorrectly predicted. This adjustment is made using a normalization factor to ensure that the sum of all weights is equal to 1. The algorithm repeats this process iteratively, attempting to reduce the classification error at each step until the training data is correctly classified or no further improvement is possible [23]. Through this weighted combination of weak classifiers, AdaBoost builds a strong and efficient model for the classification task.
3.5 Model evaluation
Several performance metrics were used to evaluate the models, providing a complete and detailed view of their performance.
3.5.1 Accuracy
Accuracy is an indicator that measures how well a model makes its predictions. It is a way to evaluate the overall effectiveness of the model in correctly identifying the positive and negative classes in a data set. It is derived by computing the proportion of instances that the model accurately predicts out of the total observations present in the dataset, serving as an indicator of overall model performance [24]. It can be calculated using Eq. (1).
Accuracy $=\frac{T P+T N}{T P+F N+T N+F P}$ (1)
where, TP stands for the count of positive cases that the model successfully recognized. Conversely, FP indicates the number of negative cases that the model wrongly marked as positive. Likewise, FN represents positive cases that were inaccurately identified as negative, and TN corresponds to the quantity of negative cases that the model correctly classified [25].
3.5.2 Recall
Recall is a measure of how well a classifier can correctly identify instances of the positive class. In other words, it evaluates how often the classifier correctly predicts a positive label when the data is actually positive [25]. It can be calculated using Eq. (2).
Recall $=\frac{T P}{T P+F N}$ (2)
3.5.3 F1 score
The F1 score is an indicator of the precision of a model, calculated as the harmonic mean between accuracy and sensitivity. Its value can be as high as 1, indicating ideal accuracy and sensitivity, or as low as 0. In other words, the F1 score evaluates both the precision and the robustness of a model [26]. It can be calculated using Eq. (3).
$F 1$ Score $=\frac{2 *( { precision } *\,{ recall })}{( { precision }+ \, { recall })}$ (3)
3.5.4 Receiver Operating Characteristic
The Receiver Operating Characteristic (ROC) curve is a visual tool that assesses how well a classification model performs by examining different threshold values. It shows the trade-off between the true positive rate, indicating how many actual positive instances were correctly detected, and the false positive rate, which denotes the percentage of negative instances that were mistakenly labeled as positive. Lowering the classification threshold increases the sensitivity of the model, resulting in a higher proportion of cases being classified as positive, including both true positives and false positives [27].
3.5.5 Area under the curve
The area under the curve (AUC) is a key metric derived from the ROC curve that helps assess how well a classification model can differentiate between classes. When the AUC value is high, it means the model performs well in separating positive instances from negative ones with greater accuracy. Its value ranges between 0 and 1, where 0 indicates a model that classifies everything incorrectly and 1 indicates a perfect model that classifies everything correctly [28]. As the AUC value approaches 1, the model demonstrates a stronger capability to accurately distinguish between different classes.
3.5.6 Area under the precision recovery curve
The area under the precision-recall curve (AUPRC) is a key measure used to evaluate how well classification models perform, especially when dealing with datasets where classes are unevenly distributed. This metric reflects how precision and recall trade off against each other as the decision threshold changes. With values ranging from 0 to 1, the AUPRC quantifies the space beneath the curve that plots precision versus recall. A higher AUPRC score signifies a more effective model, capable of accurately distinguishing between positive and negative cases. This measure is vital for fine-tuning models to achieve the best possible balance between precision and recall, ultimately enhancing overall classification accuracy [12].
3.5.7 Confidence interval estimation
To assess the stability of the performance metrics, 95% confidence intervals were calculated using bootstrap resampling. For each model, 1,000 resamples of the test set predictions were generated with replacement, and confidence intervals were derived from empirical distributions. This approach ensures a reliable estimate of model performance variability.
Table 2 presents a comparison of traditional performance metrics along with 95% confidence intervals, obtained through bootstrap resampling, for several classification models applied to credit card fraud detection. RF and XGBoost stand out with the highest accuracy of 0.999 and F1 scores of 0.872 and 0.837, respectively, indicating an excellent balance between precision and recall, making them the best choice for this task. KNN also shows a high accuracy (0.998) and an F1 score of 0.618, suggesting that it is quite effective, although not as much as RF and XGBoost. On the other hand, while NB and LR have relatively high accuracy (0.976 and 0.974, respectively) and good recall (0.867 and 0.918), they have low F1 scores (0.112 and 0.110). This suggests that despite their ability to correctly identify fraudulent transactions (high recall), they struggle with precision (false positives), which reduces their F1 score. The DT shows a high accuracy of 0.997 but a lower recall of 0.795 and an intermediate F1 score of 0.536, indicating that although it is quite accurate, it is not as good at identifying all fraudulent transactions compared to other models. AdaBoost has a good recall (0.938), the best of all the models, but its F1 score (0.116) is low, similar to NB and LR, indicating an imbalance between precision and recall.
Table 2. Metrics with confidence intervals (Bootstrap)
|
Model |
Accuracy |
Recall |
F1 Score |
|
NB |
0.976 [0.973, 0.976] |
0.867 [0.814, 0.930] |
0.112 [0.091, 0.125] |
|
LR |
0.974 [0.973, 0.976] |
0.918 [0.871, 0.961] |
0.110 [0.095, 0.133] |
|
KNN |
0.998 [0.997, 0.998] |
0.867 [0.817, 0.927] |
0.618 [0.525, 0.647] |
|
DT |
0.997 [0.997, 0.998] |
0.795 [0.693, 0.854] |
0.536 [0.454, 0.595] |
|
RF |
0.999 [0.999, 0.999] |
0.836 [0.745, 0.888] |
0.872 [0.788, 0.892] |
|
XGBoost |
0.999 [0.999, 0.999] |
0.867 [0.782, 0.914] |
0.837 [0.705, 0.823] |
|
AdaBoost |
0.975 [0.962, 0.965] |
0.938 [0.849, 0.957] |
0.116 [0.068, 0.095] |
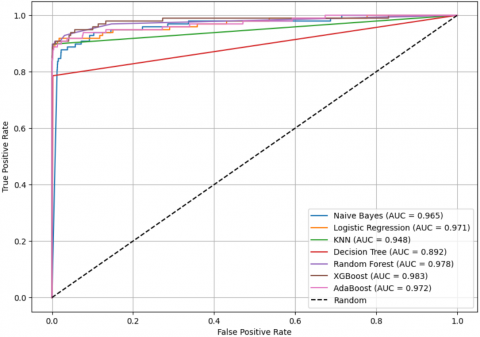
Figure 4 shows the evaluation of different classification algorithms for credit card fraud detection using the AUC-ROC curve. Among the models evaluated, XGBoost and Random Forest attained the top AUC scores of 0.983 and 0.978 respectively, showcasing their strong ability to differentiate fraudulent transactions from legitimate ones. LR also shows strong performance with an AUC of 0.971, offering a reliable and interpretable method. NB achieves a solid AUC of 0.965, indicating reasonable discriminative power. KNN and DT show moderate results with AUC values of 0.948 and 0.920, respectively, while AdaBoost records a slightly lower AUC of 0.927 among the ensemble methods. Overall, the results reaffirm that RF and XGBoost are the most effective classifiers for this task, while LR and NB offer solid, interpretable alternatives, and KNN and DT present acceptable but comparatively lower discriminative capabilities.
Figure 4. AUC-ROC analysis
Figure 5 shows the evaluation of different classification algorithms for credit card fraud detection using the AUPRC. Among the evaluated models, RF (0.871) and XGBoost (0.867) offer the highest AUPRC values, indicating a strong ability to maintain high precision across different recall levels, a key requirement for detecting rare fraud cases. AdaBoost also demonstrates solid performance with an AUPRC of 0.808, making it a competitive ensemble method. LR achieves an AUPRC of 0.724, suggesting a good balance between identifying frauds and limiting false positives, while KNN yields a moderate AUPRC of 0.585. In contrast, DT and NB show lower discriminative performance, with AUPRC scores of 0.311 and 0.087 respectively, indicating limited effectiveness in maintaining precision as recall increases. These results highlight the superiority of ensemble models like Random Forest and XGBoost for precision-recall performance in fraud detection tasks.
Figure 5. AUPRC analysis
This study evaluated the effectiveness of multiple supervised machine learning algorithms in detecting fraudulent credit card transactions. While previous research has investigated the application of machine learning techniques for recognizing fraudulent credit card transactions, it has generally concentrated on assessing individual models or a limited set of them, without offering a broad comparison using consistent evaluation criteria across multiple algorithms. The lack of head-to-head comparisons makes it difficult to determine the most effective model for this specific task.
The study findings revealed that, out of all the models tested, Random Forest and XGBoost demonstrated notably superior performance. The RF model achieved a remarkably high accuracy of 0.999, an F1 score of 0.872, an AUC of 0.978 and an AUPRC of 0.871, while XGBoost also showed outstanding performance with an accuracy of 0.999, an F1 score of 0.837, an AUC of 0.983 and an AUPRC of 0.867. These AUPRC values, reflecting a strong harmony between precision and recall, highlight how effective both models are at identifying fraudulent credit card activity. The outcomes indicate that Random Forest and XGBoost are top contenders for this application, thanks to their strength in reducing incorrect classifications of both fraudulent and legitimate transactions.
When comparing the outcomes of this research with those reported in earlier works that utilized comparable datasets for identifying fraudulent credit card activity, the Random Forest and XGBoost models emerge as particularly strong performers. They excel in key metrics such as accuracy (99.9%), F1 score (0.872 and 0.837, respectively), and AUPRC (0.871 and 0.867, respectively). These models significantly outperform the models evaluated by Arora et al. [29] and Vengatesan et al. [30], who reported lower accuracies and F1 scores for KNN and NB. Compared to the ensemble-based soft-voting approach of Azim Mim et al. [10], which achieved an accuracy of 0.9996 and an F1 score of 0.8764, the models evaluated in the present study, such as RF and XGBoost, show a competitive performance, although slightly inferior in AUPRC. Furthermore, the results of RF and XGBoost also outperform those of the ANN evaluated by Asha and Suresh Kumar [31] and the LR and Voting Classifier models of Alenzi and Aljehane [14].
These findings underscore the effectiveness of combining oversampling techniques like SMOTE with robust evaluation metrics such as AUC-ROC and AUPRC. They confirm the strong performance of RF and XGBoost in handling class imbalance and detecting fraudulent transactions. However, despite their high predictive performance, both models have limitations. One notable drawback of RF and XGBoost is their computational complexity, especially during training with large datasets or extensive hyperparameter tuning. These models can require significant processing time and memory resources, which may hinder real-time deployment in high-frequency transaction systems. Furthermore, they are often regarded as "black-box" models, making them less interpretable than simpler algorithms like LR or DT. This reduced interpretability can pose challenges in financial environments where regulatory compliance and explain ability of automated decisions are critical.
Another limitation of this study lies in the age of the dataset used, which dates back to 2013. Given the evolving nature of fraudulent behavior and transaction patterns, it is likely that newer fraud strategies have emerged in the past decade. Therefore, future work should aim to validate model performance using more recent datasets to ensure the continued relevance and applicability of the findings.
This study tackled the issue of fraudulent credit card activity by utilizing machine learning methods to determine which model delivers the highest accuracy and performance in detecting such transactions. Several models, including NB, LR, KNN, DT, RF, XGBoost, and AdaBoost, were investigated and evaluated using an unbalanced data set. The results showed that the RF and XGBoost models outperformed the other models in terms of accuracy, F1 score, and AUC-ROC and AUPRC. For real-world applications, it is recommended to implement these models within scalable systems capable of handling large volumes of transaction data. Due to their complexity, integration with interpretability tools is advised to support transparency and trust, particularly in regulated environments. While the dataset used offers valuable insights, its temporal and size limitations suggest the need for validation on more recent and extensive data. Future research should explore adaptive oversampling techniques and focus on optimizing models for speed and interpretability to ensure effective deployment in production environments.
Thanks to those who contributed with their suggestions and recommendations for the completion of the research.
[1] Alshutayri, A. (2023). Fraud prediction in movie theater credit card transactions using machine learning. Engineering, Technology & Applied Science Research, 13(3): 10941-10945. https://doi.org/10.48084/etasr.5950
[2] Alshawi, B. (2023). Utilizing GANs for credit card fraud detection: A comparison of supervised learning algorithms. Engineering, Technology & Applied Science Research, 13(6): 12264-12270. https://doi.org/10.48084/etasr.6434
[3] Alraddadi, A.S. (2023). A survey and a credit card fraud detection and prevention model using the decision tree algorithm. Engineering, Technology & Applied Science Research, 13(4): 11505-11510. https://doi.org/10.48084/etasr.6128
[4] Radha, S., Somnath, B., Vishal, H., Susham, W., Shubham, B. (2022). Credit card fraud detection. International Journal of Advanced Research in Science, Communication and Technology, 2(2): 178-181. https://doi.org/10.48175/IJARSCT-7776
[5] Jadav, S., Patil, M. (2023). A succinct analysis of deep LSTM model-based credit card fraud detection. International Journal of Research in Applied Science and Engineering Technology, 11(7): 1827-1830. https://doi.org/10.22214/ijraset.2023.54891
[6] Gupta, A., Singh, K., Sharma, N., Rakhra, M. (2022). Machine learning for detecting credit card fraud. In 2022 IEEE North Karnataka Subsection Flagship International Conference (NKCon), Vijaypur, India, pp. 1-6. https://doi.org/10.1109/NKCon56289.2022.10126861
[7] Sharma, S., Kataria, A., Sandhu, J.K., Ramkumar, K.R. (2022). Credit card fraud detection using machine and deep learning techniques. In 2022 3rd International Conference for Emerging Technology (INCET), pp. 1-7. https://doi.org/10.1109/INCET54531.2022.9824065
[8] Salian, S.R. (2023). Credit card fraudulent transaction detection and prevention. International Journal of Research in Applied Science and Engineering Technology, 11(4): 3255-3260. https://doi.org/10.22214/ijraset.2023.50849
[9] Jemai, J., Zarrad, A., Daud, A. (2024). Identifying fraudulent credit card transactions using ensemble learning. IEEE Access, 12: 54893-54900. https://doi.org/10.1109/ACCESS.2024.3380823
[10] Azim Mim, M., Majadi, N., Mazumder, P. (2024). A soft voting ensemble learning approach for credit card fraud detection. Heliyon, 10(3): e25466. https://doi.org/10.1016/j.heliyon.2024.e25466
[11] Arjun, K.P., Atlas, G., Sreenarayanan, N.M., Janarthanan, S., Arvindhan, M. (2022). Early prediction of credit card transaction using local outlier factor and isolation forest tree machine learning algorithms. In: Deepak, B.B.V.L., Parhi, D., Biswal, B., Jena, P.C. (eds) Applications of Computational Methods in Manufacturing and Product Design. Lecture Notes in Mechanical Engineering. Springer, Singapore. https://doi.org/10.1007/978-981-19-0296-3_42
[12] Sinap, V. (2024). Comparative analysis of machine learning techniques for credit card fraud detection: Dealing with imbalanced datasets. Turkish Journal of Engineering, 8(2): 196-208. https://doi.org/10.31127/tuje.1386127
[13] Mohammed, N.H., Maram, S.C.R. (2022). Fraud detection of credit card using logistic regression. SSRN Electronic Journal. https://doi.org/10.2139/ssrn.4135514
[14] Alenzi, H.Z., Aljehane, N.O. (2020). Fraud detection in credit cards using logistic regression. International Journal of Advanced Computer Science and Applications, 11(12): 540-551. https://doi.org/10.14569/IJACSA.2020.0111265
[15] Pumsirirat, A., Yan, L. (2018). Credit card fraud detection using deep learning based on auto-encoder and restricted Boltzmann machine. International Journal of Advanced Computer Science and Applications, 9(1): 18-25. https://doi.org/10.14569/IJACSA.2018.090103
[16] Machine Learning Group - ULB. Credit Card Fraud Detection. Kaggle. https://www.kaggle.com/datasets/mlg-ulb/creditcardfraud, accessed on Jan. 10, 2025.
[17] Deepika, K., Nagenddra, M.P.S., Ganesh, M.V., Naresh, N. (2022). Implementation of credit card fraud detection using random forest algorithm. International Journal of Research in Applied Science and Engineering Technology, 10(3): 797-804. https://doi.org/10.22214/ijraset.2022.40702
[18] Soni, K.B. (2021). Credit card fraud detection using machine learning approach. Applied Information System and Management (AISM), 4(2): 71-76. https://doi.org/10.15408/aism.v4i2.20570
[19] Madkaikar, K., Nagvekar, M., Parab, P., Raika, R., Patil, S. (2021). Credit card fraud detection system. International Journal of Recent Technology and Engineering (IJRTE), 10(2): 158-162. https://doi.org/10.35940/ijrte.B6258.0710221
[20] Ponukumati, B.K., Sinha, P., Maharana, M.K., Kumar, A.V.P., Karthik, A. (2022). An intelligent fault detection and classification scheme for distribution lines using machine learning. Engineering, Technology & Applied Science Research, 12(4): 8972-8977. https://doi.org/10.48084/etasr.5107
[21] Pulat, M., Deveci, I. (2021). Bibliometric analysis of theses published on machine learning and decision trees in Turkey. Journal of Management and Economics, 28(2): 287-308.
[22] Tehreem, A., Rabiya, K., Adamu, S.Y., Sheraz, A., Ahmad, T.A., Safa, A., Ibrahim A. H. (2022). A Machine learning and blockchain based efficient fraud detection mechanism. Sensors, 22(19): 7162. https://doi.org/10.3390/s22197162
[23] Stojanović, B., Božić, J., Hofer-Schmitz, K., Nahrgang, K., Weber, A., Badii, A., Sundaram, M., Jordan, E., Runevic, J. (2021). Follow the trail: Machine learning for fraud detection in fintech applications. Sensors, 21(5): 1594. https://doi.org/10.3390/s21051594
[24] Al-Ameer, A.A.A., Huby, A.A. (2025). Hybrid BiLSTM-SVM intrusion detection with decision-based flow ranking. International Journal of Safety and Security Engineering, 15(1): 67-72. https://doi.org/10.18280/ijsse.150107
[25] Alanzi, R., Rassam, M.A. (2025). A comparative study of incremental and batch machine learning methodologies for network intrusion detection. International Journal of Safety and Security Engineering, 15(1): 171-179. https://doi.org/10.18280/ijsse.150118
[26] Habibullayeva, N., Kalejahi, B. (2024). Analyzing credit card fraud cases with supervised machine learning methods: Logistic regression and Naive Bayes. Problems of Information Society, 15(1): 57-63. https://doi.org/10.25045/jpis.v15.i1.06
[27] Boyd, K., Eng, K.H., Page, C.D. (2013). Area under the Precision-Recall Curve: Point Estimates and Confidence Intervals. 451-466. https://doi.org/10.1007/978-3-642-40994-3_29
[28] Zhang, Z. (2016). Introduction to machine learning: K-nearest neighbors. Annals of Translational Medicine, 4(11): 218-218. https://doi.org/10.21037/atm.2016.03.37
[29] Arora, K., Pathak, S., Dieu Linh, N.T. (2023). Comparative analysis of K-NN, Naïve Bayes, and logistic regression for credit card fraud detection. Ingenieria Solidaria, 19(3): 1-22. https://doi.org/10.16925/2357-6014.2023.03.05
[30] Vengatesan, K., Kumar, A., Yuvraj, S., Ambeth Kumar, V.D., Sabnis, S.S. (2020). Credit card fraud detection using data analytics techniques. Advances in Mathematics: Scientific Journal, 9(3): 1177-1188. https://doi.org/10.37418/amsj.9.3.43
[31] Asha, R., Suresh Kumar, K. (2021). Credit card fraud detection using artificial neural network. Global Transitions Proceedings, 2(1): 35-41. https://doi.org/10.1016/j.gltp.2021.01.006