Mahshid Hatamzad*![]() | Ove Tobias Gudmestad
| Ove Tobias Gudmestad![]()
© 2025 The authors. This article is published by IIETA and is licensed under the CC BY 4.0 license (http://creativecommons.org/licenses/by/4.0/).
OPEN ACCESS
In cold-climate areas, variations in weather conditions during the winter can cause unsafe road transportation. Slippery road can be a result of different winter weather conditions (e.g., snow, sleet, and freezing rain), which can lead to severe road accidents. Therefore, finding a relationship between various weather conditions and road accidents plays a crucial role in road traffic safety and maintenance approaches. Hence, this study aims to identify the impact of different weather conditions (e.g., snow, sleet, and freezing rain) on the road surface conditions (RSCs) and to use this information to find a correlation between road conditions and road accidents with personal injuries at Testsite E18 in Sweden. In this study, data points are recorded between the years 2019 and 2023. Three different sensors were used to measure road surface conditions: a sensor mounted in the wheel track, a sensor mounted in the middle of the roadway, and an optical sensor. In addition, road weather station data were used to extract the precipitation to find possible situations with sleet or freezing rain. Finally, multi-sensor data and road accidents with personal injuries were analyzed by use of a qualitative approach to find a correlation between different road weather conditions and road accidents.
road weather conditions, multi-sensor data, sleet, freezing rain, road traffic safety, road accidents
Low road surface temperature (RST) and precipitation can make driving challenging, especially in cold climate areas. Slippery roads increase delays in road traffic and reduce road traffic safety, which can expose motorists to the danger of accidents with injuries and fatalities. To prevent road incidents during winter, it is important to find a correlation between severe road accidents, weather conditions, and road surface conditions (RSCs).
As there is much research, including different types of analysis, to show the correlation between road incidents and road and weather conditions. Hagiwara et al. [1] investigated the rate of road traffic incidents due to road conditions during winter. Their conclusion indicated that the number of accidents reduced when there was no snowfall. Norman et al. [2] utilized a quantitative method to find a relationship between winter road maintenance (WRM), traffic incident risk, and slippery roads. They used data from road weather information in southern Sweden. The results showed that despite high-quality WRM, there is a high risk of road accidents when the road is slippery because of rain and sleet. Andrey et al. [3] analyzed data from six different cities in Canada (Waterloo, Ottawa, Halifax, Hamilton, Regina, and Québec). They conducted a sensitivity analysis to determine the risk of road incidents based on 4 scenarios. They concluded that precipitation is 75% associated with road traffic collisions, and 45 % with injuries, compared to warm seasons; however, the risk level differs according to the weather conditions in different cities. Usman et al. [4] presented a model to find the incident frequency in snowstorms due to slippery road surfaces or friction, and poor visibility. The results showed that RSCs played an important role in road accidents during winter. Yannis and Karlafis [5] used an integer model to estimate the impact of weather on four road incident categories: vehicle incidents, vehicle incidents with injuries, pedestrian incidents, and pedestrian incidents leading to fatalities. They used 21 years of data from Athens, Greece, and the results showed that daily precipitation is a significant variable in road accident occurrence. Andersson and Chapman [6] identified the direct relationship between road incidents and temperature in the West Midlands County in England. Theofilatos and Yannis [7] reviewed the impact of weather conditions on road safety. They found precipitation led to increasing road incidents; however, it does not have a consistent impact on the severity of the incidents. Perrels et al. [8] evaluated the relationship between weather variation and road traffic incidents in Finland. The assessment showed that severe weather conditions can significantly increase road accidents. Black and Mote [9] defined a pair analysis to explore the links between road accident risk and precipitation in winter, including sleet, snowfall, and freezing rain in 13 cities in the United States. The results demonstrated that intense winter precipitation can increase the risk of collisions and injuries. Heqimi et al. [10] proposed a spatial interpolation approach to analyze the impact of snowfall on road traffic accidents in Michigan. They used 10 years of data from road weather stations during winter (December, January, and February). The conclusion indicated that there is a direct link between snowfall and all types of road accidents in winter.
Multi-sensor integration is a powerful approach to enhance the reliability of road condition monitoring. Combining and analyzing data from various sensors provides a more accurate analysis of RSC under different environmental and weather conditions. Casselgren et al. [11] classified road conditions using data from cameras and a laser system to enhance the accuracy of RSC assessments under different winter weather conditions. Diaby et al. [12] used a combination of data from two sensors (camera and microphone) to identify dangerous RSCs under challenging winter conditions to improve decision-making for WRM in cold climate areas. Hong et al. [13] utilized multi-sensor data (round force sensor, water pressure sensor, ultrasonic sensor, and temperature/humidity sensor) to contribute to preventing road accidents due to black ice and improve road safety management. Dilorenzo and Yu [14] provided a review study of the existing sensors to explore icy RSCs to minimize winter road accidents and improve winter road safety. Jiang et al. [15] proposed a methodology to detect RSC using multi-sensor (temperature sensor, road condition sensor, and microwave measurement sensor) data analysis and a neural network algorithm to increase winter road safety and improve WRM strategies. Zhang [16] used data from OBDII sensors and cameras for a precise assessment of RSC and road safety in winter to enhance winter road management strategies.
While several studies have focused on finding the relationship between RSCs, weather conditions, and road safety during winter using multi-sensor data analysis, there is no study to use data points from four different sources (road weather station, sensor mounted in the wheel track, sensor mounted in the middle of the road, and optical sensor) to explore the possible effects of sleet or freezing rain, using the dataset with minimum data loss to find the link between winter road conditions and road accidents with personal injuries. Hence, this study uses datasets from various sources recorded at Testsite E18 in Sweden. Then, data from icy RSCs were extracted from the different datasets to select the dataset with the minimum data loss. In addition, the chosen dataset was used to extract information about possible sleet or freezing rain during autumn and winter. Finally, road accidents with personal injuries were analyzed to determine the correlation between weather conditions, RSC, and severe road accidents.
The remainder of this paper is arranged as follows. Section 2 defines the research question. The road weather data is explained in Section 3. The sensors are described in Section 4. In Section 5, sleet and freezing rain conditions are defined. Road accidents with personal injuries are analyzed in Section 6. The conclusion is drawn in Section 7.
How do different winter road conditions contribute to the increase in the number of winter road accidents with personal injuries at Testsite E18 in Sweden?
This research question has been answered through the following bullet points:
• RSCs were measured by three different sensors: mounted in the wheel track, mounted in the middle of the road, and optical sensors, respectively.
• Due to a power failure and the loss of data points at Testsite E18, RSC data points were analyzed to find the dataset with the minimum data loss.
• Information about precipitation and air temperature was filtered, using data from the road weather station to find the situations with possible sleet or freezing rain.
• The road accident data that led to personal injuries were analyzed, and a correlation between road weather conditions and accidents was found.
In this study, data points recorded every 10 minutes from the year 2019 to 2023 during autumn and winter at the testsite E18 (Trafikverket [17]) are studied. Reviewing the dataset showed that the data points for the years 2019, 2021, and 2022 are available for different months in autumn and winter (January, February, March, October, November, and December). However, the year 2020 missed the data points in November, and the year 2023 missed the data points in October, November, and December.
3.1 Testsite E18 in Sweden
Level 1 Testsite E18 is a permanent and unique research station for meteorology and traffic data measurement. Testsite E18 is located midway between Enköping and Västerås in Sweden [17]. The goal of constructing this station is to improve winter road maintenance, maximize road safety, develop decision-making, and minimize cost and environmental impacts via detailed information. Various weather and road variables can be measured and recorded using modern digital equipment (sensors, instruments, etc.), which utilize artificial intelligence and machine learning algorithms [18]. Testsite E18 is led by Trafikverket (“Swedish Transport Administration”), involving KTH (“Royal Institute of Technology”), VIT (“Swedish National Road and Transport Research Institute”), and SMHI (“Swedish Meteorological and Hydrological Institute”). Approximately 20,000 vehicles pass this research station every day [19].
3.2 Traffic data
Traffic data is recorded at a 10-minute resolution for light (passenger car and passenger car with trailer) and heavy vehicles (truck, bus, and truck with trailer) in both lanes. The peak of traffic for light and heavy vehicles is at 7:00 am and 4:00 pm, where the afternoon peak is higher than the morning peak for light vehicles, and the morning peak is higher than the afternoon peak for heavy vehicles. In total, average hourly traffic for light vehicles varies over the year from approximately 270 vehicles in January to 365 in May. In addition, the average hourly road traffic for heavy vehicles is at the maximum value in May and the minimum value in December. Therefore, there is more road traffic during spring and summer than in autumn and winter. It is important to mention that in May and September; the traffic data loss is large [18].
3.3 Average temperature in Enköping and Västerås
Average air temperature in Enköping and Västerås, respectively. These two figures depict that the average air is approximately the same, and there is no huge weather condition difference between these two locations [20, 21].
In this study, data points were measured by different types of sensors: Vaisala DRS511 (sensor mounted in the wheel track/middle of the road) and Vaisala DSC sensor (optical sensor). The DRS511 sensor calculates the concentration and freezing temperature based on the amount of salt, which is determined by conductivity. The road sensor (Vaisala DRS511) provides us with real-time road surface data, which can help us monitor and analyze RSCs and optimize WRM operations. The Vaisala DRS511 sensor is directly embedded into the road. This sensor measures the current water layer, amount of chemicals, and ground and surface temperatures to determine whether the amount of salt on the road surface is enough to prevent the road surface from ice formation during wintertime [22]. DSC/DST calculates the friction based on measured snow and water layer thicknesses. The remote surface state (Vaisala DSC) sensor series utilizes laser technology to identify frost, slush, water, snow, and ice, and measure grip even in the case of heavy traffic [23].
In the first stage, data points from different sensors were analyzed based on icy surface conditions. It is important to mention that the loss of data is mainly due to power failures at the measuring station [18]. The missing data was due to sensor malfunctions. No data imputation was applied in this study. To maintain the reliability of the analysis, we excluded all periods where datapoints were missing due to sensor errors. This approach was chosen to avoid artificial patterns or biases, considering the use of the qualitative analysis approach.
4.1 Sensor mounted in the wheel track (DRS511 1)
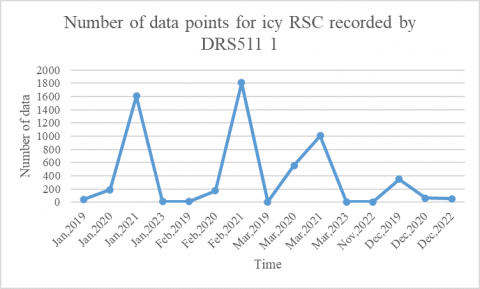
The icy conditions measured by the sensor mounted in the wheel track (DRS511 1) were extracted from the dataset for further analysis. Figure 1 plots the number of icy surface conditions recorded by DRS511 1.
Figure 1. Number of data points for icy RSC recorded by DRS511 1
The analysis showed that January 2021 had the most data points for icy conditions (1605), while January 2023 had the minimum number of icy surface conditions (7), and the sensor faced an error in recording RSCs in January 2022.
The icy RSC data points in February showed that February 2021 had the maximum number of icy conditions (1808), whereas February 2019 had the minimum number of icy RSCs (8). However, February 2022 faced an error in recording RSC, and no icy conditions were recorded in February 2023.
The icy RSC data points in March demonstrated that March 2021 had the greatest number of icy RSCs (1008), and March 2019 had the least number of icy conditions (5), whereas March 2022 faced an error in recording RSC.
Analyzing the icy RSC data points in October revealed that no icy conditions were recorded in October 2019 and 2022, and the sensor reported an error in October 2020 and 2021. Therefore, no icy RSC data points are available for October in the different years.
Evaluating icy RSC data points in November indicated that the only recorded data points were in November 2022, which was just 2 data points. No icy conditions were shown in November 2021, while the sensor faced an error in reporting icy RSC in November 2020.
Looking at icy RSC data points in December, depicted that December 2019 had the maximum number of icy conditions (349), while December 2022 recorded the minimum number of icy RSCs. In addition, the sensor reported an error for icy conditions in December 2021.
4.2 Sensor mounted in the middle of the road
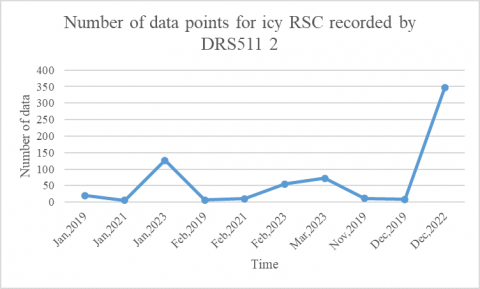
The icy RSC measured by the sensor mounted in the middle of the road (DRS511 2) was extracted from the dataset for further analysis. Figure 2 plots the number of icy surface conditions recorded by DRS511 2.
Figure 2. Number of data points for icy RSC recorded by DRS511 2
The extraction showed that January 2023 recorded the highest number of icy RSCs (127) compared to January 2021, which recorded the lowest number of icy RSC data points. Moreover, no icy road conditions were reported in January 2020, and the sensor faced an error in recording RSC in January 2022. The number of icy RSC data points in January in different years are shown in tables.
Analyzing RSC data points in February demonstrated that February 2023 had the maximum number of icy RSCs (55), whereas February 2019 had the minimum number of data points in icy RSC. Furthermore, no icy RSC was reported in February 202, and the sensor faced an error in reporting an icy RSC in February 2022.
Evaluating icy RSC data points in March showed that 72 icy road conditions were recorded in March 2023. In addition, March 2023 was the only year reported by DRS511 2. There was no icy RSC in March 2019, 2020, and 2021. Moreover, the sensor faced an error in reporting icy RSC in March 2022.
Analyzing the icy RSC data points in October revealed that no icy conditions were recorded in October 2019 and 2022, and the sensor reported an error in October 2020 and 2021. Therefore, no icy RSC data points are available for October in the different years.
Evaluating icy RSC data points in November indicated that the only recorded data points were in November 2019, which was 11 data points. No icy conditions were shown in November 2021 and 2022.
The icy RSC data points in December demonstrated that the only reported icy RSCs were in December 2022 (347) and December 2019 (9). Additionally, there was no icy RSC in December 2020, and the sensor reported an error in December 2021.
4.3 Optical sensor (DSC/DST)
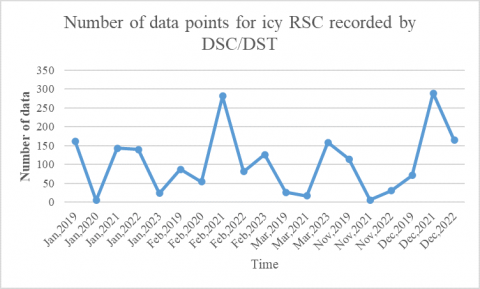
The icy RSC was measured by an optical sensor (DSC/DST) extracted from the dataset for further analysis. Figure 3 plots the number of icy surface conditions recorded by DSC/DST.
Figure 3. Number of data points for icy RSC recorded by DSC/DST
The extraction showed that January 2021 had the maximum number of icy RSCs, while January 2020 recorded the least number of icy conditions.
The analysis showed that February 2021 recorded the highest number of icy RSCs, whereas February 2021 had the lowest number of icy RSC data points.
Evaluating icy RSC data points in February showed that March 2023 had the maximum number of icy RSC data points, while March 2021 had the lowest number of icy conditions (17). In addition, no icy RSC was reported in March 2020 and 2022.
Extracting icy RSC data points in October demonstrated that no icy RSC was reported by the sensor in different years.
Analyzing icy RSC data points in November revealed that November 2019 had the maximum number of icy RSC data points, whereas November 2021 recorded the least number of icy conditions on the road surface. Furthermore, no icy RSC data points were recorded in November 2020.
Evaluation of icy RSC data points in December showed that December 2021 had the highest number of icy RSCs, while December 2019 had the lowest number of data points for icy RSCs. In addition, there were no icy RSC data points in December 2020.
Analysis of icy RSCs measured by different sensors showed that the optical sensor recorded more data points for icy RSCs.
The maintenance workers will rely on the weather forecast, combined with information about the temperature transmitted by the sensors. If the temperature has been low for a while, the road temperature is low, and rain could freeze when it hits the ground.
Freezing rain and sleet can lead to very dangerous driving conditions. Freezing rain happens when rain freezes due to a shallow freezing layer close to the road surface. Sleet is snow, which turns to rain when it reaches a warmer air layer, and it refreezes due to the thin layer of cold air above the road surface [24].
Due to the highest number of RSC data points recorded by the optical sensor, it was decided to use icy RSC data points reported by this sensor. In addition, the variable analysis was extended based on precipitation type (rain and snow) reported by the road weather station (RWS). It is important to mention that light snow/rain has not been considered in this extraction. Table 1 shows the number of icy RSC data points due to rain and snow for different months in different years. As shown, December 2021 had the highest icy RSCs.
Table 1. Number of icy RSCs due to rain and snow for different months in different years
|
Year |
Jan. |
Feb. |
Mar. |
Oct. |
Nov. |
Dec. |
|
2019 |
42 |
55 |
- |
- |
- |
29 |
|
2020 |
- |
- |
- |
- |
- |
- |
|
2021 |
- |
- |
16 |
- |
- |
96 |
|
2022 |
59 |
42 |
- |
- |
22 |
- |
|
2023 |
19 |
- |
- |
- |
- |
- |
Filtering data points according to the mentioned variables (RSC and precipitation type) helped us to extract freezing rain and/or sleet conditions. Extracting information in January for the different years showed that in January 2019, 41 icy driving conditions were related to snowy weather, however, the weather was rainy at 1 datapoint. Table 2 shows the timestamp, air temperature, and RST recorded by two mounted sensors on the road. As is shown in Table 2, the air temperature was -0.3℃, while RST was -1℃ on the wheel track and -1.5℃ in the middle of the road.
Table 2. Possible freezing rain/sleet in January 2019
|
Timestamp |
Surface Temp. (℃) DRS511 1 |
Surface Temp. (℃) DRS511 2 |
Air Temp. (℃) |
|
16.1.2019 18:50 |
-1 |
-1.5 |
-0.3 |
No rainy weather was reported in icy RSCs in January 2020 and 2021.
Table 3 shows the road conditions in January 2022. 59 datapoints were reported icy RSCs; however, in 8 of them, the weather was rainy (51 datapoints demonstrated snowy weather). As is shown in Table 3, the air temperature was between -1.1℃ and 0.6℃, but both sensors missed recording RST.
Table 3. Possible freezing rain/sleet in January 2022
|
Timestamp |
Surface Temp. (℃) DRS511 1 |
Surface Temp. (℃) DRS511 2 |
Air Temp. (℃) |
|
08.01.2022 09:20 |
- |
- |
-1.1 |
|
08.01.2022 09:30 |
- |
- |
-1.1 |
|
08.01.2022 09:40 |
- |
- |
-1.1 |
|
08.01.2022 09:50 |
- |
- |
-0.9 |
|
12.01.2022 00:20 |
- |
- |
-0.1 |
|
12.01.2022 00:50 |
- |
- |
0.2 |
|
12.01.2022 02:00 |
- |
- |
0.2 |
|
30.01.2022 07:30 |
- |
- |
0.6 |
Table 4. Possible freezing rain/sleet in January 2023
|
Timestamp |
Surface Temp. (℃) DRS511 1 |
Surface Temp. (℃) DRS511 2 |
Air Temp. (℃) |
|
07.01.2023 09:40 |
-1.5 |
-1.7 |
-0.1 |
|
07.01.2023 09:50 |
-1.4 |
-1.5 |
0 |
|
20.01.2023 07:50 |
-0.6 |
-0.9 |
-0.5 |
|
20.01.2023 08:20 |
-0.7 |
-0.9 |
-0.5 |
Table 4 shows RSCs in January 2023. Between 19 data points related to icy RSC, rainy weather was reported in 4 cases, and the rest (15 cases) reported snowy weather. In the 4 rainy cases, the minimum and maximum air temperatures were -0.5℃ and 0℃, respectively. In addition, RST measured by the sensors showed slightly higher temperatures on the wheel track. This can be due to friction between the tires and the road surface.
Table 5. Possible freezing rain/sleet in February 2019
|
Timestamp |
Surface Temp. (℃) DRS511 1 |
Surface Temp. (℃) DRS511 2 |
Air Temp. (℃) |
|
02.02.2019 21:50 |
-0.5 |
-0.6 |
-0.2 |
|
02.02.2019 22:10 |
-0.5 |
-0.6 |
-0.3 |
|
02.02.2019 22:20 |
-0.4 |
-0.6 |
-0.3 |
|
07.02.2019 01:40 |
-2.2 |
-2.1 |
-0.3 |
Table 5 shows the recorded RSCs in February 2019. 4 icy RSCs reported rainy weather amongst 55 data points, which means that the weather was snowy in 51 icy RSCs. In these 4 data points, the air temperature was around -0.3℃ and the RST was approximately between -2.1℃ and -0.6℃.
No rain was reported in icy RSCs in February 2020, 2021, and 2023.
Table 6. Possible freezing rain/sleet in February 2022
|
Timestamp |
Surface Temp. (℃) DRS511 1 |
Surface Temp. (℃) DRS511 2 |
Air Temp. (℃) |
|
04.02.2022 02:10 |
- |
- |
0.6 |
|
04.02.2022 02:20 |
- |
- |
0.7 |
In February 2022, 42 cases were reported in icy RSCs, where 2 cases were reported in rainy weather (Table 6). Unfortunately, no RST data was recorded by two sensors, but the air temperature was around 0.6℃.
No rainy condition was reported in March 2019 and 2023, and no icy RSC was reported in March 2020 and 2022.
Table 7. Possible freezing rain/sleet in March 2021
|
Timestamp |
Surface Temp. (℃) DRS511 1 |
Surface Temp. (℃) DRS511 2 |
Air Temp. (℃) |
|
11.03.2021 17:30 |
-0.3 |
-0.2 |
0.2 |
|
11.03.2021 17:40 |
-0.2 |
-0.2 |
0.2 |
|
11.03.2021 18:20 |
-0.2 |
-0.2 |
0.3 |
|
11.03.2021 18:30 |
-0.2 |
-0.1 |
0.4 |
|
11.03.2021 19:00 |
-0.6 |
-0.4 |
0.4 |
Table 8. Possible freezing rain/sleet in November 2022
|
Timestamp |
Surface Temp. (℃) DRS511 1 |
Surface Temp. (℃) DRS511 2 |
Air Temp. (℃) |
|
21.11.2022 21:20 |
-0.7 |
-0.8 |
-0.2 |
|
21.11.2022 21:30 |
-0.6 |
-0.8 |
0 |
Table 9. Possible freezing rain/sleet in December 2019
|
Timestamp |
Surface Temp. (℃) DRS511 1 |
Surface Temp. (℃) DRS511 2 |
Air Temp. (℃) |
|
03.12.2019 14:50 |
-0.8 |
-0.7 |
-0.3 |
|
03.12.2019 15:00 |
-0.8 |
-0.7 |
-0.2 |
Tables 7-9 show two possible freezing rains during December 2019. In 29 icy cases, 2 cases reported rainy weather. In these cases, the air temperature was almost -0.3℃, and RST was slightly higher than -1℃.
No rain was reported in November 2019, and no icy RSC was reported in October 2019, 2020, 2021, and 2022.
In November 2022, 20 icy RSCs were due to snowy weather, however, 2 icy RSCs were related to rainy weather (Table 8). RWS reported air temperature was between -0.2℃ and 0℃, and RST was around -0.8℃.
In March 2021, the weather was rainy in 5 icy RSCs (Table 7), and snowy in 11 cases. RWS showed that the air temperature was between 0.2℃ and 0.4℃, and the sensors showed that RST was -0.6℃ and -0.4℃.
No icy RSC was reported in December 2020, and no rainy condition was reported in December 2022.
In December 2021, RSC was icy in 96 cases, where 14 cases reported rainy weather (Table 10). In these cases, the air temperature was between -1℃ and -0.2℃. Unfortunately, no RST was recorded by the sensors.
Table 10. Possible freezing rain/sleet in December 2021
|
Timestamp |
Surface Temp. (℃) DRS511 1 |
Surface Temp. (℃) DRS511 2 |
Air Temp. (℃) |
|
12.12.2021 01:50 |
- |
- |
-1 |
|
12.12.2021 05:20 |
- |
- |
-1.4 |
|
12.12.2021 05:40 |
- |
- |
-1.3 |
|
29.12.2021 01:40 |
- |
- |
-0.1 |
|
29.12.2021 01:50 |
- |
- |
-0.2 |
|
29.12.2021 02:00 |
- |
- |
-0.2 |
|
29.12.2021 02:10 |
- |
- |
-0.2 |
|
29.12.2021 02:20 |
- |
- |
-0.3 |
|
29.12.2021 02:30 |
- |
- |
-0.3 |
|
29.12.2021 02:40 |
- |
- |
-0.3 |
|
29.12.2021 02:50 |
- |
- |
-0.3 |
|
29.12.2021 03:00 |
- |
- |
-0.3 |
|
29.12.2021 03:10 |
- |
- |
-0.4 |
|
29.12.2021 05:10 |
- |
- |
-0.8 |
6.1 Road accident data
Road accident data at Testsite E18 between Enköping and Västerås during 2019-2023 was provided by the Swedish Transport Agency [25]. These accidents have resulted in personal injuries reported by police or emergency hospitals. Table 11 shows the number of road accidents per month in the different years. As shown, the maximum and minimum numbers of road accidents belong to the years 2019 and 2020, respectively. The low number of road accidents in the year 2020 can be due to the coronavirus situation and lockdown. In addition, the highest number of total road accidents occurs in December, whereas the lowest number of total road accidents occurs in June and September. Moreover, among the reported 83 road accidents, 51 accidents occurred during cold months (Jan, Feb, Mar, Oct, Nov, Dec), which means that severe road accidents are considerably more common during harsh road weather conditions.
Table 11. Number of road accidents with personal injuries per month in Testsite E18 between Enköping and Västerås during 2019-2023
|
Month |
Jan. |
Feb. |
Mar. |
Apr. |
May |
Jun. |
Jul. |
Aug. |
Sep. |
Oct. |
Nov. |
Dec. |
|
2019 |
1 |
3 |
2 |
2 |
2 |
0 |
3 |
2 |
1 |
0 |
3 |
2 |
|
Summation of 3 months in 2019 |
6 |
4 |
6 |
5 |
||||||||
|
2020 |
0 |
3 |
0 |
0 |
0 |
0 |
1 |
1 |
2 |
2 |
0 |
0 |
|
Summation of 3 months in 2020 |
3 |
0 |
4 |
2 |
||||||||
|
2021 |
0 |
2 |
2 |
1 |
3 |
0 |
1 |
2 |
0 |
3 |
2 |
4 |
|
Summation of 3 months in 2021 |
4 |
4 |
3 |
9 |
||||||||
|
2022 |
3 |
0 |
0 |
2 |
1 |
3 |
0 |
1 |
1 |
1 |
0 |
3 |
|
Summation of 3 months in 2022 |
3 |
6 |
2 |
4 |
||||||||
|
2023 |
3 |
1 |
3 |
0 |
0 |
1 |
1 |
1 |
0 |
0 |
4 |
4 |
|
Summation of 3 months in 2023 |
7 |
1 |
2 |
8 |
||||||||
|
Total |
7 |
9 |
7 |
5 |
6 |
4 |
6 |
7 |
4 |
6 |
9 |
13 |
|
Summation of 3 months during 2019-2023 |
23 |
15 |
17 |
28 |
||||||||
6.2 Correlations between RSCs and road accidents
To find a correlation between road accidents and RSC, road weather data is used to explore the road conditions when the accidents happened. 43 road accidents were considered since road weather data points were not available in October 2023, November 2023, and December 2023 (8 accidents occurred during these months). In addition, the exact accident time was not available for 3 road accidents (the 5th of March 2023, the 18th of October 2021, and the 14th of December 2022). Therefore, in total, 40 road accidents were considered for further analysis.
In January 2019, the only reported road accident that led to personal injuries occurred when the road surface was slushy, and there was no precipitation (Table 12).
Table 12. Road surface and weather conditions when the accident occurred in January 2019
|
Time of Road Accidents |
Surface Temp DRS511 1 |
Surface Temp DRS511 2 |
Surface State DSC |
Air Temp |
Rain/Snow |
|
25.1.2019 17:00 |
-4.9℃ |
-4.8℃ |
slushy |
-4.9℃ |
none |
Table 13. Road surface and weather conditions when the accident occurred in January 2022
|
Time of Road Accidents |
Surface Temp DRS511 1 |
Surface Temp DRS511 2 |
Surface State DSC |
Air Temp |
Rain/Snow |
|
21.01.2022 05:00 |
- |
- |
dry |
-2.9℃ |
none |
|
22.01.2022 10:00 |
- |
- |
dry |
-5.8℃ |
light snow |
|
22.01.2022 10:20 |
- |
- |
dry |
-5.5℃ |
light snow |
Table 13 shows that the 3 road accidents happened when the RSC was dry, however, there was light snow in 2 accidents in January 2022.
In January 2023, the 3 road accidents had different statuses on the road surface. In one case, the road was wet, and the weather was snowy. In two other cases, the road surface was dry and snowy, and there was no precipitation (Table 14).
Table 14. Road surface and weather conditions when the accident occurred in January 2023
|
Time of Road Accidents |
Surface Temp DRS511 1 |
Surface Temp DRS511 2 |
Surface State DSC |
Air Temp |
Rain/Snow |
|
13.01.2023 09:00 |
1.3℃ |
1.0℃ |
wet |
1.4℃ |
light snow |
|
16.01.2023 14:10 |
0.9℃ |
1.4℃ |
dry |
2.8℃ |
none |
|
18.01.2023 08:20 |
-0.6℃ |
-0.7℃ |
snowy |
0.6℃ |
none |
Table 15. February road surface and weather conditions when the accident occurred in February 2019
|
Time of Road Accidents |
Surface Temp DRS511 1 |
Surface Temp DRS511 2 |
Surface State DSC |
Air Temp |
Rain/Snow |
|
01.02.2019 17:00 |
-2.4℃ |
-2.6℃ |
slushy |
-2.5℃ |
light rain |
|
01.02.2019 20:40 |
-2.6℃ |
-3℃ |
snowy |
-2.2℃ |
light snow |
|
16.02.2019 01:00 |
-0.3℃ |
-0.1℃ |
wet |
4℃ |
none |
Table 15 shows that in January 2023, the 3 road accidents had different conditions on the road surface and type of precipitation. In the first accident, the road surface was slushy while the weather was rainy. In the second accident, the weather and road surface were snowy.
In February 2022, there was light snow in the 3 reported accidents, while RSC was dry in 2 cases and wet in one accident (Table 16).
Table 16. Road surface and weather conditions when the accident occurred in February 2020
|
Time of Road Accidents |
Surface Tempe DRS511 1 |
Surface Temp DRS511 2 |
Surface State DSC |
Air Tempe |
Rain/Snow |
|
04.02.2020 11:00 |
-0.6℃ |
-0.5℃ |
dry |
-1.9℃ |
light snow |
|
05.02.2020 11:10 |
0.1℃ |
0.3℃ |
dry |
-0.9℃ |
light snow |
|
27.02.2020 17:00 |
-0.7℃ |
-0.8℃ |
wet |
-1.6℃ |
light snow |
Table 17. Road surface and weather conditions when the accident occurred in February 2021
|
Time of Road Accidents |
Surface Temp DRS511 1 |
Surface Temp DRS511 2 |
Surface State DSC |
Air Tempe |
Rain/Snow |
|
08.02.2021 07:00 |
-10.4℃ |
-10.7℃ |
snowy |
-9.4℃ |
light snow |
|
27.02.2021 20:00 |
2.2℃ |
2.1℃ |
dry |
3.5℃ |
none |
Table 17 shows the road and weather information when 2 road accidents happened in February 2021. In the first accident, the RSC and weather were snowy, whereas the RSC was dry with no precipitation in the second accident.
The only reported accident in February 2023 occurred when the road surface was snowy, and it was light snow (Table 18). This situation could be due to freezing rain/sleet.
Table 18. Road surface and weather conditions when the accident occurred in February 2023
|
Time of Road Accidents |
Surface Temp DRS511 1 |
Surface Temp DRS511 2 |
Surface State DSC |
Air Temp (℃) |
Rain/Snow |
|
05.02.2023 17:10 |
-2.8℃ |
-3.0℃ |
icy |
-2.3℃ |
light snow |
Table 19. Road surface and weather conditions when the accident occurred in March 2019
|
Time of Road Accidents |
Surface Temp DRS511 1 |
Surface Temp DRS511 2 |
Surface State DSC |
Air Temp |
Rain/Snow |
|
08.03.2019 19:00 |
-0.5℃ |
-0.5℃ |
icy |
-1.3℃ |
light snow |
|
26.03.2019 11:00 |
0.5℃ |
0℃ |
dry |
2.5℃ |
none |
In March 2019, the first accident happened when the weather was snowy, and the RSC was icy. This condition can indicate the possible freezing rain/sleet. The second accident happened when the road surface was dry, and there was no precipitation (Table 19).
In March 2021, the RSC was dry in both accidents, however, the weather was snowy in the first accident, and no precipitation was reported in the second interview (Table 20).
Table 20. Road surface and weather conditions when the accident occurred in March 2021
|
Time of Road Accidents |
Surface Temp (℃) DRS511 1 |
Surface Temp DRS511 2 |
Surface State DSC |
Air Temp |
Rain/Snow |
|
01.03.2021 07:00 |
-0.6℃ |
-0.8℃ |
dry |
0.2℃ |
light rain |
|
02.03.2021 17:10 |
7.3℃ |
6.6℃ |
dry |
7.9℃ |
none |
In March 2023, of the 3 reported road accidents, one accident had missing time information. The information from 2 other accidents showed that there was light snow in both accidents, however, the road surface was not the same. In the first accident, the road surface was icy, which can indicate the possible freezing rain/sleet. In the second accident, the RSC was wet (Table 21).
Table 21. Road surface and weather conditions when the accident occurred in March 2023
|
Time of Road Accidents |
Surface Temp DRS511 1 |
Surface Temp DRS511 2 |
Surface State DSC |
Air Temp |
Rain/Snow |
|
27.03.2023 17:10 |
-0.9℃ |
-0.8℃ |
icy |
-4.2℃ |
light snow |
|
28.03.2023 10:20 |
-3.2℃ |
-2.7℃ |
wet |
-3.1℃ |
light snow |
|
05.03.2023 Time |
- |
- |
- |
- |
- |
Table 22. Road surface and weather conditions when the accident occurred in October 2020
|
Time of Road Accidents |
Surface Temp DRS511 1 |
Surface Temp DRS511 2 |
Surface State DSC |
Air Temp |
Rain/Snow |
|
03.10.2020 16:00 |
- |
- |
dry |
14℃ |
none |
|
09.10.2020 07:00 |
- |
- |
wet |
9.7℃ |
light rain |
In October 2020, one of the road accidents occurred in a dry RSC with no precipitation. The second accident happened when the road surface was dry, and there was light rain (Table 22).
Between the 3 reported road accidents in October 2021, time information was missing in one accident. In two other accidents, the RSC was dry with no precipitation (Table 23).
Table 23. Road surface and weather conditions when the accident occurred in October 2021
|
Time of Road Accidents |
Surface Temp DRS511 1 |
Surface Temp DRS511 2 |
Surface State DSC |
Air Temp |
Rain/Snow |
|
18.10.2021 Time |
- |
- |
- |
- |
- |
|
31.10.2021 20:00 |
- |
- |
dry |
6.6℃ |
none |
|
31.10.2021 20:20 |
- |
- |
dry |
6.6℃ |
none |
In October 2022, the only reported road accident occurred when the road surface was dry with no precipitation (Table 24).
Table 24. Road surface and weather conditions when the accident occurred in October 2022
|
Time of Road Accidents |
Surface Temp DRS511 1 |
Surface Temp DRS511 2 |
Surface State DSC |
Air Temp |
Rain/Snow |
|
18.10.2022 20:00 |
7.5℃ |
7.1℃ |
dry |
6.9℃ |
none |
Table 25. Road surface and weather conditions when the accident occurred in November 2019
|
Time of Road Accidents |
Surface Temp DRS511 1 |
Surface Temp DRS511 2 |
Surface State DSC |
Air Temp |
Rain/Snow |
|
08.11.2019 16:00 |
2.5℃ |
2.3℃ |
wet |
1.9℃ |
light rain |
|
29.11.2019 04:00 |
-0.2℃ |
-0.5℃ |
snowy |
-2.4℃ |
light snow |
|
29.11.2019 08:50 |
-1.3℃ |
-1.4℃ |
icy |
-2.2℃ |
light snow |
In November 2019, the first accident occurred when the road surface was wet with light rain. The second accident happened when the RSC was snowy, and it snowed lightly. In the third accident, the road surface was icy, and there was light snow (Table 25). The third condition can indicate the possible freezing rain/sleet.
In November 2021, 2 accidents occurred when there was no precipitation. Road surface status in the first and second accidents was wet and dry, respectively (Table 26).
Table 26. Road surface and weather conditions when the accident occurred in November 2021
|
Time of Road Accidents |
Surface Temp DRS511 1 |
Surface Temp DRS511 2 |
Surface State DSC |
Air Temp |
Rain/Snow |
|
01.11.2021 09:00 |
- |
- |
wet |
9.9℃ |
none |
|
12.11.2021 16:00 |
- |
- |
dry |
0.7℃ |
none |
In December 2019, while one accident occurred in a dry RSC with no precipitation, the other accident occurred when the road was icy, and there was light snow (Table 27). This condition can show a possible freezing rain/sleet.
Table 27. Road surface and weather conditions when the accident occurred in December 2019
|
Time of Road Accidents |
Surface Temp DRS511 1 |
Surface Temp DRS511 2 |
Surface State DSC |
Air Temp |
Rain/Snow |
|
10.12.2019 09:00 |
-6.5℃ |
-6.9℃ |
icy |
-6.2℃ |
light snow |
|
27.12.2019 15:00 |
-1.8℃ |
-2.1℃ |
dry |
-2.2℃ |
none |
Table 28. Road surface and weather conditions when the accident occurred in December 2021
|
Time of Road Accidents |
Surface Temp DRS511 1 |
Surface Temp DRS511 2 |
Surface State DSC |
Air Temp |
Rain/Snow |
|
03.12.2021 05:00 |
- |
- |
snowy |
-7.8℃ |
light snow |
|
12.12.2021 04:20 |
- |
- |
icy |
-1.7℃ |
light snow |
|
15.12.2021 14:00 |
- |
- |
wet |
7℃ |
none |
|
30.12.2021 01:00 |
- |
- |
icy |
-2.4℃ |
light snow |
In December 2021, the second and fourth accidents occurred when the road surface was icy, and there was light snow. This condition can depict the possible freezing rain/sleet. In the first accident, there was light snow with snowy RSC. In the third accident, the road surface was wet, while there was no precipitation (Table 28).
Table 29. Road surface and weather conditions when the accident occurred in December 2022
|
Time of Road Accidents |
Surface Temp DRS511 1 |
Surface Temp DRS511 2 |
Surface State DSC |
Air Temp |
Rain/Snow |
|
09.12.2022 15:00 |
-5.8℃ |
-5.9℃ |
wet |
-6.7℃ |
light snow |
|
14.12.2022 10:20 |
-6.9℃ |
-7℃ |
snowy |
-8.7℃ |
light snow |
|
14.12.2022 Time |
- |
- |
- |
- |
- |
In December 2022, 2 road accidents occurred when there was light snow. However, the RSC was wet and snowy in the first and second accidents, respectively (Table 29).
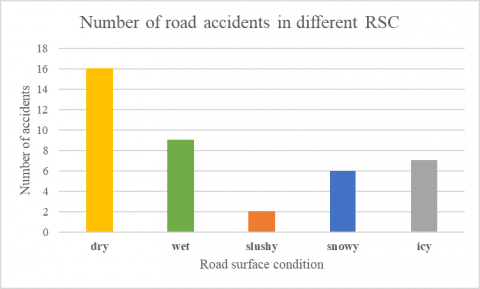
Figure 4. Number of road accidents with personal injuries in different RSCs
Figure 4 shows the number of road accidents in different RSCs. As shown, the maximum number of road accidents occurred when the road surface was dry. In addition, the minimum number of road accidents occurred when the road surface was slushy.
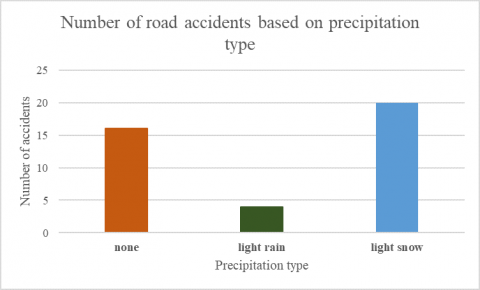
Figure 5. Number of road accidents with personal injuries based on precipitation type
Figure 5 shows the number of accidents based on precipitation type. As shown, the highest number of road accidents occurred when there was light snow.
Since one factor (either RSC or precipitation type) is not enough to conclude. There was a need to find the number of accidents according to a combination of these two important factors.
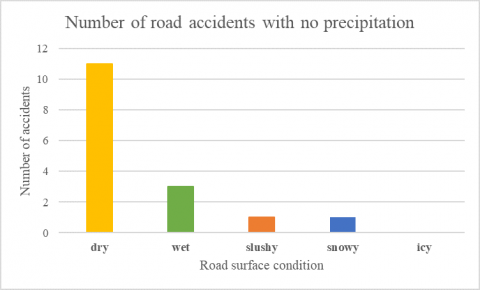
Figure 6. Number of road accidents with personal injuries when there was no precipitation
Figure 6 shows the number of accidents when there was no precipitation. In this condition, 11 accidents occurred when the road surface was dry, and no accidents occurred when the road surface was icy.
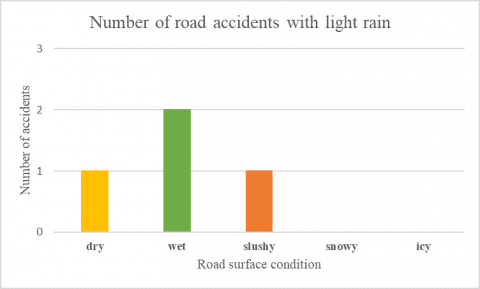
Figure 7. Number of road accidents with personal injuries when there was a light rain
Figure 7 shows the number of accidents when there was light rain. As is shown, 2 accidents occurred when the road surface was wet, and 2 accidents happened in dry RSC and slushy RSC.
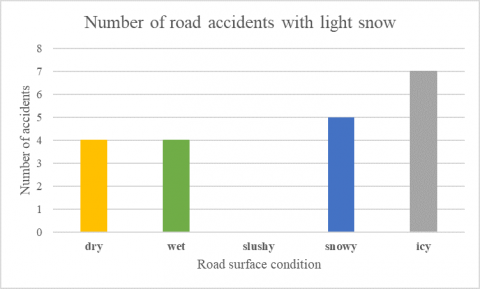
Figure 8. Number of road accidents with personal injuries when there was light snow
Figure 8 shows the number of accidents when there was light snow. As is shown, the maximum number of accidents occurred when the road surface was icy, and no accident was reported in a slushy RSC.
To sum up, the highest number of accidents occurred when the road surface was dry with no precipitation. After that, the second highest number of accidents occurred when the road surface was icy, and there was light snow. A precise distinction between freezing rain and sleet requires vertical atmospheric information (e.g., sounding or radar-based temperature at different altitudes). The current analysis relies on RSC and precipitation type. However, if we accept the uncertainty in distinguishing sleet and freezing rain based on the available data, Figure 7 shows that when there was light rain and icy RSC (freezing rain), no road accident with injuries was reported. This could be due to the obvious hazard when driving on icy roads, resulting in high attention by the drivers. In addition, Figure 8 shows that when there was light snow and RSC was snowy (sleet), five accidents occurred.
6.2 RST and air temperature
In this subsection, RST on the wheel track, RST on the middle of the track, and air temperature are plotted for each accident in different months and years.
Analysis shows, seven accidents occurred during January 2019-2023, where all the accidents are numbered in the order considering the tables in subsection 6.2. To explain more, the first accident happened in January 2019, and the last three accidents were in January 2023. In January 2019-2023, 4 accidents happened when the RST on the wheel track was between -3℃ and 3℃, and 3 accidents occurred when the RST on the wheel track was less than -5℃. Although Acc3 and Acc4 missed RST on the wheel track, analysis has shown that RST is almost equal to the air temperature.
In total, nine accidents occurred during February 2019-2023. Of 9 accidents, 8 accidents happened when RST was on the wheel track between -3℃ and 3℃. In addition, one accident happened when RST on the wheel track was less than -10℃.
Seven road accidents occurred during March 2019-2023, where 5 accidents happened when RST on the wheel track was between -3℃ and 3℃, one accident happened when RST was over 7℃, and the last accident missed time.
Six accidents were registered during October 2019-2022, where one accident missed time information, and five accidents registered RST over 6℃ on the wheel track.
Five road accidents were registered in November 2019-2022, where RST on the wheel track was between -3℃ and 3℃ in 4 accidents, and air temperature was almost 10℃ in one accident.
Nine accidents occurred during December 2019-2022; however, one accident had missing time information. Among 8 of the accidents, 4 accidents happened when RST on the wheel track was almost less than -6℃, 3 accidents happened when the temperature was between 0℃ and -3℃, and one accident occurred when the air temperature was over 7℃.
6.3 Correlations between RST and accidents
Evaluating the RST and the road accidents with personal injuries indicated that among 40 accidents with available information, 24 accidents occurred when the RST was between -3℃ and 3℃, eight accidents happened when the RST was less than -4℃, and 8 accidents happened when the RST was over 4℃. Note that the number of days when RST on the wheel track was between -3℃ and 3℃ was higher than the number of days when RST on the wheel track was less than -4℃ in different cold months of the year. (January 2019, February 2021, and December 2022 registered more data points when RST was less than -4℃).
This study has identified a correlation between road weather conditions and road accidents with personal injuries during autumn and winter at Testsite E18 in Sweden. Road weather condition data were measured by three sensors: one optical sensor, and two sensors mounted on the road (in the wheel track and one in the middle of the road). Analyzing data obtained by these three sensors showed that the optical sensor had the minimum data loss. Although there was not much difference between measurements from the three sensors, the dataset from the optical sensor was chosen due to minimum data loss. Icy road surface conditions extracted from the optical sensor dataset and precipitation type from road weather station data were used to find the average road surface temperature and the possibility of sleet or freezing rain at this location. In addition, road accidents with personal injuries at this location were analyzed based on the date and time of the year to extract weather and road surface conditions during the road accidents.
The results indicate that icy road surface conditions, together with light snow, had the second-highest number of road accidents leading to personal injuries. Moreover, despite a higher average daily traffic in spring and summer, higher accident rates were registered in autumn and winter. Among the reported 83 road accidents during 2019-2023, 51 accidents occurred during the cold months (January, February, March, October, November, and December), and 32 accidents occurred during warm months (April, May, June, July, August, and September).
Information for 40 road accidents during the cold months was available for more analysis, while information about 11 accidents was missed due to a lack of weather and road datasets in October 2023, November 2023, and December 2023 for 8 accidents, and information from 3 accidents in October 2021, December 2022, and March 2023. Among the 40 accidents with personal injury identified, 24 accidents occurred when the road temperature was between -3℃ and 3℃. Furthermore, the number of road accidents when the road surface temperature during this cold period was less than -4℃ was equal to 8, with the same number when the temperature was above 4℃. Thus, the number of road accidents that occurred when the road surface temperature was between -3℃ and 3℃ was three times the number of road accidents when the road surface temperature was less than -4℃ or above 4℃. Note that the average temperature during December, January, February, and March was -2℃ or below. Thus, there is a strong correlation between road accidents and weather and road surface conditions in winter at Testsite E18, with a high number of accidents when the road temperature is around the freezing point.
Winter road maintenance is needed when the temperature is close to zero, particularly when near-zero temperatures and freezing rain or sleet are forecasted. During very cold periods, the needs are lower. In addition, snow removal and salting can be prioritized in high-risk areas. Moreover, the installation of road signs helps drivers reduce speed in risky conditions, particularly on curves and slopes.
For future research, it should be possible to identify a relationship between winter road maintenance conditions and road traffic accidents.
The authors would like to express their appreciation to Traffic Safety Analyst, Tomas Fredlund at the Swedish Transport Agency for providing them with road traffic accidents with personal injuries.
[1] Hagiwara, T., Onodera, Y., Fujiwara, T., Nakatsuji, T., Kaku, T. (1990). Road conditions and accidents in winter. In Surface Characteristics of Roadways: International Research and Technologies. ASTM International. https://doi.org/10.1520/STP23380S
[2] Norrman, J., Eriksson, M., Lindqvist, S. (2000). Relationships between road slipperiness, traffic accident risk, and winter road maintenance activity. Climate Research, 15(3): 185-193. https://doi.org/10.3354/cr015185
[3] Andrey, J., Mills, B., Leahy, M., Suggett, J. (2003). Weather as a chronic hazard for road transportation in Canadian cities. Natural hazards, 28: 319-343. https://doi.org/10.1023/A:1022934225431
[4] Usman, T., Fu, L., Miranda-Moreno, L.F. (2010). Quantifying the safety benefit of winter road maintenance: Accident frequency modeling. Accident Analysis & Prevention, 42(6): 1878-1887. https://doi.org/10.1016/j.aap.2010.05.008
[5] Yannis, G., Karlaftis, M.G. (2010). Weather effects on daily traffic accidents and fatalities: A time series count data approach. Proceedings of the 89th Annual Meeting of the Transportation Research Board, 10: 14.
[6] Andersson, A.K., Chapman, L. (2011). The impact of climate change on winter road maintenance and traffic accidents in West Midlands, UK. Accident Analysis & Prevention, 43(1): 284-289. https://doi.org/10.1016/j.aap.2010.08.025
[7] Theofilatos, A., Yannis, G. (2014). A review of the effect of traffic and weather characteristics on road safety. Accident Analysis & Prevention, 72: 244-256. https://doi.org/10.1016/j.aap.2014.06.017
[8] Perrels, A., Votsis, A., Nurmi, V., Pilli-Sihvola, K. (2015). Weather conditions, weather information, and car crashes. ISPRS International Journal of Geo-Information, 4(4): 2681-2703. https://doi.org/10.3390/ijgi4042681
[9] Black, A.W., Mote, T.L. (2015). Effects of winter precipitation on automobile collisions, injuries, and fatalities in the United States. Journal of Transport Geography, 48: 165-175. https://doi.org/10.1016/j.jtrangeo.2015.09.007
[10] Heqimi, G., Gates, T.J., Kay, J.J. (2018). Using spatial interpolation to determine impacts of annual snowfall on traffic crashes for limited-access freeway segments. Accident Analysis & Prevention, 121: 202-212. https://doi.org/10.1016/j.aap.2018.09.014
[11] Casselgren, J., Rosendahl, S., Sjödahl, M., Jonsson, P. (2016). Road condition analysis using NIR illumination and compensating for surrounding light. Optics and Lasers in Engineering, 77: 175-182. https://doi.org/10.1016/j.optlaseng.2015.08.002
[12] Diaby, I., Germain, M., Goïta, K. (2021). Evidential data fusion for characterization of pavement surface conditions during winter using a multi-sensor approach. Sensors, 21(24): 8218. https://doi.org/10.3390/s21248218
[13] Hong, S.B., Yun, H.S., Yum, S.G., Ryu, S.Y., Jeong, I.S., Kim, J. (2022). Development of a black ice prediction model using GIS-based multi-sensor model validation. Natural Hazards and Earth System Sciences, 22(10): 3435-3459. https://doi.org/10.5194/nhess-22-3435-2022
[14] DiLorenzo, T., Yu, X. (2023). Use of ice detection sensors for improving winter road safety. Accident Analysis & Prevention, 191: 107197. https://doi.org/10.1016/j.aap.2023.107197
[15] Jiang, J., Xu, G., Wang, H., Yang, Z., Sun, B., Guan, C., Feng, J., Ma, Y., Chen, X. (2024). High-accuracy road surface condition detection through multi-sensor information fusion based on WOA-BP neural network. Sensors and Actuators A: Physical, 378: 115829. https://doi.org/10.1016/j.sna.2024.115829
[16] Zhang, J. (2024). Case study of road weather information systems: Vehicle sensor integration for accurate winter road condition estimation. Master Thesis, Department of Civil and Environmental Engineering, University of Alberta. https://doi.org/10.7939/r3-h58x-ct46
[17] Trafikverket. (2024). Testsite E18 – en vägforskningsstation. https://bransch.trafikverket.se/for-dig-i-branschen/forskning-och-innovation/aktuell-forskning/transport-pa-vag/testsite-e18--en-vagforskningsstation/.
[18] Gustafsson, M., Blomqvist, G., Janhäll, S. (2015). Mätning av luftkvalitet vid TestSite E18. Statens väg-och transportforskningsinstitut.
[19] Nordic Road And Transport Research. (2016). Research station with a focus on the environment. https://nordicroads.com/research-station-with-a-focus-on-the-environment/.
[20] Timeanddate. (2024). Climate & weather averages in Enköping. https://www.timeanddate.com/weather/@8131807/climate.
[21] Extreme Weather Watch. (2020). Västerås average temperature by month. https://www.extremeweatherwatch.com/cities/vasteras/average-temperature-by-month.
[22] Vaisala. (2020). Road sensor DRS 511. https://www.vaisala.com/sites/default/files/documents/WEA-GT-ProductSpotlight-DRS511-B212248EN-A.pdf.
[23] Vaisala. (2024). Remote road surface temperature sensor DSC. https://www.vaisala.com/sites/default/files/documents/WEA-RDS-ProductSpotlight-DSCDST-B212062EN.pdf.
[24] National Weather Service. (2013). What is the difference between sleet, freezing rain, and snow. https://www.weather.gov/iwx/sleetvsfreezingrain.
[25] Transport Styrelsen. (2024). Olycksstatistik vägtrafik. https://www.transportstyrelsen.se/sv/om-oss/statistik-och-analys/statistik-inom-vagtrafik/olycksstatistik/.