Zainab A. Abbas![]() | Zahraa M. Hilal*
| Zahraa M. Hilal*![]() | Hanan G. Jabbar
| Hanan G. Jabbar![]()
© 2025 The authors. This article is published by IIETA and is licensed under the CC BY 4.0 license (http://creativecommons.org/licenses/by/4.0/).
OPEN ACCESS
Advancements in networking and communication technologies have significantly boosted digital advertising, with global spending expected to reach \$646 billion by 2024, including \$495 billion from mobile internet. However, this growth is hindered by the persistent issue of click fraud, which leads to substantial financial losses and distorts advertising metrics. This study presents a comprehensive comparative analysis of multiple machine learning (ML) models including Random Forest, LightGBM, XGBoost, AdaBoost, Decision Tree, Gradient Boosting, and Multi-Layer Perceptron (MLP), for detecting click fraud in online advertising. A key novelty of this work lies in the integration of the LIME (Local Interpretable Model-agnostic Explanations) framework, which enhances transparency by interpreting the decision-making process of complex models. Through extensive data preprocessing and model evaluation using metrics such as accuracy, precision, recall, and F1-score, the Random Forest model achieved the highest accuracy of 95%, demonstrating robustness and generalization across different scenarios. Unlike prior studies, this research emphasizes model interpretability and trustworthiness, providing actionable insights for advertisers and platform designers. Comparative analysis with existing literature further highlights the methodological effectiveness and practical relevance of the proposed approach.
internet advertising, click fraud detection, machine learning models, random forest, LIME interpretability
Internet in the twentieth century and more development in networking and communication technologies together with the worldwide use of cell phones was a major boost to Internet based businesses especially in advertising, where there was great development in the digital advertising business during the same century [1]. Having evolved at an exponential rate, it stands at the pinnacle of the advertising domain, and it is expected to generate 646 US dollars by 2024, out of which mobile internet advertising alone is estimated to be 495 US dollars [2]. It is possible to argue that the largest advantage of the Internet to the advertising industry is to garner detailed and specific data about the customers’ information that they share on social networks or with cookies on their browsers. This capability enables a range of organisations to target individuals on the web concerning advertisements in real time. The few categories of Internet advertising include narrative advertising, social media advertising, content advertising, E-mail advertising, and pay-per-click Ads [3-5]. Web access through smartphones and tablets, and, more recently, the push to the IoT market, has brought about a change in the course of online advertising, where adverts are placed within the content of the actual application. This makes the Ads – more targeted with respect to the user interests, activity and behaviors including the past purchase [6-8]. The concept of the web advertisement is that the publishers – the authors of content or providers of services – promote their offer directly to the end-users through sites or applications that are free for users. Most of the income generated by the publishers originate from advertising where advertisers pay publishers for placements within their web site or an application with the intention of presenting content that will entice users to click for more details or to navigate to the advertised WEB page with a view to making a purchase.
However, we will now turn to another of the DPI’s key subjects, one that has already been mentioned – the advertising network. The advertisers and the publishers are connected by advertising networks and these are segmented so as to include some of the biggest players in advertising such as Google, Facebook amongst others. They act on the advertisement orders and corresponding payments they get from the advertisers and take orders from the publishers and do the publishing payments. Today, there are many advertising network companies mainly operates as a mediator between the publish and the advertisers, getting commission from the publisher’s revenue. Some of the Internet advertising billing models are associated with the displays, user interactions, and sales elicited by the adverts [9, 10].
Another frequently applied billing model associated with Internet advertising is Pay-Per-Click, which means that the payments are made depending on the frequency of Internet users’ clicks on the advertisements or banners with links to the advertisers’ content [11]. However, this model is also vulnerable to a particular species of cheating affectionately called ‘click fraud.’ Click fraud refers to the act of clicking on specific Ads by sore losers or bitter rivals with the intention of making more money for the publishers or cutting down on marketing costs for the advertisers without any intention of patronizing the goods or services being marketed. It applies to the various forms of paid media on the Internet, including advertisements, links, searches, and promotions in applications and platforms.
By the end of 2023, it is projected that approximately 17% of clickthroughs originating from desktop and PC platforms will be invalid, failing to yield a meaningful return on ad spend (ROAS). Although the volume of legitimate clicks is expected to grow from 160 billion in 2023 to nearly 235 billion by 2028, the occurrence of fraudulent clickthroughs is also forecasted to increase significantly—from 37 billion to over 65 billion within the same period. This escalation is largely attributed to the proliferation and sophistication of malicious bots, prompting a substantial body of research aimed at identifying the root causes of such deceptive interactions and developing mechanisms to detect and predict them [10].
Artificial intelligence (AI) models are increasingly employed to assess whether an advertisement is clicked by a genuine user or a bot, with the objective of differentiating authentic engagements from fraudulent ones. Click fraud is often executed through automated systems that emulate human behavior on digital platforms. These bots manipulate advertising metrics by repeatedly clicking on Ads, creating the illusion of legitimate user interest [12]. Although patterns such as multiple clicks from a single device can raise suspicion and trigger detection by Ad networks, cybercriminals have adapted by using virtual private networks (VPNs) to route bot activity through dynamically shifting IP addresses. In addition, the use of distributed devices across various geographical locations further complicates detection, enabling the generation of click traffic at varying volumes and from seemingly diverse sources [13].
Advancements in AI and their application to cybersecurity have facilitated the development of numerous detection systems within advertising networks. However, attackers have concurrently evolved their techniques, employing behavior that closely mimics that of legitimate users to evade detection. As a result, the need for more resilient, adaptive, and intelligent solutions to combat click fraud has become increasingly critical.
The primary objective of this study is to develop and evaluate a set of machine learning models to accurately detect and classify user behavior in online advertising, specifically to distinguish between legitimate web visitors and fraudulent bot-generated clicks. Given the escalating sophistication of click fraud and its financial implications for advertisers, the study focuses on employing and comparing multiple supervised learning algorithms—namely, Extra Trees, Random Forest, Decision Tree, XGBoost, Gradient Boosting, AdaBoost, LightGBM, and Multi-Layer Perceptron (MLP). A key innovation of this research lies in the integration of the Local Interpretable Model-agnostic Explanations (LIME) technique to enhance model interpretability. While many high-performing models operate as "black boxes," LIME enables instance-level explanation of predictions, thereby improving the transparency and trustworthiness of AI systems deployed in sensitive applications such as click fraud detection.
Main contributions of the study are:
The remainder of this paper is structured as follows: Section 2 provides a review of related literature on click fraud detection and the application of machine learning techniques. Section 3 details the dataset, exploratory analysis, preprocessing steps, and the machine learning models implemented. Section 4 presents the experimental results, evaluates model performance using key metrics, and discusses model interpretability through the LIME framework, along with a comparative analysis with existing studies. Finally, Section 5 concludes the study and outlines future directions to enhance the effectiveness and applicability of click fraud detection systems.
Incorporation of other intelligent approaches like ML or DL in the detection of one form of attack or the other is still relatively new and emerging [14-17]. Something that is discussed a lot in the current literature is click fraud, and one of the primary areas in this field is the application of ML and DL to detect it. Numerous researchers have examined large and genuine click fraud datasets, frequently using the specifics of access to an advertising campaign. Usually, these studies employ elementary ML classifiers to analyse the effectiveness of single ML and DL models comparatively.
For example, Mouawi et al. [18] proposed several classifiers, including both ML and DL, for the detection of fraudulent publishers with high click fraud rates in mobile advertising. They used SVM, KNN and ANN models, reflecting click details and user information from the advertising network and the advertisers to track the callous click behaviour. They employed synthetic Ad traffic with 500 000 requests and 1’000 publishers each, from where they extracted features such as the percentage of suspicious clicks, click duration, total number of clicks, the number of distinct IP, obtained app downloads and the distribution of click frequency. The K Nearest Neighbors attained the highest accuracy of 98 percent. In the same way, other researchers [19] employed FDMA 2012, an open-source data set for fraud detection in mobile advertising using SVM, together with RF, Naïve Bayes and Decision Tree (DT). Oversampling of the positive’s instances and undersampling of the negative instances yielded considerable improvement with a nice accuracy of 91% for RF algorithm on the balanced, severely imbalanced dataset.
do Espírito Santo [20] proposed a machine learning-based approach to detect click fraud in Google Ads, using five models: Support Vector Machines, Random Forest, K-Nearest Neighbors, Gradient Tree Boosting (GTB), and XGBoost, following the CRISP-DM methodology. Their findings highlighted the superior performance of tree-based models—particularly GTB and XGBoost. The study also identified key fraud indicators such as click frequency per IP and user ID, offering practical insights for marketing agencies. A notable strength is the collaboration with an industry partner, which grounds the research in real-world applications and enhances its relevance for combating click fraud in digital advertising.
Mahesh et al. [21] developed machine learning models to distinguish between human users and bots, addressing the growing concern of click fraud—an intentional act to inflate Ad clicks and harm advertisers. By applying AI techniques, the study conducted a comparative performance analysis across multiple models, demonstrating the effectiveness of machine learning in enhancing cybersecurity within digital advertising.
Thejas et al. [22] proposed a supervised learning model named CFXGB, which combines Cascaded Forest and XGBoost for effective click fraud detection. Aimed at helping advertisers combat fraudulent clicks, the model integrates feature transformation and classification, and demonstrates superior performance across multiple datasets of varying sizes when compared to existing approaches.
Alzahrani et al. [23] proposed a robust click fraud detection approach using advanced feature engineering and a comparative analysis of nine ML and DL models. After applying Recursive Feature Elimination, tree-based models like Decision Tree, Random Forest, Gradient Boosting, LightGBM, and XGBoost achieved over 98.9% accuracy. Deep learning models, especially RNNs, also showed strong performance. The study highlights the effectiveness of both traditional and deep learning techniques in identifying fraudulent clicks with high precision, offering valuable direction for future anti-fraud strategies in digital advertising.
Aljabri and Mohammad [24] proposed a machine learning-based approach to detect click fraud by distinguishing between human users and bots. Using a real-world dataset of user browsing behavior—such as session duration, page views, and actions—they evaluated multiple ML models. The Random Forest algorithm outperformed others across all metrics, highlighting its effectiveness in identifying fraudulent activity within the pay-per-click advertising model.
Batool and Byun [25] proposed a hybrid ensemble model combining CNN, BiLSTM, and Random Forest to detect click fraud in online advertising. The deep learning components automatically extract hidden features from click data, while Random Forest handles classification. A preprocessing module addresses categorical variables and data imbalance. Experimental results demonstrated high performance, with the model achieving over 99% accuracy, precision, and F1-score outperforming both standalone and other ensemble models.
Batool et al. [26] proposed an ensemble model combining CNN, BiLSTM, and Random Forest to enhance click fraud detection. The deep learning components extract spatial and temporal features, which the RF model then classifies. This hybrid approach reduces the need for manual feature engineering and outperforms traditional ML models, achieving 99.19% accuracy along with high precision, recall, and F1-score. The study presents a scalable and efficient framework adaptable to real-world applications.
Minastireanu, and Mesnita [27] proposed a LightGBM-based fraud detection approach to address the growing risks of click fraud in online advertising. Using a dataset of 200 million clicks collected over four days, the study focused on identifying suspicious IP addresses that generate high click volumes without resulting in app installations. The LightGBM algorithm, a gradient-boosting decision tree model, achieved 98% accuracy in detecting fraudulent behavior. The study highlights the importance of machine learning in enhancing traffic filtering and demonstrates the practical relevance of advanced algorithms in real-world advertising scenarios.
Thejas et al. [28] proposed a deep learning-based approach to tackle the growing threat of click fraud in mobile in-app advertising. The hybrid model combines Artificial Neural Networks (ANN), autoencoders, and a semi-supervised Generative Adversarial Network (GAN) to detect fraudulent clicks, even in adversarial settings where attackers attempt to mislead the detection system. Their approach addresses the limitations in current literature and demonstrates superior accuracy compared to existing models, particularly in handling smart, evolving attack strategies.
While existing studies have made significant progress in click fraud detection using machine learning (ML) and deep learning (DL) models, several limitations remain. Most of the prior works, such as those by Mouawi et al. and do Espírito Santo, focus primarily on single or basic ensemble classifiers without fully addressing the interpretability of these models, which is critical for understanding and trusting automated decisions in sensitive domains like advertising. Other approaches, including those using CNN and BiLSTM, achieve high accuracy but often require complex feature engineering or lack transparency in decision-making. Moreover, several studies rely on synthetic or limited datasets, reducing generalizability to real-world conditions. While models like CFXGB and ensemble architectures demonstrate strong performance, they tend to emphasize prediction power over explainability and practical deployment insights. In contrast, our proposed model not only achieves high detection performance using multiple ML algorithms but also integrates explainable AI through the LIME framework. This integration provides clear, instance-level interpretations of predictions, making the model both robust and transparent. Additionally, the comprehensive preprocessing pipeline and evaluation on real behavioral data ensure greater applicability to real-world digital advertising platforms, addressing both technical performance and practical deployment challenges overlooked in previous studies.
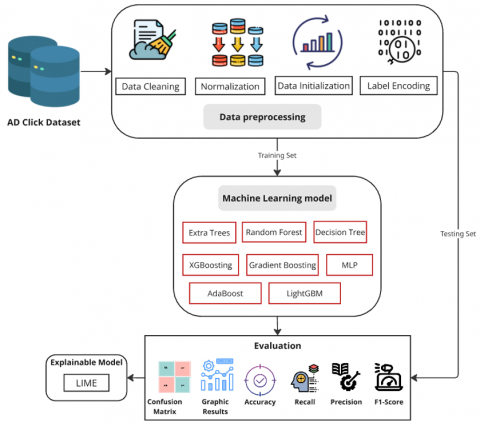
The proposed methodology for detecting click fraud involves several key stages, Including data cleaning, feature selection, data mining, model construction, model selection, model assessment, and post-processing and visualization. The first step is going through the process of data loading, where the Ad Click Dataset is loaded, followed by the preprocessing step, which involves several phases aimed at preparing the data. Some of the pre-processing steps include data cleaning for handling missing and wrong data values, the normalization of the data, data initialization to put the data into a more suitable form, and label encoding for converting categorical data into numerical data.
After preprocessing, several models of machine learning for click fraud detection are trained. Some of the models that are applied in this methodology comprises include Extra Trees, Random Forest, Decision Tree, XGBoost, Gradient Boosting, Neural Network (MLP), AdaBoosting, and Light GBM. Every model is learned with the processed dataset, and the results are assessed regarding accuracy, recall, precision, and F1-score. The evaluation stage involves creating confusion matrices, graphical results, and other performed performances to determine the effectiveness of the model.
To increase the model's interpretability, explainable AI approaches are used [29-31]. They make use of the models and gain an understanding of how they come up with their predictions on the outcomes of a certain decision. In the following subsection, we will provide more details about each of these steps; here, we will describe in detail how data preprocessing has been carried out, what machine learning models have been chosen and which evaluation metrics is used to compare them. This research will give a deeper insight of the methodology to be used and its efficiency in identifying click fraud.
3.1 Dataset overview
The type of data employed for this paper is the Ad Click Data, which includes one thousand and ten records in a tabular format. Every record corresponds to a given user and his or her activities concerning web advertisements (see Figure 1). The quantitative data encompasses a number of different characteristics within the set that describe the user’s activity and profile. This dataset is open-source and publicly available on the Kaggle platform (https://www.kaggle.com/c/talkingdata-adtracking-fraud-detection/data), making it a reliable benchmark frequently used in similar research studies. It was collected through user interaction logs with online Ads and includes essential features such as session behavior, demographic attributes, and Ad engagement outcomes. Although the exact collection time range is not specified, its structure and content are representative of typical user interaction patterns on digital advertising platforms, thereby justifying its relevance and suitability for the purpose of evaluating click fraud detection models (see Table 1).
The ‘Daily Time spent on Site’ will explain the time used by the user to access the site per day. Age indicates the age of the user or customer, and ‘Area income’ displays the average income of the user or customer's geographical area. ‘Daily Internet Usage’ quantifies the frequency of use of the internet within a day.
‘Ad Topic Line’ contains the topic of the Advertisement with which the user has interacted and ‘City’ represents the city of the user. ‘Male’ is a dummy variable signifying gender of the user as female, the value for this variable is 0 while the value of the variable ‘male’ is 1. ’Country’ is the user’s country of residence.
The ‘Timestamp’ field stores the time the user made the actual click through the respective advertisement. Last, ‘Clicked on Ad’ is the dependent variable, which is equal to one if the user clicks on the advertisement otherwise, it is zero. This dataset enables the study of factors affecting the potential click-through in advertisements so as to build models to identify click fraud.
Figure 1. Proposed approach for detecting and predicting Ad click
Table 1. Dataset description
|
Feature |
Description |
|
Daily Time Spent on Site |
Amount of time a user spends on the website each day |
|
Age |
Age of the user |
|
Area Income |
Income level of the user's geographical area |
|
Daily Internet Usage |
User's daily internet consumption |
|
Ad Topic Line |
Subject line of the advertisement |
|
City |
City where the user is located |
|
Male |
Gender of the user (0 for female, 1 for male) |
|
Country |
Country of residence of the user |
|
Timestamp |
Date and time of the advertisement click |
|
Clicked on Ad |
Indicates if the user clicked on the Ad (1 for yes, 0 for no) |
3.2 Exploratory data analysis
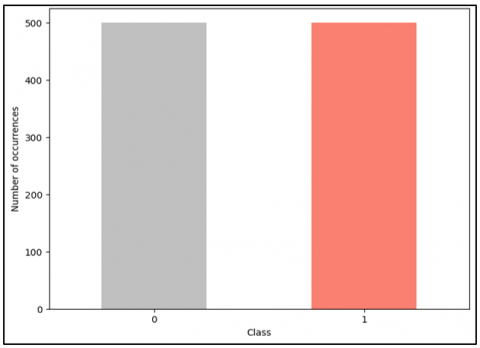
The exploratory data analysis (EDA) [32-34] of the Ad Click Dataset begins by examining the distribution of the target variable, "Clicked on Ad".
Figure 2. Distribution of classes in the "Clicked on Ad" column
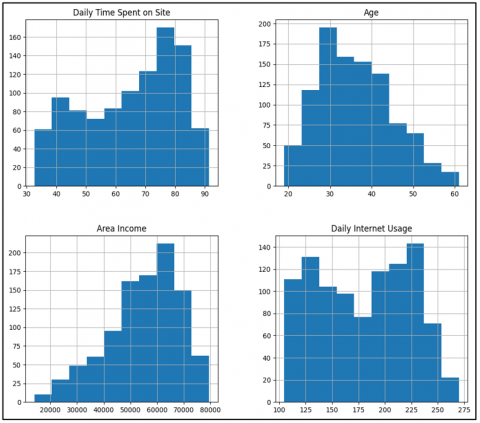
Figure 3. Histograms for four continuous features
Figure 2 presents a bar chart showing the distribution of the two classes within this column. The chart indicates that the dataset is relatively balanced, with an almost equal number of occurrences for both classes (clicked and not clicked). This balance is crucial for ensuring that the models trained on this data do not favor one class over the other.
Histograms for four continuous features - Daily Time Spent on Site, Age, Area Income and Daily Internet Usage - are shown in Figure 3.
These histograms provide information about the distribution and range of those variables.
For example, in the 'Daily Time Spent on Site' histogram, there is a peak for people using between 70 to 90 minutes of their 24-hour site. In the 'Age' histogram, most users are between 25 and 35.
The 'Area Income' histogram tells us that a high proportion of users have incomes between /$50,000 and /$70,000. The 'Daily Internet Usage' histogram reveals many users who are online between 150 and 250 hours every day.
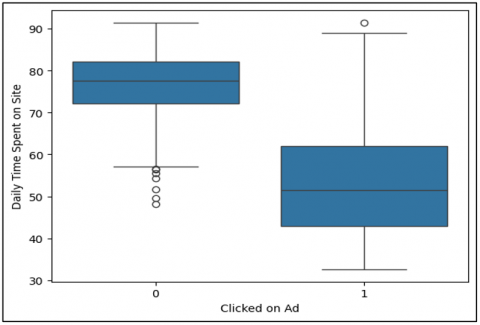
Figure 4. Box plot features
Figure 4 shows a box plot comparing "Daily Time Spent on Site" with the "Clicked on Ad" variable. This visualisation makes clear and how much different the time spent on site between which users clicked Ads as opposed (or not) is. Users who didn't click on Ads generally spent more time on the site, with fewer outliers. In contrast, those who clicked Ads showed a greater variance in times from short to long and at the extremes, there were also very long outlier cases.
Figure 5. Bar chart comparison
In Figure 5, we can see a bar chart. This chart compares the gender of users ("Male") as well as if they performed Ad-clicking during any period ('Clicked on Ad'). According to the chart, both male and female users have about the same likelihood of clicking on Ads. In terms of counts, races differ somewhat, but overall, they're about equal in terms of outcomes This kind of analysis could be used to learn about any gender-related differences in Ad-clicking habits.
Finally, Figure 6 shows a correlation matrix of key numerical features [35-37], from which we can see that daily time spent on site is inversely related to clicking an Add. The heatmap visually shows the correlation coefficients between these variables. On the other hand, 'Daily Time Spent on Site' has a strong negative correlation with 'Clicked on Ad', showing that as our internet usage and hence visits to such sites increases, particularly later in the day or before bed, the likelihood of clicking on Ads decreases markedly. Similarly, 'Daily Internet Usage' is found to have similar trends as we browse through news or other content before ending our day. Not surprisingly, there is a good reason why "Clicked on Ad" shows a negative correlation with these behaviors. On the other hand, 'Age' has a negative correlation with 'Clicked on Add', indicating that the older we are according to this model, the less likely we are to click on an Ad.
Figure 6. Correlation matrix
3.3 Data preprocessing
In the Ad Click Dataset's "preprocessing" phase there are many important steps to transform the data for modeling. First, scan the dataset for any missing values. This is critical, for the absence or cancellation of values will make data analysis fail and can also produce unreliable models. Thus, all records with missing values are dropped.
Then, the 'Timestamp' column, which includes not only the date but also the time of day when the user clicks on an Ad, is converted to datetime data type so that it can be processed. Out of this datetime format, there are new features as year, month, day, hour, and minute. This step enriches the dataset, giving it a temporal direction that turns out to matter when deciding on future policies for e-commerce companies, generally or specific products especially.
Techniques called one-hot encoding can be employed to encode categorical variables such as 'City,' 'Country,' and 'Ad Topic Line.' This method transforms these categorical variables into a format that ML algorithms will understand and respond better to. Each unique category value is transformed into a new column, which is assigned a binary value of 0 or 1 indicating whether it is present in this case.
For our numerical features to be on the same scale, normalization is needed. The numerical features in this data set are 'Daily Time Spent on Site,' 'Age,' and 'Area Income'. Standardization is the most frequently used normalization technique here, in which all values are rescaled for distribution with a mean of zero and standard deviation one. The formula for standardization is:
$Z=\frac{X-\mu}{\sigma}$ (1)
where, $(Z)$ is the standardized value, $(X)$ is the original value, $(\mu)$ is the mean of the feature, and $(\sigma)$ is the standard deviation of the feature.
Following these, the ‘Timestamp’ column, which was used earlier, cannot be used anymore and thus has been removed. The last part of preprocessing is featuring extraction where a dataset of features is segmented from the response variable. The features are all the columns that will be utilized in the calculation of the model and the target feature is the ‘Clicked on Ad,’ which is 1 if a user clicks an advertisement.
Hence, when the above preprocessing steps are done, the dataset is put into proper format for the subsequent Machine Learning model training. Such preparation helps to feed the models with the data that has been normalised, encoded, and checked for any missing data, which will yield better prognosis results.
3.4 Machine learning methods
The various methods used in learning machines in this study are intended to measure how likely a particular user is to click an advert [38-42]. The first step involves the division of the data to permit the evaluation of the models, and the division is carried out by training and testing data. This division does not allow models to be trained on one part of the dataset, and it tests the model on another part of the exact same set in order to give a fair evaluation of the performance of the models [43-45].
In this context, several machine learning models are chosen to perform this task, where all of them have different features. Other models include Extra Trees [46], Random Forest [47], Decisions Trees [48], XG Boost [49], Gradient Boost [50], Artificial Neural Networks which includes Multi-layer Perception [51], Ada Boost [52], and Light GBM [53]. In order to train each of the models, the training dataset is used, while the testing dataset is used to check the accuracy of the models. The training process entails putting the training data to the models and the models learning the patterns that are characteristic of the users who click on the Ads and those who do not.
The rationale behind selecting these specific models lies in their proven empirical effectiveness in classification tasks, especially for tabular datasets. Tree-based models like Decision Tree, Random Forests, and Extra Trees are widely used due to their ability to capture non-linear relationships and handle both numerical and categorical data without extensive preprocessing. Ensemble methods such as Random Forest, Extra Trees, Gradient Boosting, XGBoost, LightGBM, and AdaBoost are known for improving generalization and reducing overfitting by combining the strengths of multiple base learners. Extra Trees was specifically included for its ability to reduce variance through randomization, providing a fast and robust alternative to traditional ensembles. XGBoost and LightGBM were selected for their superior speed and accuracy in large-scale data and their use of advanced regularization techniques. MLP, representing neural networks, was added to evaluate performance on non-linear relationships beyond tree-based structures.
Once the models are trained, their performance is measured using several metrics: Accuracy, recall, precision, F1-score, and error rate. Accuracy judgments the general correctness of the model, Recall measures the ability of the model to identify actual positives, Precision checks the proportion of positive that were correctly predicted, and F1 is a harmonic mean of both Recall and Precision. The error rate also refers to the proportion of the total number of instances that were incorrectly classified by the model and is calculated by one minus the accuracy of the model.
Confusion matrices are created for each of the models in this study to give intricate details of how well they perform. These matrices show true positives, true negatives, false positives, and false negatives: such a description provides information about the kinds of errors committed by the models [54-57]. Furthermore, classification reports are generated to highlight the accuracy, sensitivity, and specificity of each class, along with the F1 measures.
The results were put into a data frame and sorted, in both cases, by the accuracy of the model. In this way, the best models are extracted. This exhaustive study permits the comparison of various models. The advantages and disadvantages that they have in estimating whether a particular Ad will or will not get clicked are exposed one by one. By looking at the statistics in this fashion, valuable insight may be obtained into which models are the most effective for this specific task and what kind of decisions can be made about using them in practice. During this process, the time taken to train each model is recorded, which produces a conclusion about which algorithm has greater computational efficiency. Such feedback is valuable for knowing the trade-off between model performance and training time, particularly when deploying models in real world scenarios where data resources and time may be limited. In short, the machine learning methods segment comprehensively introduces training and evaluation in terms of various models in a framework to forecast Ad hits that is robust. By employing multiple metrics and in-depth analyses, a full appraisal of model performance is offered, thus helping to determine which algorithms are most suitable for this task and what lessons we can learn from them.
3.5 Detection with lime
The last part of the analysis involves perturbations of the data and then an examination of how the model's behaviour changes. Furrnoosh a note is printed indicating that since there are no features with exactly opposite correlations (although the correlation might approach zero), there can be no features to be used for predictive inference. In this sense, we fail to validate Furrn. Exhaustively searching for a set of features with Vapor (an R package) that works well in practice as basic functions for predicting the output can take a great deal of time. This part of the analysis is therefore only done once to find a good set of order two features on which Vapour uses as fixed points when making predictions. The step is essential for understanding how the model makes decisions. This is especially true in complex models such as random forests because they operate as "black boxes".
First, the data is preprocessed. This includes treatment for missing values and says whether features other than hours or minutes should be drawn from the 'Timestamp' column, such as year, month, day, hour, and minute. In this preprocessing, categorical variables are encoded and numerical features are normalized so that all data is on a comparable scale. After preprocessing, the data is split into training and testing sets. This helps the model in training and leads to its subsequent evaluation. A Random Forest classifier is trained on the training data. Models of Random Forests are chosen for their robustness and for their ability to handle large data sets with high dimensionality. After training, the model's performance is then evaluated on the testing data, checking that it can generalize well to new, unseen data.
To understand the model's predictions, we use the explanation framework of LIME. LIME enables explanations for individual predictions, making it much easier to understand how the model makes its decisions. The LIME explainer is set up based on the training data. You provide the names of the features used in learning and the class names in order to make explanations clear.
The Prediction function for the Random Forest Model is now defined, which returns the probability of each class for a given instance. An instance from the testing data must be chosen to be explained. This instance is reshaped so that it is suitable to the input requirements of the model.
LIME generates an explanation for the particular instance that has been selected by perturbing the data and observing how that changes the model's predictions. It creates a locally faithful but comprehensible model around the instance, which approximates the behaviour of Random Forest. The explanation draws attention to the most influential features contributing to its prediction.
By displaying the true label and predicted label the interpretation provided here exemplifies what each of the features is contributing. This makes us understand why the model has come to that particular judgment.
Transparency is needed in order for a model's decisions to be valid and trustworthy; this is especially crucial for any application with implications. We need to be able to understand and verify why the model made each recommendation. It explains the nature of interpretability.
This process of generating local explanations using LIME can be repeated for different instances so as to give a better overall understanding of how the model behaves across different environments. In this way, any biases or inconsistencies that might exist in the model can be found, improvements can be made, and the model's reliability is guaranteed. LIME is integrated with the machine learning workflow to achieve high accuracy on predictions. At the same time, its ability to explain these predictions renders them easy to accept and, hence, reliable. This consistently raises the overall quality of the model as applied in pragmatic terms.
In the LIME scheme for model interpretation, the main equation is to construct a locally interpretable model which represents the behaviour of a complex model (like Random Forest) in a certain instance. The general idea here is to train a simple, interpretable model (such as a linear regression) on the predictions of the complex model in the neighbourhood of the instance being explained. The key equation used in LIME:
$g\left(z^{\prime}\right)=\operatorname{argmin}_{g \in G} \sum_{z^{\prime} \in Z} \pi(x, z)\left(f(z)-g\left(z^{\prime}\right)\right)^2+\Omega(g)$ (2)
where,
This equation formalizes the process of fitting a simple model $(g)$ that minimizes the weighted squared loss between the predictions of the complex model $(f)$ and the simple model $(g)$ with the weights provided by the proximity measure $(\pi)$ and a regularization term to maintain interpretability. This locally interpretable model helps to understand the decision-making process of the complex model around the instance of interest.
4.1 Evaluation metrics
In the context of evaluating the performance of models, several key indicators are used to predict Ad clicks. Model correctness is measured by accuracy, which describes what proportion of instances are forecast correctly. Precision is concerned with correctly predicting only when the predictions are positive, i.e., it measures the share of actual true positive predictions among all predictions made by our model that entail some positive return. Recall is a method of assessing the model's ability to identify real cases that are positive; it shows the share of true positive occurrences among all actually positives. F1-score offers a balanced measure which makes trade-offs between both precision & recall, taking one single number and clasping bit by bit into its grasp the relationship between two qualities. Together, these criteria yield a comprehensive picture of how the model is performing; they show where it is strong and where it is weak. They provide suggestions for how to class whether a user will click an advertisement.
Accuracy $=\frac{T P+T N}{T P+T N+F P+F N}$ (3)
Precision $=\frac{T P}{T P+F P}$ (4)
Recall $=\frac{T P}{T P+F N}$ (5)
$F 1- Score =2 \times \frac{ { Precision } \times { Recall }}{ { Precision }+ { Recall }}$ (6)
4.2 Results analysis
The results analysis of the machine learning models used for predicting Ad clicks provides a comprehensive view of their performance across several key metrics (see Table 2).
Table 2. Performance metrics of various machine learning models for predicting Ad clicks
|
Model |
Accuracy |
Recall |
Precision |
F1-Score |
Error Rate |
Training Time (s) |
|
Random Forest |
0.950 |
0.954955 |
0.954955 |
0.954955 |
0.050 |
0.680866 |
|
LightGBM |
0.940 |
0.927928 |
0.962617 |
0.944954 |
0.060 |
0.226144 |
|
XGBoost |
0.935 |
0.936937 |
0.945455 |
0.941176 |
0.065 |
2.401439 |
|
AdaBoost |
0.930 |
0.918919 |
0.953271 |
0.935780 |
0.070 |
1.204592 |
|
Decision Tree |
0.925 |
0.927928 |
0.936364 |
0.932127 |
0.075 |
0.052635 |
|
Gradient Boosting |
0.920 |
0.927928 |
0.927928 |
0.927928 |
0.080 |
3.006249 |
|
MLP |
0.920 |
0.882883 |
0.970297 |
0.924528 |
0.080 |
24.867512 |
|
Extra Trees |
0.910 |
0.882883 |
0.951456 |
0.915888 |
0.090 |
1.095485 |
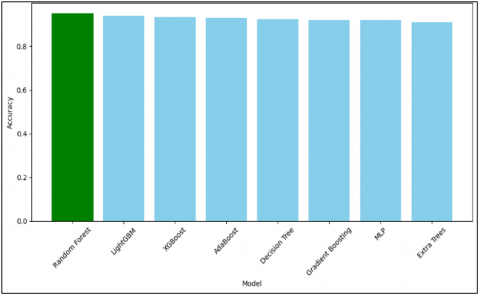
Figure 7. Accuracy of different models
With an accuracy of 0.950, the top-performing model is the Random Forest model. That means that this model makes correct predictions in 95% of instances.
And the performance of the Random Forest model adds more proof. It has the following numbers on record: recall 0.914945, precision 0.961832 and F1-score 0.937375. This is, in every possible way, an ideal combination so that neither component has too much influence over the other; from this perspective, we can say that it is both theoretically good and practical as well.
The model also had an error rate of 0.050, indicating this is an excellent model for predicting high accuracy while producing a few incorrect outputs. It took an average of 0.680866 seconds for this model to be trained. LightGBM also turned in a good performance. Its accuracy was 0.940, with a recall of 0.927928 and precision of 0.962617, yielding an F1-score of 0.944954. All this means LightGBM has a strong ability to identify positive instances while maintaining high precision.
The error rate for the LightGBM model was relatively low at 0.060, and it took only 0.226144 seconds to train. XGBoost also performed well, with an accuracy of 0.935, a recall of 0.936937, and a precision of 0.945455, giving an F1-score that falls in between all those numbers, 0.941176. It had a similar error rate to Random Forest and had the longest training time among models as well 2.401439 seconds.
So XGBoost, even though it is highly accurate, may require considerable time and computing resources for training. AdaBoost's accuracy is 0.930, and with a recall of 0.918919 and 0.953271 precision, it has a combined F1-score of 0.935780. The model's error rate was 0.070. Training took just over 1 second-1.204592 seconds in total. This model shows a good balance between precision and recall; however, it is slightly less accurate than Random Forest or LightGBM.
Taking the Decision Tree model as an example, we got an accuracy value of 0.925. The recall was 0.927928, and the precision was 0.936364, resulting in an F1-score of 0.932127. The error rate was 0.075; meanwhile, it was the best trained of all Fast models with a time cost of 0.052635 seconds only. Under these constraints, experimental performance is acceptable or probably even good enough for most applications; however, there remains a gap between satisfactory actual observed values and those predicted by the model itself.
Both Gradient Boosting and MLP also had an accuracy of 0.920. Gradient Boosting reached a recall of a precision of (E), and an F1-score, with an error rate 0.080. The training time for Gradient Boosting is reflected in the 3.006249-second value given above, perhaps because it takes longer to train this powerful model. On the other hand, MLP got a recall of 0.882883 and held its high precision when computing the results with an F1 point based on a measure of 0.924528. Its error rate was the same as that for the Gradient Boosting above, but training times were significantly longer: 24.867512 seconds in all, whilst still much more accurate than more complex models.
Among the several models compared in this paper, the Extra Trees model scored the lowest accuracy at 0.910. But it reached a recall of 0.882883, a precision of 0.951456 and finally an F1 value at. Meanwhile, the error rate for Extra Fast Trees was 0.090. The training time taken to fit this model was 1.095485 seconds. Nevertheless, it also gave higher precision than last time and still did not take entirely too long in terms of computational.
In Figure 7, a bar chart compares the prediction accuracy of different machine learning models for Ad clicks. The highest accuracy of all models, 0.950, is achieved by the Random Forest model, indicated in green. Other models such as LightGBM, XGBoost, AdaBoost, Decision Tree, Gradient Boosting, MLP and Extra Trees are not far behind, with all achieving accuracies in excess of 0.910. The chart also clearly shows that the best-performing model in terms of accuracy is the Random Forest model.
Table 3 presents the p-values, mean accuracy differences, and 95% confidence intervals (CIs) for each algorithm when compared to the top-performing model, Random Forest. The inclusion of statistical tests allows us to assess whether the observed differences in accuracy are due to chance or are statistically meaningful.
Table 3. Statistical significance test results for model accuracy comparisons
|
Model |
p-Value |
Mean Accuracy Difference |
Difference 95% CI Lower |
95% CI Upper |
|
Random Forest |
8.489296 × 10⁻¹ |
0.000485 |
-0.004464 |
0.005435 |
|
LightGBM |
2.275616 × 10⁻⁴ |
0.010272 |
0.005486 |
0.015058 |
|
XGBoost |
7.696120 × 10⁻⁸ |
0.016137 |
0.011697 |
0.020576 |
|
AdaBoost |
3.533821 × 10⁻⁴ |
0.010436 |
0.005380 |
0.015493 |
|
Decision Tree |
1.627355 × 10⁻¹² |
0.025796 |
0.021480 |
0.030113 |
|
Gradient Boosting |
1.125719 × 10⁻¹² |
0.034549 |
0.028855 |
0.040243 |
|
MLP |
2.808657 × 10⁻¹² |
0.029587 |
0.024522 |
0.034652 |
|
Extra Trees |
7.767351 × 10⁻¹⁹ |
0.041883 |
0.037890 |
0.045876 |
Figure 8. LIME visualization for Ad clicks prediction model
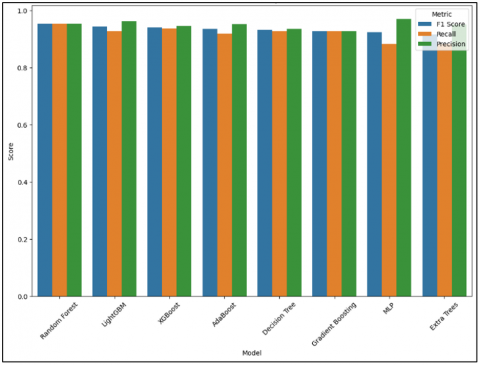
Figure 9. Model metrics comparison
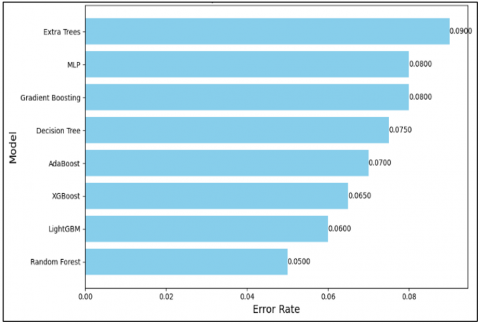
Figure 10. Comparison error rate
As shown in Table 3, the Random Forest model, which achieved the highest accuracy, serves as the baseline for comparison. Its p-value (0.8489) indicates that differences in mean accuracy compared to itself are not statistically significant, as expected. However, other models display varying degrees of significance. For instance, LightGBM and XGBoost exhibit p-values of 0.0002 and 0.00035, respectively, both well below the conventional alpha threshold of 0.05, indicating that their lower performance relative to Random Forest is statistically significant. Moreover, AdaBoost, Decision Tree, Gradient Boosting, MLP, and Extra Trees all have extremely low p-values (p < 0.001), confirming that their performance differences from Random Forest are also highly significant.
The confidence intervals further validate these findings: for example, AdaBoost shows a mean accuracy difference of 0.0161 with a 95% CI of [0.0117, 0.0206], while Extra Trees displays the largest discrepancy with a mean difference of 0.0419 and a CI of [0.0379, 0.0459]. Notably, none of the confidence intervals for the compared models include zero (except for Random Forest), reinforcing the robustness of Random Forest's superiority in classification accuracy.
These statistical validations add rigor to our evaluation and substantiate the claim that Random Forest consistently and significantly outperforms other models in detecting click fraud within our experimental setting.
On the grouped bar plot in Figure 8, you will see how classification accuracy, recall, and 'precision' scores compare for each machine learning model. Here, each model has three bars which represent this value under "Precision", "Recall", and F, as can be seen from the chart; while most models hold high scores across the board, half do not. Example By way of instance, a high precision value is shown on the LightGBM model when compared with recall or F1-score, which is slightly less than it (and unlike either measure). Compared with all other models, relatively speaking, the top precision score ranks the MLP model here. Still, the recall score is rather low compared to other models. By systematically comparing models across the board has three estel (see Figure 9) to recall and F1-score Eye-catching way to combine the results is a beehive chart for each one of them.
Comparison of error rates on 9 screens of different machine learning models: Random Forest has the lowest in 2013, only 0.050 as it enters the bar.LIGHTGBM next with an error rate reaching 0.060, while XGBoost third GrBoosting and MLP (Multi-layer perceptron) all have error rates above 0.065 and Extra Trees because it's higher than everyone else: 0.090 here from where we could see which model provides the lowest error rate is the QR model. The chart above also illustrates this.
Figure 10 presents a specific instance of the advertising click-through prediction model using area charts to tell its LIME (Local Interpretable Model-agnostic Explanations). The chart on the left is a display of prediction probabilities, telling us that this user is 17% likely not to click and 83% likely to yes click on an advertisement.
The middle section lists features which can influence prediction and their respective contributions with vivid segments of boxes shown in orange or blue, respectively. Orange boxes are added in red italics from my point of view, but please don't try telling Kelly that she should be doing this. Those who make a prediction for "Clicked", while shaded ribs indicate members credited to the "Not Clicked" strategy.
The "Ad Topic Line_ Switchable real-time product " and " City_East Shawnchester" features make significant positive contributions towards forming a click prediction, as indicated by the longer orange bars. On the other hand, features like" City_North Elizabeth "and" City_East Johnport" serve to predict a non-click action, as shown by blue shadowgraphs.
The rightmost section lists features and the values they hold on this particular instantiation. These values reflect data points used for prediction. Through this visualization, users can identify which characteristics are at play in driving the model's choice at this particular point in time, offering a clear account of how this model works.
4.3 Comparison with related work
Table 4 shows the comparisons of this paper’s work on Ad click prediction with several related works on click fraud detection using machine learning techniques. It presents the names of the published studies, the techniques used in the respective studies, the reported performance of the techniques in terms of accuracy, and other notes on the techniques used in the respective study and the results obtained.
For detection of click fraud, many algorithms such as Support Vector Machine (SVM) and Random Forest (RF) together with others like Naïve Bayes (NB) and Decision Tree (DT) have been used [9]. The authors obtained a correlation accuracy of 0. 910, of which the Random Forest algorithm outperforms the other one with the balanced data set.
Minastireanu et al. [27] were interested in employing LightGBM, a decision tree-based gradient boosting algorithm, for the identification of click fraud. He then used LightGBM for large data sets with feature engineering and feature selection in data preprocessing, reaching 0. 980.
A hybrid deep learning model consisting of a GAN Auto Encoder, and Neural Network was introduced by G. S. et al. [28] They controlled and balanced datasets by categorizing datasets based on IP addresses and app IDs and got an accuracy of 0. 897.
Our Work involved the employment of many algorithms in the category of machine learning, including AdaBoost, LightGBM, MLP, Random Forest, Decision Tree, XGBoost, and Gradient Boosting. From these, the highest accuracy of 0. 950. Random Forest was quite consistent even in the current evaluation as it closely performed in all those aspects in which it was evaluated, as evident from Figure 8, hence presenting itself as a sound model for predicting Ad clicks.
Table 4. Comparison of proposed work with related work on click fraud detection methods and accuracy
|
Ref. |
Methods Used |
Accuracy |
Notable Observations |
|
[9] |
SVM, RF, NB, DT |
0.910 |
RF showed superior performance with a balanced dataset. |
|
[21] |
LightGBM |
0.980 |
Applied LightGBM on a large dataset with feature engineering and selection. |
|
[24] |
Hybrid DL model (GAN, Auto Encoder, Neural Network) |
0.897 |
Managed data imbalance using classes based on IP addresses and app IDs. |
|
Proposed Work |
Random Forest, |
0.950 |
Our models were evaluated on various metrics, showing Random Forest with the highest accuracy and balanced performance across metrics. |
This study addressed the growing challenge of click fraud in digital advertising by evaluating and comparing multiple supervised machine learning models are Random Forest, LightGBM, XGBoost, AdaBoost, Decision Tree, Gradient Boosting, and Multi-Layer Perceptron (MLP). The primary objective was to identify models capable of distinguishing fraudulent clicks from legitimate ones with high accuracy while maintaining interpretability and computational efficiency.
Among the tested models, Random Forest demonstrated the best overall performance, achieving the highest accuracy of 95%, along with balanced precision, recall, and F1-score. Additionally, it exhibited reasonable training time, highlighting its potential for real-time or near real-time deployment. In contrast, although models like MLP and XGBoost also achieved high accuracy, their computational cost, particularly in terms of training time, was significantly higher, indicating a trade-off between model performance and computational efficiency. These findings directly address the research question of how to balance predictive power and resou
[1] Zhu, X., Tao, H., Wu, Z., Cao, J., Kalish, K., Kayne, J. (2017). Fraud preventi on in online digital advertising. NewYork: Springer International Publishing. https://doi.org/10.1007/978-3-319-56793-8
[2] Statista Research Department. Digital advertising spending worldwide from 2019 to 2024. 2021. https://www.statista.com/statistics/237974/online-advertising-spending-worldwide/, accessed on Aug. 7, 2024.
[3] Zenetti, G., Bijmolt, T.H., Leeflang, P.S., Klapper, D. (2014). Search engine advertising effectiveness in a multimedia campaign. International Journal of Electronic Commerce, 18(3): 7-38. https://doi.org/10.2753/JEC1086-4415180301
[4] Li, H., Yang, Y. (2020). Optimal keywords grouping in sponsored search advertising under uncertain environments. International Journal of Electronic Commerce, 24(1): 107-129. https://doi.org/10.1080/10864415.2019.1683704
[5] Pentina, I., Guilloux, V., Micu, A.C. (2018). Exploring social media engagement behaviors in the context of luxury brands. Journal of Advertising, 47(1): 55-69. https://doi.org/10.1080/00913367.2017.1405756
[6] Martins, J., Costa, C., Oliveira, T., Gonçalves, R., Branco, F. (2019). How smartphone advertising influences consumers' purchase intention. Journal of Business Research, 94: 378-387. https://doi.org/10.1016/j.jbusres.2017.12.047
[7] Smith, K.T. (2019). Mobile advertising to Digital Natives: Preferences on content, style, personalization, and functionality. Journal of Strategic Marketing, 27(1): 67-80. https://doi.org/10.1080/0965254X.2017.1384043
[8] Aksu, H., Babun, L., Conti, M., Tolomei, G., Uluagac, A.S. (2018). Advertising in the IoT era: Vision and challenges. IEEE Communications Magazine, 56(11): 138-144. https://doi.org/10.1109/MCOM.2017.1700871
[9] Li, Z., Jia, W. (2020). The study on preventing click fraud in internet advertising. Journal of Computers, 31(3): 256-265. https://doi.org/10.3966/199115992020063103020
[10] Sadeghpour, S., Vlajic, N. (2021). Ads and fraud: A comprehensive survey of fraud in online advertising. Journal of Cybersecurity and Privacy, 1(4): 804-832. https://doi.org/10.3390/jcp1040039
[11] Wood, A.K., Ravel, A.M. (2017). Fool me once: Regulating fake news and other online advertising. S. Cal. L. Rev., 91: 1223.
[12] Silva, S.S., Silva, R.M., Pinto, R.C., Salles, R.M. (2013). Botnets: A survey. Computer Networks, 57(2): 378-403. https://doi.org/10.1016/j.comnet.2012.07.021
[13] Stone-Gross, B., Stevens, R., Zarras, A., Kemmerer, R., Kruegel, C., Vigna, G. (2011). Understanding fraudulent activities in online Ad exchanges. In Proceedings of the 2011 ACM SIGCOMM Conference on Internet Measurement Conference, pp. 279-294. https://doi.org/10.1145/2068816.2068843
[14] Aljabri, M., Aljameel, S.S., Mohammad, R.M.A., Almotiri, S.H., Mirza, S., Anis, F.M., Aboulnour, M., Alomari, D.M., Alhamed, D.H., Altamimi, H.S. (2021). Intelligent techniques for detecting network attacks: Review and research directions. Sensors, 21(21): 7070. https://doi.org/10.3390/s21217070
[15] Aljabri, M., Alhaidari, F., Mohammad, R.M.A., Mirza, S., Alhamed, D.H., Altamimi, H.S., Chrouf, S.M.B. (2022). An assessment of lexical, network, and content-based features for detecting malicious URLs using machine learning and deep learning models. Computational Intelligence and Neuroscience, 2022(1): 3241216. https://doi.org/10.1155/2022/3241216
[16] Aljabri, M., Alahmadi, A.A., Mohammad, R.M.A., Aboulnour, M., Alomari, D.M., Almotiri, S.H. (2022). Classification of firewall log data using multiclass machine learning models. Electronics, 11(12): 1851. https://doi.org/10.3390/electronics11121851
[17] Aljabri, M., Altamimi, H.S., Albelali, S.A., Al-Harbi, M., Alhuraib, H.T., Alotaibi, N.K., Alahmadi, A.A., Alhaidari, F., Mohammad, R.M.A., Salah, K. (2022). Detecting malicious URLs using machine learning techniques: Review and research directions. IEEE Access, 10: 121395-121417. https://doi.org/10.1109/access.2022.3222307
[18] Mouawi, R., Awad, M., Chehab, A., El Hajj, I.H., Kayssi, A. (2018). Towards a machine learning approach for detecting click fraud in mobile advertizing. In 2018 International Conference on Innovations in Information Technology (IIT), Al Ain, United Arab Emirates, pp. 88-92. https://doi.org/10.1109/INNOVATIONS.2018.8605973
[19] Oentaryo, R., Lim, E.P., Finegold, M., et al. (2014). Detecting click fraud in online advertising: A data mining approach. The Journal of Machine Learning Research, 15(1): 99-140.
[20] do Espírito Santo, C.A. (2024). Advertisement click fraud detection and prevention: A machine learning approach. Master's thesis, Universidade NOVA de Lisboa (Portugal).
[21] Mahesh, V.B., Chandra, K.V.S., Babu, L.S.P., Sowjanya, V.A., Mohammed, M. (2024). Clicking fraud detection for online advertising using machine learning. In 2023 4th International Conference on Intelligent Technologies (CONIT), Bangalore, India, pp. 1-6. https://doi.org/10.1109/CONIT61985.2024.10627189
[22] Thejas, G.S., Dheeshjith, S., Iyengar, S.S., Sunitha, N.R., Badrinath, P. (2021). A hybrid and effective learning approach for click fraud detection. Machine Learning with Applications, 3: 100016. https://doi.org/10.1016/j.mlwa.2020.100016
[23] Alzahrani, R.A., Aljabri, M., Mohammad, R.M.A. (2025). Ad click fraud detection using machine learning and deep learning algorithms. IEEE Access, 13: 12746-12763. https://doi.org/10.1109/ACCESS.2025.3532200
[24] Aljabri, M., Mohammad, R.M.A. (2023). Click fraud detection for online advertising using machine learning. Egyptian Informatics Journal, 24(2): 341-350. https://doi.org/10.1016/j.eij.2023.05.006
[25] Batool, A., Byun, Y. C. (2022). An ensemble architecture based on deep learning model for click fraud detection in pay-per-click advertisement campaign. IEEE Access, 10, 113410-113426. https://doi.org/10.1109/ACCESS.2022.3211528
[26] Batool, A., Kim, J., Byun, Y.C. (2024). Enhanced click fraud detection in digital advertising through ensemble deep learning. In International Conference on Frontier Computing, Singapore, pp. 22-27. https://doi.org/10.1007/978-981-96-2395-2_5
[27] Minastireanu, E.A., Mesnita, G. (2019). Light GBM machine learning algorithm to online click fraud detection. Journal of Information Assurance & Cyber Security, 2019: 263928. https://doi.org/10.5171/2019.263928
[28] Thejas, G.S., Boroojeni, K.G., Chandna, K., Bhatia, I., Iyengar, S.S., Sunitha, N.R. (2019). Deep learning-based model to fight against Ad click fraud. In Proceedings of the 2019 ACM Southeast Conference, pp. 176-181. https://doi.org/10.1145/3299815.3314453
[29] Linardatos, P., Papastefanopoulos, V., Kotsiantis, S. (2020). Explainable AI: A review of machine learning interpretability methods. Entropy, 23(1): 18. https://doi.org/10.3390/e23010018
[30] Shah, V., Konda, S.R. (2021). Neural networks and explainable AI: Bridging the gap between models and interpretability. International Journal of Computer Science and Technology, 5(2): 163-176.
[31] Maruthi, S., Dodda, S.B., Yellu, R.R., Thuniki, P., Reddy, S.R.B. (2022). Language model interpretability-explainable AI methods: Exploring explainable AI methods for interpreting and explaining the decisions made by language models to enhance transparency and trustworthiness. Australian Journal of Machine Learning Research & Applications, 2(2): 1-9.
[32] Chatfield, C. (1986). Exploratory data analysis. European Journal of Operational Research, 23(1): 5-13. https://doi.org/10.1016/0377-2217(86)90209-2
[33] Behrens, J.T. (1997). Principles and procedures of exploratory data analysis. Psychological Methods, 2(2): 131-160. https://doi.org/10.1037/1082-989X.2.2.131
[34] Sahoo, K., Samal, A.K., Pramanik, J., Pani, S.K. (2019). Exploratory data analysis using Python. International Journal of Innovative Technology and Exploring Engineering, 8(12): 4727-4735. https://doi.org/10.35940/ijitee.L3591.1081219
[35] Graffelman, J., De Leeuw, J. (2023). Improved approximation and visualization of the correlation matrix. The American Statistician, 77(4): 432-442. https://doi.org/10.1080/00031305.2023.2186952
[36] Nesaragi, N., Patidar, S., Thangaraj, V. (2021). A correlation matrix-based tensor decomposition method for early prediction of sepsis from clinical data. Biocybernetics and Biomedical Engineering, 41(3): 1013-1024. https://doi.org/10.1016/j.bbe.2021.06.009
[37] Nasr, M., Giroux, B., Dupuis, J.C. (2021). A novel time-domain polarization filter based on a correlation matrix analysis. Geophysics, 86(2): V91-V106. https://doi.org/10.1190/geo2020-0002.1
[38] Choi, J.A., Lim, K. (2020). Identifying machine learning techniques for classification of target advertising. ICT Express, 6(3): 175-180. https://doi.org/10.1016/j.icte.2020.04.012
[39] Kamal, M., Bablu, T A. (2022). Machine learning models for predicting click-through rates on social media: Factors and performance analysis. International Journal of Applied Machine Learning and Computational Intelligence, 12(4): 1-14.
[40] Lee, J., Jung, O., Lee, Y., Kim, O., Park, C. (2021). A comparison and interpretation of machine learning algorithm for the prediction of online purchase conversion. Journal of Theoretical and Applied Electronic Commerce Research, 16(5): 1472-1491. https://doi.org/10.3390/jtaer16050083
[41] Shah, A., Nasnodkar, S. (2021). The impacts of user experience metrics on click-through rate (CTR) in digital advertising: A machine learning approach. Sage Science Review of Applied Machine Learning, 4(1): 27-44.
[42] Gharibshah, Z., Zhu, X. (2021). User response prediction in online advertising. ACM Computing Surveys (CSUR), 54(3): 1-43. https://doi.org/10.1145/3446662
[43] Rácz, A., Bajusz, D., Héberger, K. (2021). Effect of dataset size and train/test split ratios in QSAR/QSPR multiclass classification. Molecules, 26(4): 1111. https://doi.org/10.3390/molecules26041111
[44] Gao, Y., Kim, M., Abuadbba, S., Kim, Y., Thapa, C., Kim, K., Camtepe, S.A., Kim, H., Nepal, S. (2020). End-to-end evaluation of federated learning and split learning for internet of things. arXiv preprint arXiv:2003.13376. https://doi.org/10.48550/arXiv.2003.13376
[45] Ali, L., Alnajjar, F., Jassmi, H.A., Gocho, M., Khan, W., Serhani, M.A. (2021). Performance evaluation of deep CNN-based crack detection and localization techniques for concrete structures. Sensors, 21(5): 1688. https://doi.org/10.3390/s21051688
[46] Geurts, P., Ernst, D., Wehenkel, L. (2006). Extremely randomized trees. Machine Learning, 63: 3-42. https://doi.org/10.1007/s10994-006-6226-1
[47] Rigatti, S.J. (2017). Random forest. Journal of Insurance Medicine, 47(1): 31-39. https://doi.org/10.17849/insm-47-01-31-39.1
[48] Suthaharan, S., Suthaharan, S. (2016). Decision tree learning. Machine Learning Models and Algorithms for Big Data Classification: Thinking with Examples for Effective Learning, 237-269. https://doi.org/10.1007/978-1-4899-7641-3_10
[49] Chen, T., Guestrin, C. (2016). Xgboost: A scalable tree boosting system. In Proceedings of the 22nd ACM SIGKDD International Conference on Knowledge Discovery and Data Mining, pp. 785-794. https://doi.org/10.1145/2939672.2939785
[50] Natekin, A., Knoll, A. (2013). Gradient boosting machines, a tutorial. Frontiers in Neurorobotics, 7: 21. https://doi.org/10.3389/fnbot.2013.00021
[51] Taud, H., Mas, J.F. (2018). Multilayer perceptron (MLP). Geomatic Approaches for Modeling Land Change Scenarios, 451-455. https://doi.org/10.1007/978-3-319-60801-3_27
[52] Hastie, T., Rosset, S., Zhu, J., Zou, H. (2009). Multi-class adaboost. Statistics and Its Interface, 2(3): 349-360.
[53] Ke, G., Meng, Q., Finley, T., Wang, T., Chen, W., Ma, W., Ye, Q., Liu, T.Y. (2017). LightGBM: A highly efficient gradient boosting decision tree. Advances in Neural Information Processing Systems, 30.
[54] Chicco, D., Tötsch, N., Jurman, G. (2021). The Matthews correlation coefficient (MCC) is more reliable than balanced accuracy, bookmaker informedness, and markedness in two-class confusion matrix evaluation. BioData Mining, 14: 1-22. https://doi.org/10.1186/s13040-021-00244-z
[55] Zeng, G. (2020). On the confusion matrix in credit scoring and its analytical properties. Communications in Statistics-Theory and Methods, 49(9): 2080-2093. https://doi.org/10.1080/03610926.2019.1568485
[56] Shen, H., Jin, H., Cabrera, Á.A., Perer, A., Zhu, H., Hong, J.I. (2020). Designing alternative representations of confusion matrices to support non-expert public understanding of algorithm performance. Proceedings of the ACM on Human-Computer Interaction, 4(CSCW2): 1-22. https://doi.org/10.1145/3415224
[57] Vujović, Ž. (2021). Classification model evaluation metrics. International Journal of Advanced Computer Science and Applications, 12(6): 599-606. https://doi.org/10.14569/IJACSA.2021.0120670