Ahmed A. Hussien*![]() | Kamel K. Alzboon
| Kamel K. Alzboon![]() | Walaa Matalqa
| Walaa Matalqa![]() | Abdullah H.M. AlEssa
| Abdullah H.M. AlEssa![]()
© 2023 IIETA. This article is published by IIETA and is licensed under the CC BY 4.0 license (http://creativecommons.org/licenses/by/4.0/).
OPEN ACCESS
The interplay between workplace air quality and the well-being and productivity of industrial personnel is of paramount importance. This research was undertaken to evaluate the influence of air pollutants on health outcomes and comfort levels within air conditioning manufacturing facilities. A systematic field survey measured indoor levels of carbon monoxide (CO), carbon dioxide (CO2), particulate matter (PM10 and PM2.5), and nitrogen oxides (NOx). It was observed that the mean concentrations of CO, CO2, and NOx were compliant with acceptable standards. In contrast, PM10 and PM2.5 levels frequently surpassed acceptable thresholds, potentially compromising respiratory health and necessitating the implementation of enhanced protective measures, including the mandatory use of appropriate personal protective equipment (PPE), particularly respiratory protection. Hazard Quotient (HQ) assessments yielded values ranging from 0.068 to 0.115 for PM10, 0.007 to 0.008 for NO2, 0.026 to 0.103 for CO, and 0.100 to 0.104 for CO2, all of which were below the threshold of one, suggesting an absence of immediate health risks. However, the average HQ values suggested a hierarchical order of potential impact with CO2 being the highest, followed by PM10, CO, and NO2. The Health Index (HI) values varied across different plant sections, with the highest recorded in cutting and drilling areas (0.3152) and the lowest outside the plant (0.1150). Based on the health risk calculations, the respiratory system was identified as the most vulnerable, followed by the cardiovascular and nervous systems, with eye irritation as a lesser concern. The findings underscore the imperative for continuous air quality monitoring and the establishment of comprehensive awareness programs, alongside robust emergency and evacuation protocols, to mitigate health risks. The study advocates for the integration of occupational health considerations into industrial management strategies and local regulatory policies, emphasizing the critical role of air quality management in the maintenance of worker health and safety in manufacturing settings.
air pollution, indoor air quality, air conditioning industry, occupational health, workplace
Occupational hazards are ubiquitously present across various professions and industries. The World Bank's guidelines advocate for the implementation of comprehensive safety measures to foster a conducive work environment, underscoring the importance of safeguarding worker health and safety. The detrimental effects of suboptimal air quality in occupational settings are well-documented, with a proliferation of airborne contaminants often resulting in adverse health outcomes, ranging from respiratory irritation to more severe pulmonary conditions among the workforce [1].
A collaborative analysis by the World Health Organization (WHO) and the International Labor Organization (ILO) spanning from 2000 to 2016 has illuminated the substantial burden of work-related morbidities and mortalities attributable to respiratory and cardiovascular pathologies. This extensive study encompassed an array of occupational risk factors, including extended work durations, ambient air contaminants, asthma-inducing agents, exposure to carcinogens, ergonomic hazards, and excessive noise levels. Notably, the study ascertained that substandard air quality, characterized by the presence of particulate matter, gases, and fumes, was implicated in 450,381 fatalities resulting from chronic obstructive pulmonary disease (COPD) [2].
The mandate for respiratory protection in the workplace is a critical component in safeguarding the health of millions of workers. The Occupational Safety and Health Administration (OSHA) has reported that a significant number of workers in the United States are required to use respirators to defend against various airborne hazards, including dust, smog, smoke, mist, and gas emissions, as well as in environments with insufficient oxygen levels [3].
For several decades, the issue of indoor air pollution in manufacturing facilities has garnered considerable attention from researchers. Concerns are primarily centered on the association of poor air quality with severe health afflictions afflicting plant personnel, such as lung cancer, alongside the observed decrement in worker comfort and productivity [4, 5]. Air pollution has been defined by Ghorani-Azam et al. [6] as the introduction of harmful substances into the environment that can precipitate ecological degradation. The classification of air pollution has been extensively debated, with criteria encompassing origin (anthropogenic or natural), chemical constituents, particulate size, and whether it occurs indoors or outdoors [7-9].
In their investigation, Edem et al. [10] explored the influence of ergonomic factors on employee performance in a healthcare setting, examining a multitude of variables including the adequacy of equipment, ergonomic design of workstations, ventilation systems, noise levels, lighting conditions, communication efficacy, emergency fire safety protocols, and the availability of personal protective equipment. The findings elucidated a pronounced correlation between the work environment and the well-being of healthcare workers, with detrimental effects on productivity being observed.
In a study conducted by Al-Faleh [11], the prevalence of respiratory symptoms associated with welding in two industrial settings in Dammam, KSA, was assessed. The investigation encompassed 110 workers from an air-conditioning manufacturing plant and a steel plant. The findings indicated that the incidence of respiratory symptoms was significantly correlated with the type of industry, the age of the welders, and the duration of their employment. Al-Faleh underscored the necessity for welders to be cognizant of the risks presented by the materials they handle. The study recommended the adoption of general and local exhaust ventilation systems, in addition to personal protective equipment, to mitigate the inhalation of noxious fumes and gases.
In their critical review, Passi et al. [12] addressed the indoor air quality within underground metro stations, revealing that the levels of particulate matter (PMs) and volatile organic compounds (VOCs) were found to exceed permissible limits by factors of 2 to 10. Emission sources were identified as primary contributors to the escalated levels of pollutants. Moreover, it was noted that efforts to reduce energy consumption in heating and cooling systems through the recirculation of internal air can inadvertently elevate pollutant concentrations [13]. The alteration of indoor air composition to hazardous levels due to manufacturing processes has been implicated in a range of serious health issues among workers, who typically spend upwards of 80% of their lives indoors [14]. The principal contaminants of concern in these environments are VOCs, nitrogen oxides (NOx), carbon monoxide (CO), carbon dioxide (CO2), and particulate matter with diameters of less than 10 µm (PM10) and less than 2.5 µm (PM2.5) [15].
The ramifications of diminished indoor air quality on occupational health were explored by Tanir and Mete [16], who posited that source management, engineering controls, and management controls are pivotal strategies for the amelioration of indoor air pollutants. This triad of strategies forms the cornerstone of interventions aimed at alleviating the adverse impacts of compromised air quality on workers.
The concern for air quality during industrial production has been the subject of extensive research. Adeniran et al. [17] conducted an assessment of air pollution within a cement manufacturing plant in Nigeria. Their research detected the presence of a suite of pollutants, including nitrogen oxides (NO, NO2), sulfur dioxide (SO2), carbon monoxide (CO), and volatile organic compounds (VOCs), across various plant locations and during disparate production phases. Several of these gases were found to surpass safety thresholds, prompting a call for robust control measures and consistent monitoring of air quality throughout the production process.
In a series of studies, Al-Zboon and Forton [18, 19], investigated the prevalence of common air contaminants in the steel industry, including VOCs, SO2, ozone (O3), nitrogen oxides (NOx), PM2.5, PM10, CO, and CO2. The results from these studies indicated elevated health risks at all surveyed sites within steel plants. In response to these findings, recommendations were made for the implementation of effective ventilation systems, the institution of regular medical examinations, and the application of a job rotation strategy among the workforce to mitigate exposure. Further research by Al-Zboon [20] delved into the emissions and indoor air quality of a cement plant, examining the impact of receptor sensitivity and duration of exposure on worker health. It was observed that while pollutant concentrations exceeded ambient air quality standards, they remained within acceptable limits, a testament to the efficacy of the ventilation measures in place.
The chronic effects of inhalational exposure to paint fumes within the automotive industry were investigated by James et al. [21]. The study reported that sustained exposure among workers culminated in functional impairments of both renal and hepatic systems. Furthermore, it was corroborated that heightened awareness of associated risks and the advocacy for personal protective equipment usage markedly diminished fume exposure among the workforce.
Despite the extensive body of literature examining the general health effects of indoor air quality [22-24], research focusing on the monitoring and assessment of such quality remains scarce [25]. Notably, investigations into the indoor air quality within manufacturing plants are significantly lacking. Amidst an industrial renaissance, Saudi Arabia has witnessed substantial growth in sectors such as petrochemicals, mining, and engineering. Within this context, the air conditioning industry has seen a considerable surge, driven by robust local and regional demand. In 2023, the sector's revenue achieved an approximate $0.66 billion, with projections indicating a demand for 1.4 million units by 2028 [26]. In response to this imperative, the present study was initiated to evaluate and analyze the indoor air quality of a central air conditioners manufacturing plant located in Saudi Arabia. The aim was to investigate the potential health impacts and perceived comfort levels of the employees. Concentrations of pollutants, including CO, CO2, PM10, PM2.5, and NOx, were systematically monitored across various operational sites within the manufacturing processes. Subsequently, the hazard quotient (HQ) for each pollutant and the Health Index (HI) across different plant locations were calculated. The culmination of this research has led to the formulation of recommendations aimed at curtailing health risks. To the authors' best knowledge, this study represents the first investigation specifically targeting air conditioning manufacturing plants.
2.1 Production process
In this research, an Air Conditioners manufacturing plant located in Saudi Arabia, was selected for monitoring indoor air pollutants. This company is one of the main air conditioning suppliers in the Middle East.
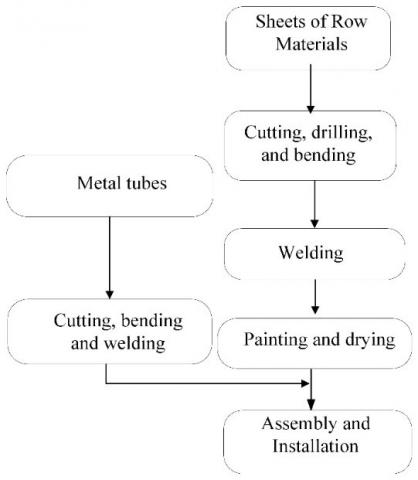
Figure 1. Flow chart of production stages
In this factory, the main process for manufacturing of air conditioners involves forming and cutting metal sheets into the required size pieces. These pieces are then perforated according to demand using CNC punching machines, and afterwards, the pieces are transferred to the edge bending stage. To prepare the pieces for painting stage, dust and impurities stuck in the product pieces are removed using water sprayers. On the other side, the pipes are sized and welded as required. Finally, the fan, the frame, the compressor, and the rest of the complementary parts, along with the outer frame, are assembled to reach the final product. The flow chart of production stages is shown in Figure 1.
At each stage of production, there are many technicians and workers around the devices and equipment to monitor and supervise the production lines. Therefore, it is important to study the indoor air quality to ensure a healthy environment in manufacturing plants.
2.2 Measurements
In this research, a portable Modular Area Monitor (Greywolf, Canada) with two probes was utilized to measure gaseous concentrations. This device has sensors to detect some of air pollutants includes CO, CO2, SO2, NO2, and VOCs. This device can detect up to 0.01 ppm for NO2 and O3, while the resolution for other gases is 0.1 ppm, with an accuracy ranged (1-4%). A rechargeable battery was used as an energy source for the modular area monitor, providing active operation for up to 18 hours. Many researchers have utilized Greywolf instruments for monitoring the indoor air quality [17]. The instruments were placed at the selected sampling sites at a height of approximately 1.5 m and positioned more than 2 meters away from the workplace to ensure smooth readings. In order to prevent possible interface with the ambient environment, the doors and windows were kept closed during the measurements. The measurements of gases for 30 minutes in each site was repeated three times and the average values were reported. A continuous real-time dust monitor (Aeroqual, USA) with a measurement range of 0-60,000 μg/m3 was used for monitoring the particulate matters (PM10 and PM2.5). All instruments were calibrated before taking the readings.
2.3 Applicable standards
Air Quality Assessment was done by comparing all the results with the applicable international standards values of air pollutants (Table 1). The values in Table 1 were certified by Refrigerating and Air–Conditioning Engineers (ASHRAE), American Society of Heating, Occupational Safety and Health Administration (OSHA), Illinois Department of Public Health (IDPH), and the World Health Organization (WHO) [27]. OSHA as a part of the US Department of Labor was established in 1971 to ensure health and safety of the working environment by setting and enforcing the required standards, training, education, and assistance. OSHA has standards for health and safety in industry, construction, agriculture, and maritime which include standards of some air pollutants. IDPH developed guidelines for indoor air quality including CO2, CO, H2S, O3, particulates, formaldehyde, and NO2. ASHARE has two standards 62.1 and 62.2 for the ventilation system and the recommended indoor air quality level. WHO standards have been set based on the conducted studies about the health effects of pollutants [18-20].
2.4 Sampling sites
The sampling sites were selected based on the active process and the most important sources of air pollution. Five different locations in the plant were monitored to detect the pollutants in addition to the outside of the plant as a reference point. These sites were selected to cover all active processes and the most significant sources of pollutants from receiving the raw materials until producing the final product, which were symbolized by alphabet as, (A) cutting and drilling of the raw materials, (B) staging area, (C) welding brass tubes area, (D) assembly area, and (E) painting area, in addition to the reference point (F).
Table 1. International standards values of air pollutants
|
Pollutant |
IDPH |
ASHRAE |
OSHA (PEL) |
WHO |
|
CO2 |
1,000 ppm (<800 ppm preferred) |
1,000 ppm |
5,000 ppm |
NA |
|
CO |
9 ppm |
9 ppm |
50 ppm |
10 mg/m3 (8 hours) |
|
TVOC |
NA |
NA |
NA |
NA |
|
NO2 |
NA0.05 ppm |
NA |
5 ppm |
25 µg/m3 (24 hours) |
|
PM10 |
150 µg/ m3 (24 hours)NA |
NA |
5 mg/m3 |
45 µg/m3 (24 hours) |
|
PM2.5 |
0.65 µg/ m3 (24 hours)NA |
NA |
NA |
15 µg/m3 (24 hours) |
2.5 Health risk assessment
Health risks associated with exposure to gases and dusts were assessed using the hazard quotient (HQ) and the health hazard index (HI). Adeniran et al. [17] defined the HQ as the reference concentration, which is the ratio of potential exposure to a pollutant to the level at which no adverse effects are expected. HQ can be estimated using the following formula:
$H Q=\frac{E C}{R C}$ (1)
where, HQ, EC, and RC are hazards quotient, exposure concentration, and reference concentration, respectively.
If HQ is less than one, then the concentration is below the RC value and no action is required as no adverse health effects are expected. When HI increases to more than 1, it poses an alarm for human health concerns [23]. Based on Occupational Safety and Health Administration (OSHA) guidelines, the reference concentrations were determined for CO, CO2, NO2 and PM10. To assess the potential human health risk from all pollutants, the hazard index (HI) has been established by summing the HQ for all pollutants [23].
3.1 Air quality
In this research, five air pollutants were measured at various locations inside the plant. The average, maximum and minimum values, along with the standard deviation to the measured air quality parameters during the study period, are presented in Table 2. The standard deviation of the concentration of all air pollutants is less than 5%. This indicates the stability of gas concentration values and the absence of significant differences between the readings.
Table 2. Results of air pollutants inside the plant
| CO2(ppm) | CO(ppm) | NO2(ppm) | PM2.5(µg/m3) | PM10(µg/m3) | |
| Average | 521.2 | 2.71 | 0.037 | 54 | 423 |
| Max. value | 610.1 | 6.6 | 0.07 | Q131 | 921 |
| Min. value | 486 | 1.15 | 0.01 | 41 | 317 |
| Standard deviation | 16.97 | 0.09 | 0.001 | 22 | 129 |
Figure 2. CO concentration (ppm) inside the plant
The average carbon monoxide concentration inside the factory ranged between 1.5 ppm to 5.5 ppm for all sites during the observation period, as shown in Figure 2. Therefore, all carbon monoxide values are within the accepted limit.
The data obtained from the CO measurements in this study reveals valuable insights into the indoor air quality within the plant. The average CO concentration was found to be 2.71 ppm, with a maximum value of 6.6 ppm and a minimum value of 1.15 ppm. The small standard deviation of 0.09 indicates that the CO levels were relatively consistent and stable throughout the monitored locations during the study period. The low standard deviation suggests that there were no significant variations in CO concentrations, and the workplace environment appears to be well-controlled in terms of CO emissions, this is because there is no source of combustion inside the plant.
The results of the CO2 measurements in this study show an average value of 521.20 ppm, with a maximum value of 610.10 ppm and a minimum value of 486.00 ppm. The standard deviation of 16.97 indicates a moderate level of variability in the CO2 concentrations across the different locations inside the plant. The observed standard deviation suggests that the CO2 levels tend to cluster around the average value, which is indicative of relatively consistent measurements throughout the study period. However, it is important to note that the maximum value of 610.10 ppm exceeds the average value and indicates localized spikes in CO2 concentration, which may be linked to specific processes or activities within the plant.
Figure 3 shows the average concentration of carbon dioxide of indoor air for the five sites. It can be noted that the concentrations were almost constant around 550 ppm and above the reference limit outside the plant.
Figure 3. CO2 concentration (ppm) inside the plant
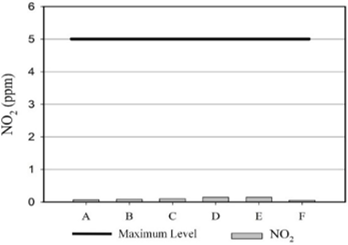
Figure 4. NO2 concentration (ppm) inside the plant
The concentration of nitrogen oxide can be illustrated in Figure 4. This pollutant is considered one of the dangerous gaseous pollutants in indoor air. The monitoring results of NO2 in the working environment indicate that the average concentration is 0.037 ppm. The maximum recorded concentration is 0.07 ppm, while the minimum is 0.01 ppm. The low standard deviation of 0.001 ppm suggests that the data points are closely clustered around the average, indicating a relatively stable and consistent NO2 concentration in the working environment, as shown in Figure 4.
As with the results of the carbon dioxide readings, the nitrogen oxide values are very satisfying compared to the risk limit. It is known that NOx is produced due to high-temperature combustion, which is never found in an air conditioning production plant [28, 29].
The monitoring results of PM2.5 in the working environment show an average concentration of 54 micrograms/m³. The maximum recorded concentration is 131 micrograms/m³, while the minimum is 41 micrograms/m³. The standard deviation of 22 indicates some variability in the data points, with values spread out from the average, as shown in Figure 5.
The average concentration of 54 micrograms/m³ suggests that the overall air quality in the working environment is moderately elevated. However, the presence of a maximum value of 131 micrograms/m³ indicates occasional spikes in PM2.5 levels, which could be a cause for concern.
The rate of indoor Particulate Matters PM2.5 is below the standard in all sites except sites C and F. This is due to an overflow in welding stage and the climate nature, respectively. The reading of PM2.5 indicates the highest value at site F, meaning the external environment negatively impacts the factory’s indoor air quality. The existing high PM2.5 values can cause serious health problems to plant workers and staff [30].
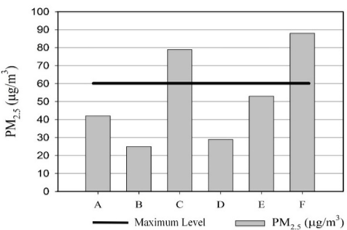
Figure 6 shows the rate of Particulate Matters less than 10 micrograms (PM10). The results show exceedance in all locations, including outside the factory, due to the dusty climate in Saudi Arabia. Exposure to these PM2.5 and PM10 values in all monitoring sites can lead to an increase in the death rate by up to 13% for 10µg/m3 according to WHO [30]. Necessary precautions such as continuous monitoring and requiring workers to wear masks and glasses, need to be taken into consideration to address these elevated levels of suspended small particles [31].
The monitoring results of PM10 in the working environment indicate that the average concentration is 423 micrograms/m³. The maximum recorded concentration is 921 micrograms/m³, while the minimum is 317 micrograms/m³. The standard deviation of 129 indicates some variability in the data points, with values spread out from the average.
The average concentration of 423 micrograms/m³ suggests that the overall air quality in the working environment is elevated and potentially hazardous. The presence of a maximum value of 921 micrograms/m³ indicates significant spikes in PM10 levels, which could pose health risks to employees exposed to such high concentrations. The high concentration of PM10 and PM2.5 might cause significant health impacts, especially on the respiratory system. Many studies reported that PM2.5 and PM10 are responsible for the increase in morbidity and mortality from respiratory and cardiovascular diseases. Also, the PM exposure increased the risk of heart disease, chronic bronchitis, decreased HDL function, and increased hospital admissions [18-20]. To reduce the potential impact of the particulate, training programs are necessary to enhance awareness of health risks. Additionally, the employees must wear suitable PPE, mainly respiratory protection devices.
Sulfur oxide is one of the main air pollutants, but in this case, the concentrations of SO4 are very low were below the measurable limit.
Figure 5. PM2.5 concentration (µg/m3) inside the plant
Figure 6. PM10 concentration (µg/m3) inside the plant
3.2 Risk index
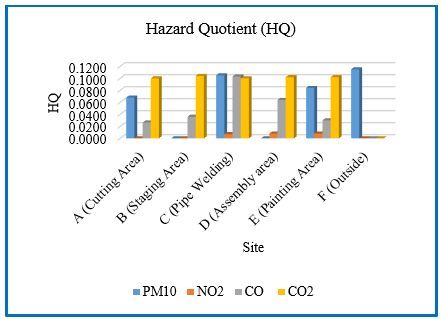
The hazard quotient (HQ) for all pollutants was determined as the ratio of the exposure concentration (EC) to a reference value (RV) for each substance. Figure 7 shows the hazard quotient (HQ) for each parameter at each site. All HQ values are below 1 in all sites, indicating that the exposure is below the reference concentration, and no significant health effects are expected [32].
Figure 7. Hazard quotient for all sites
The HQ values ranged from 0.068-0.115, 0.007-0.008, 0.026-0.103 and 0.100-0.104 for PM10, NO2, CO and CO2 respectively. The average HQ of different pollutants can be ranked as follows; CO2>PM10>CO>NO2. The Health Index (HI) values for the six sites (A to F) are 0.1944, 0.1400, 0.3152, 0.1740, 0.2240 and 0.1150, respectively. Although HQ for all pollutants <1, it is necessary to consider the impact of these pollutants in case of long-term exposure and high dosage. To protect the employees from chronic effects, all employees should be enforced to wear the required PPE. Periodical monitoring of indoor air pollutants and periodical medical check for all exposed employees are a must [33, 34].
3.3 Target organs risk factor
To determine the health effects of each pollutant on different organs, an OEHHA/ARB-approved acute reference exposure levels and target organs [35, 36] was used, as well as information from the Agency of Toxic Substances and Disease Registry (ATSDR) [37], showing the target organs of each pollutant.
Nitrogen Dioxide, Carbon Oxides, and Particulate Matters affect the respiratory system [35-37], while Carbon Monoxide exposure affects both the cardiovascular system and nervous system [35]. Additionally, nitrogen dioxide exposure can result in eye irritation [37]. There are three exposure routes in the working areas, inhalation, direct dermal contact, and ingestion of contaminated food and water. Inhalation is the main route for exposure to high levels of air pollutants and the critical pathway for cancer risk. During breathing, gases and particulates enter the lungs and can enter the bloodstream and subsequently reach the other organs. Direct contact with pollutants might irritate the skin and eyes, burn of skin, and reach the blood system through absorption of pollutants by the skin. Materials cutting, welding, painting, and employees and equipment transporting are the main sources of particulates in the plant while VOCs are generated particularly from the painting process and could cause several health problems including respiratory diseases, nausea, eye irritation, headaches, liver damage, and kidney damage. The types of fumes from the welding process depend on the types of used wire, and usually, nitrogen oxides are generated.
Among the organs/systems, the respiratory system is the most affected, with a Health Index (HI) value reaching 0.903. The cardiovascular system and nervous system follow with a value of 0.260, while eye irritation is the least affected organ, with a maximum HI value of 0.023. The affected organs/systems can be ranked based on the calculated risk factor as follows: respiratory system > cardiovascular system and nervous system > eye irritation. The impact of the considered pollutants on the main organs, especially the respiratory system needs management commitment and high response to any employees’ complaint concerning air pollution and related diseases.
The health impact of industrial activities on indoor air quality at an air conditioning plant were performed. The results indicated that all air pollutants, except particulate matter in sizes less than 2.5 and 10 µm, were within international standard values. This is due to dust from the external environment. However, the acceptable air pollutant concentrations in all tested locations were attributed to the professional ventilation and the spacious design of the plant.
The study concluded that exposure to the pollutants individually at all sites did not cause adverse health effects as individual hazard quotients (HQs) was less than one. The health risk assessment revealed that the emissions inside the plant primarily affected the respiratory system, followed by cardiovascular system and nervous system, with the eyes being the least affected organ. The results of field survey underscored the necessity to implement an awareness program to reduce the occupational health risk. It is also crucial to establish evacuation and emergency plans in all industries.
Overall, this study emphasizes the importance of continued monitoring, improved ventilation, and awareness initiatives to ensure a safe and healthy working environment for the well-being of employees in industrial settings. Also it is recommended to conduct future researches concerning: long-term effect of indoor air pollution on the employees’ health, impact of Job rotation on employees health, indoor- outdoor air quality, and hospital admissions due to indoor air quality in the industrial cities.
[1] International Finance Corporation (IFC). (2017). Environmental, health and safety general guidelines. World Bank Group.
[2] World Health Organization. (2021). WHO/ILO joint estimates of the work-related burden of disease and injury, 2000–2016: Global monitoring report.
[3] Occupational Safety and Health Administration (OSHA), Safety and Health Topics - Respiratory Protection, https://www.osha.gov/respiratory-protection, accessed on April 23, 2023.
[4] Almetwally, A.A., Bin-Jumah, M., Allam, A.A. (2020). Ambient air pollution and its influence on human health and welfare: An overview. Environmental Science and Pollution Research, 27: 24815-24830. https://doi.org/10.1007/s11356-020-09042-2
[5] Friend, M.A., Kohn, J.P. (2023). Fundamentals of occupational safety and health. Rowman & Littlefield.
[6] Ghorani-Azam, A., Riahi-Zanjani, B., Balali-Mood, M. (2016). Effects of air pollution on human health and practical measures for prevention in Iran. Journal of Research in Medical Sciences, 21(1): 65. https://doi.org/10.4103/1735-1995.189646
[7] Bernstein, J.A., Alexis, N., Barnes, C., Bernstein, I.L., Nel, A., Peden, D., Diaz-Sanchez, D., Tarlo, S.M., Williams, P.B. (2004). Health effects of air pollution. Journal of Allergy and Clinical Immunology, 114(5): 1116-1123. https://doi.org/10.1016/j.jaci.2004.08.030
[8] Appannagari, R.R. (2017). Environmental pollution causes and consequences: A study. North Asian International Research Journal of Social Science & Humanities, 3(8): 151-161.
[9] Al-Zboon, K. (2020). Impact of olive cake combustion on ambient air quality using AERMOD model. Indian Journal of Engineering, 17(48): 363-371.
[10] Edem, M.J., Akpan, E.U., Pepple, N.M. (2017). Impact of workplace environment on health workers. Occupational Medicine & Health Affairs, 5(2): 1-5. https://doi.org/10.4172/2329-6879.1000261
[11] Al-Faleh, F.A. (2015). Prevalence of respiratory symptoms among welders in steel and air conditioning plant. Arab Journal of Sciences & Research Publishing, 2(1): 34-45. https://doi.org/10.26389/ajsrp.f29416
[12] Passi, A., Nagendra, S.S., Maiya, M.P. (2021). Characteristics of indoor air quality in underground metro stations: A critical review. Building and Environment, 198: 107907. https://doi.org/10.1016/j.buildenv.2021.107907
[13] Mata, T.M., Felgueiras, F., Martins, A.A., Monteiro, H., Ferraz, M.P., Oliveira, G.M., Gabriel, M.F., Silva, G.V. (2022). Indoor air quality in elderly centers: Pollutants emission and health effects. Environments, 9(7): 86. https://doi.org/10.3390/environments9070086
[14] Bruce, N., Perez-Padilla, R., Albalak, R. (2002). The health effects of indoor air pollution exposure in developing countries. World Health Organization, Geneva. http://stoves.bioenergylists.org/stovesdoc/Environment/WHO/OEH02.5.pdf.
[15] Geiss, O., Giannopoulos, G., Tirendi, S., Barrero-Moreno, J., Larsen, B.R., Kotzias, D. (2011). The AIRMEX study-VOC measurements in public buildings and schools/kindergartens in eleven European cities: Statistical analysis of the data. Atmospheric Environment, 45(22): 3676-3684. https://doi.org/10.1016/j.atmosenv.2011.04.037
[16] Tanir, F., Mete, B. (2022). Impacts of the indoor air quality on the health of the employee and protection against these impacts. Air Quality and Health. IntechOpen. https://doi.org/10.5772/intechopen.102708
[17] Adeniran, J.A., Yusuf, R.O., Fakinle, B.S., Sonibare, J.A. (2019). Air quality assessment and modelling of pollutants emission from a major cement plant complex in Nigeria. Atmospheric Pollution Research, 10(1): 257-266. https://doi.org/10.1016/j.apr.2018.07.010
[18] Al-Zboon, K.K., Forton, O.T. (2019). Indoor air quality in steel rolling industries and possible health effects. Environment and Natural Resources Journal, 17(4): 20-29. https://doi.org/10.32526/ennrj.17.4.2019.28
[19] Al-Zboon, K., Forton, O. (2019). Indoor air quality in steel making industries. Environmental Management and Sustainable Development, 8(1): 147-79. https://doi.org/10.5296/emsd.v8i1.14315
[20] Al-Zboon, K.K. (2019). Indoor air quality in cement indus. Research Journal of Chemical, 9(4): 8-13.
[21] James, I.C., Imaga, N.A., Dokunmu, T.M., Adedeji, I.O., Emmanuel, O.O., Orija, M.E. (2022). Effects of chronic exposure to paint fumes among artisans in Lagos State, Nigeria. Toxicology Reports, 9: 663-669. https://doi.org/10.1016/j.toxrep.2022.03.027
[22] Annesi-Maesano, I., Norback, D., Zielinski, J., Bernard, A., Gratziou, C., Sigsgaard, T., Sestini, P., Viegi, G. (2013). Geriatric study in Europe on health effects of air quality in nursing homes (GERIE study) profile: Objectives, study protocol and descriptive data. Multidisciplinary Respiratory Medicine, 8: 1-10. https://doi.org/10.4081/mrm.2013.583
[23] Simoni, M., Jaakkola, M.S., Carrozzi, L., Baldacci, S., Di Pede, F., Viegi, G. (2003). Indoor air pollution and respiratory health in the elderly. European Respiratory Journal, 21(40 suppl): 15s-20s. https://doi.org/10.1183/09031936.03.00403603
[24] Abikenova, S., Issamadiyeva, G., Kulmagambetova, E., Daumova, G., Abdrakhmanova, N. (2023). Assessing occupational risk: A Classification of harmful factors in the production environment and labor process. International Journal of Safety & Security Engineering, 13(5): 871-881. https://doi.org/10.18280/ijsse.130511
[25] Baudet, A., Baurès, E., Guegan, H., Blanchard, O., Guillaso, M., Le Cann, P., Gangneux, J.P., Florentin, A. (2021). Indoor air quality in healthcare and care facilities: Chemical pollutants and microbiological contaminants. Atmosphere, 12(10): 1337. https://doi.org/10.3390/atmos12101337
[26] Statista, 2023, available online: https://www.statista.com/outlook/cmo/household-appliances/major-appliances/air-conditioners/saudi-arabia.
[27] Abdul-Wahab, S.A., En, S.C.F., Elkamel, A., Ahmadi, L., Yetilmezsoy, K. (2015). A review of standards and guidelines set by international bodies for the parameters of indoor air quality. Atmospheric Pollution Research, 6(5): 751-767. https://doi.org/10.5094/apr.2015.084
[28] Al Smadi, B.M., Al-Zboon, K.K., Shatnawi, K.M. (2009). Assessment of air pollutants emissions from a cement plant: A case study in Jordan. Jordan Journal of Civil Engineering, 3(3): 265-282.
[29] Al-Zboon, K.K. (2017). Indoor air pollution due to household use of olive cake as a source of energy. International Journal of Environment and Waste Management, 19(3): 248-267. https://doi.org/10.1504/ijewm.2017.084295
[30] Sahu, S.K., Kota, S.H. (2017). Significance of PM2. 5 air quality at the Indian capital. Aerosol and Air Quality Research, 17(2): 588-597. https://doi.org/10.4209/aaqr.2016.06.0262
[31] Al-Zboon, K., Matalqah, W., Ammary, B. (2021). Effect of cement industry on ambient air quality and potential health risk: A case study from Riyadh, Saudi Arabia. Jordanian Journal of Engineering & Chemical Industries, 4(1). https://doi.org/10.48103/jjeci422021
[32] Environmental Protection Agency. (2023). Estimated risk: Background on risk characterization. https://archive.epa.gov/airtoxics/nata/web/html/riskbg.html.
[33] Grafkina, M.V., Sviridova, E.Y., Goryacheva, E.V. (2023). Reducing occupational risks in industrial processes: Analysis and recommendations for improving safety in production equipment and facilities. International Journal of Safety & Security Engineering, 13(5): 781-788. https://doi.org/10.18280/ijsse.130502
[34] Sharma, R., Mishra, D. K. (2020). The role of safety training in original equipment manufacturing companies on employee perception of knowledge, behavior towards safety and safe work environment. International Journal of Safety and Security Engineering, 10(5): 689-698. https://doi.org/10.18280/ijsse.100514
[35] Office of Environmental Health Hazard Assessment. (2015). Air Toxics Hot Spots Program - Risk Assessment Guidelines. 2015. https://oehha.ca.gov/media/downloads/crnr/2015guidancemanual.pdf.
[36] Office of Environmental Health Hazard Assessment. (2020). Approved Acute Reference Exposure Levels and Target Organs. 2020. https://ww2.arb.ca.gov/sites/default/files/classic//toxics/healthval/totables.pdf.
[37] Agency for Toxic Substances and Disease Registry (ATSDR). Effects of Toxic Substances on Organ Systems and their Development. https://wwwn.cdc.gov/TSP/substances/ToxOrganSystems.aspx.