Willian Antonio Pachón Rodríguez*![]() | Carlos Eduardo Melo Martínez
| Carlos Eduardo Melo Martínez![]()
© 2023 IIETA. This article is published by IIETA and is licensed under the CC BY 4.0 license (http://creativecommons.org/licenses/by/4.0/).
OPEN ACCESS
One of the great challenges of any utilities around the world is the control of losses, which have different causes that are usually classified as technical (accuracy of equipment, leaks and breaks, construction and maintenance procedures) and NON-technical (thefts and frauds), affecting issues such: as investments for the expansion and maintenance of the networks, the profitability of the shareholders and even the continuity of the service. This article proposes a methodology for the detection of NON-technical losses common to any utility company, based on data analytics on business information enriched with data from third parties through geospatial analysis from its geographic location and market segmentation, which allows finding patterns on anomalous situations through supervised (on historical information) and unsupervised (if no information is available) machine learning models. The results of different classification algorithms used in data analytics were analyzed and the one with the highest accuracy and lowest type two error rates (false negatives) was selected to perform field verification work. The methodology was implemented in a natural gas distribution company and was contrasted with methodologies proposed by other authors for electric energy distribution companies, who consider that the problem should be addressed based on an analysis of historical consumption and its deviations. The results obtained with the proposed methodology improve the accuracy and sensitivity of the models by more than 20% and decreases false negatives by the same percentage, facilitating the verification and normalization of customers in anomalous situations and/or fraudulent conditions.
data analyses, fraud detection, geospatial analysis, information science, non-technical losses, utilities
Utilities are part of the basic needs of any society and play an important role in the economies of countries. In this context, national and local governments of all latitudes have allocated a large part of their resources for the construction of infrastructure to guarantee their citizens water, sewage, electricity, natural gas, and telecommunications services. In the 80s and 90s, most of the countries with market economies decided to give third parties a stake in these businesses and to allocate the resources from the treasury to other activities that are also required to guarantee the welfare of their inhabitants. Since then, governments, whenever third parties are willing to invest in infrastructure for the provision of residential public utilities, have only exercised control and oversight through agencies created for that purpose, which specify, among other things, fair tariff schemes for companies and users.
One of the great challenges of any distribution and commercialization company of domiciliary public utilities is the control of losses, which affect to a greater or lesser degree the profitability of shareholders. In the case of Colombia and according to information gathered from various sources, water losses in the aqueduct systems reach levels of 43%. For electricity [1] in the order of 20% [2] the natural gas they are around 6% [3], however, the regulatory and control bodies recognize much lower values via tariffs, in the case of the aqueduct, 30% [4]. for electricity between 1.5% and 6.8% depending on voltage level and area of operation [5], while for natural gas, only 3.7% of the total [6], the differences must be borne by the distribution companies, penalizing their revenues and future investments.
Losses in the distribution process for any utility are calculated by comparing what enters and what leaves the system, technically calculated as the difference between macro metering at the input(s) of the distribution systems and micro metering on customers in different markets (residential, commercial, industrial, institutional). Losses have different origins and are usually classified as technical and non-technical, the former referring to characteristics of the networks that can and should be controlled by the utility companies, among the most relevant we can mention those originating in the accuracy of the equipment used in the measurement processes, the correct operation of the equipment, leaks, and breaks in the networks, the permeability of the pipelines in the case of natural gas, the construction and maintenance procedures, etc.
Non-technical losses, on the other hand, correspond to situations or events that are not controlled within the daily operation of a distribution network, but that significantly affect the income of companies engaged in these businesses, these mostly correspond to theft and fraud and have different typologies, For example, we can find the manipulation of primary elements (meters), secondary elements (equipment that records other variables such as pressure, temperature, density), tertiary elements (telemetry equipment and flow computers), as well as clandestine connections, another important component of this type of loss is often associated with problems in billing systems.
Loss control is usually approached from the monitoring of historical consumption and its deviations, leaving aside the context and many variables of interest specific to each business. This research proposes a new paradigm that involves other variables and third parties, as well as spatial analysis to enrich the machine learning models and improve the accuracy of the results in the fieldwork that demands the execution of resources that are always limited.
The models with enriched data showed that fraud detection improves if, in addition to consumption, other variables existing in the information systems of the organizations are involved, as well as geographic analysis of variables of interest, and information provided by third parties when available. Many entities, particularly in the state sector, have open data platforms, most of them free of charge, which can be used to enrich the georeferenced information existing within the utilities companies, based on geographic location and spatial cross-referencing.
1.1 Literature review
Fraudulent behavior has been widely studied in the financial sector, particularly in the credit card [7] and insurance markets [8], as well as in forensic and accounting audits [9] however, studies of utility fraud are scarce and have been mostly limited to the electricity market, possibly because electricity consumption is one of the indicators of a country's economic growth and as such is followed in detail by national governments as one of the important items in macroeconomic policy.
The techniques for fraud detection adopted by companies in the electricity and natural gas sectors are dissimilar, in the case of electricity they are based on analysis of historical consumption and classification algorithms supported by computational tools, while for natural gas there have been particular studies on dissertation cases, experiences that have been socialized in different scenarios, we will first review relevant studies in the electricity market and then those of the natural gas market.
The problem of fraud on electrical networks has been studied in detail since 2008 promoted by the Institute of Electrical and Electronics Engineering (IEEE) based in the United States, addressing case studies in countries such as Brazil, Malaysia, China, Hungary, India, Mexico, and the United States.
Angelos Eduardo, Saavedra Osvaldo, Carmona Omar, and de Souza André [10] point out that losses in the electricity market in developing countries have historically been close to 15%. They also comment that inspecting all installations in search of unauthorized connections, fraud in metering devices, and unmeasured consumption is very costly, so they propose a computational technique called KDD (Knowledge Discovery in Databases) that classifies anomalous consumption profiles and then, based on fuzzy logic, assigns them a score as a candidate for fraud, which makes the field inspection process economically viable as it leads to higher revenue recovery margins. For the execution of the prototype, they worked on six months of historical readings for a little more than 20,000 customers with a history of fraud, located in one of the neighborhoods of an electric energy distribution company based in Brazil, analyzing Average Consumption, Maximum Consumption, and standard deviations.
Other case studies have been carried out in Eastern countries, where the fraud situation is more critical, in Malaysia for example and according to Nagi et al. [11] faces losses in the electricity market of more than 20%, so genetic algorithms and vector machines were proposed in 2008 to detect deviations in consumption, for send technical visits of inspection. The algorithms used by the authors in their research were proposed in the 1960s, and are used to find optimal solutions based on statistical learning theory. The fraud detection system presented in Indonesia was developed as a stand-alone software made in Microsoft Visual Basic 6.0 running among others; Data Acquisition, Customer Filtering and Selection, Data Pre-processing, Data Normalization, Classification, and Prediction. During this research, they analyzed 108,520 customers and detected 138 frauds.
Other types of solutions have also been proposed, for example, at an international communications conference held in Australia [12] unveiled a control scheme with bidirectional smart metering based on the behavior and load profiles of each customer, which would make it possible to make inferences and detect possible fraud.
In 2016 researchers from the University of Luxembourg raised at the IEEE international congress held in Shanghai, China, a methodology for the detection of fraud in customers of companies in the electricity sector in Brazil, dividing the study area into grids of different sizes from 0.6 Km2 to 40 Km2 depending on latitude and longitude, analyzing time series of consumption of 700,000 customers, customer class, and connection voltage, these characteristics were loaded into a BDD of 31 million records and 4 machine learning algorithms were trained (Logistic Regression, KNN, SVM, and Random Forest) which according to the authors improved fraud detection in proportions from 1% to 90%, so they conclude that analyzing only the time series of consumption leads to limited results and recommend to consider more data [13].
In 2018 Massaferro at an IEEE meeting held in Portland (USA) [14] proposed an improved methodology for finding optimal grid sizes to calculate the feature set and a randomized search procedure applied to a set of 6,000 Uruguayan residential customers in which they analyzed monthly consumption, contractual information and local news that were introduced in a Random Forest classification algorithm, concluding that the geographic location used as input feature provides better results in fraud detection.
During the fifth international conference on advanced computer and communications systems held in India in 2019, Lydia et al. [15] presented sensors installed in the distribution circuits and an Orthogonal Matching Pursuit algorithm on them, to validate power and voltages, however, initial tests showed that a significant number of these devices are required to achieve efficiencies above 87% and therefore their implementation was not feasible.
In the case of natural gas, there are few documented studies on the subject of fraud and some of them are very general in loss analysis. An article written in 2014 by Brkovic et al. [16] and published in Energy Source magazine analyzes the situation for one of the largest natural gas distribution companies in Serbia, which at the time had 40-year-old networks, stated that gas losses in transportation process vary from 1% to 2% due to issues associated with metering, while in the distribution process, they amounted to 6% mostly due to unauthorized use and other causes such as; problems with metering equipment, problems in volume corrections for pressure and temperature, problems in the inlet and outlet controls of the systems, leaks in the network, unauthorized connections to the distribution system, bypass of the metering systems, etc.
In the same year, the journal Forensic Science International published the article Investigation of natural gas theft by magnetic remanence mapping [17], showing the work done in Hungary to detect traces of tampering with magnets on a random sample of 80 natural gas meters. This type of fraud is very common but only affects meters that transmit electromagnetic pulses to corrector units or dataloggers. The magnetic resonance mapping study showed that 50% of the sample was affected at some point by a magnetic field.
In 2016 at the IEEE international conference organized in Montreal (Canada) [18] a study was presented on consumption data from a Spanish distribution company serving the electricity and natural gas markets, analyzing the correlation between the consumption of the two services, the data analyzed by these researchers were the consumption reported by smart meters and analog meters, The data analyzed by these researchers were the consumption reported by smart meters and analog meters, fraud history and weather information from different areas of Spain that correlate with the increase or decrease of fuel at different times of the year, however, few distribution and marketing companies serve the two markets and that have that data to correlate the consumption of electricity and natural gas, so in practice, most companies should address other approaches as the one proposed in this research.
During an international electronics symposium organized by IEEE in 2018 Wiratama et al. [19] presented a billing system based on automatic reading with e-mail notification used by an Indonesian natural gas distribution company in commercial establishments to control variables such as Volume, Pressure, and Temperature through GPRS connection, information that migrated to a billing system through SMPT (Simple Mail Transfer Protocol) communication protocols.
This article is aligned with the proposal made in 2018 by Massaferro which proposed to involve geographic information in the process of data analytics for fraud detection, but without plotting random grids, instead analyzing the spatial correlation of individuals, consumptions, and other variables relevant to the business, This proposal allows public utility companies to achieve efficiencies in the management of resources allocated for fieldwork to detect anomalies in consumption and/or possible fraud.
As shown in Figure 1, the consumption of primary energies in the world, according to International Energy Agency is led by oil, followed by coal and natural gas. These will change in the coming decades in line with the policies of decarbonization of the economy that have been proposed in recent climate change summits by migrating to renewable energies and natural gas. Natural gas is the fossil fuel with the least impact on the environment, which is why it is preferred over other fuels such as coal, gasoline, or diesel in production and transformation processes. The consumption of natural gas in the world represents 23% of primary energies and its boom, according to a publication by the World Energy Council (WEC), will continue to grow as long as renewable energies do not guarantee reliability and reduce their production costs, reaching a quarter of the energy demand by 2040 [20].
Figure 1. Global share of total energy supply by source [21]
The scenarios proposed by WEC show how the demand for natural gas will increase significantly in the coming decades compared to other fossil fuels and alternative energies. For Colombia and according to figures from the guild that groups the companies of the gas sector [22] the demand for natural gas will have an annual growth rate of 1.4% until 2040, increasing its participation in the energy matrix from 23% to 25%, so controlling losses is imperative for companies engaged in this business.
Natural gas, like electricity and water, is extracted or produced in places distant from consumption centers and then delivered to end users through a value chain involving different actors (producers, transporters, distributors, and marketers). In the case of natural gas, it is transported at high pressures and delivered to regulation and metering stations called City Gate to distribution companies serving small and large cities, where custody of the fuel is transferred through metering systems required by the regulatory bodies based on the volumes marketed.
In practice, balances are calculated as the difference between what enters and leaves each distribution system, and losses are expected to be minimal, and must also have explanations (technical and non-technical). Given this situation and the complexity of the issue, the regulators of each country allow a maximum percentage of losses at each stage of the value chain, which is transferred to the customers of the distribution companies and/or marketers in solidarity via tariff, however in recent years the natural gas distribution companies in Colombia and other countries have expressed concern about the growing increase in non-technical losses, This situation is beginning to generate financial problems in the companies, affecting cash flows and future investments since the indexes of unaccounted natural gas (losses) in the largest natural gas distribution companies in the country exceed the limit established in the current regulation, this situation highlights the need to implement concrete actions to close the loss gap that could lead these companies to complex economic situations, as has already happened in the electricity sector.
The models proposed by other authors for the electricity market suggest that it is possible to detect fraudulent behavior based on the monitoring of historical consumption, monthly averages, minimums, maximums, and standard deviations, for which they propose to analyze consumption data for at least six months, perform data preprocessing, data normalization, training and prediction using supervised classification algorithms on customers with historical fraud, the most accepted algorithm being the Support Vector Classification (SVC).
The methodology proposed during this research contemplates the use of techniques for data analytics and geospatial tools, as well as supervised classification algorithms, provided that historical fraud information is available; otherwise, the use of unsupervised classification algorithms and the detection of anomalous values are proposed alternatively.
Figure 2. Process overview
Figure 2 details the methodology proposed in this research, which begins with the collection of data available inside and outside the company and its structure in a relational database, followed by a georeferencing (spatial positioning technique on map) of customers, which allows the enrichment of data from spatial analysis with own or third party information, as well as its segmentation by zones or variables of interest. Once the data are structured, two dashboards are generated for the training phase (one with only consumption data and the other with the addition of the variables proposed in the research), and a third dashboard is generated with production data. For the training phase, the data set must always be balanced (equal amount of frauds and non-frauds) to guarantee the correct operation of the classification algorithms.
For the execution of the machine learning algorithms on the training and production data sets, the Python work environment must be connected to the relational database as shown in Figure 3 and the whole process of data curation must be carried out, as well as the descriptive and diagnostic analyses on each proposed variable so that, based on the hypothesis tests, the decision to include them in the algorithms to be used can be taken or not.
Figure 3. Diagram of the proposed solution
Note: Figure 3: Extraction, Transformation, Loading, Preliminary Analysis, and Machine Learning Models
Once the significant variables have been selected, the evaluation metrics are defined and the battery of algorithms is run on the training set to select the most accurate and sensitive model, with which the predictive analysis on the production data set will be finally executed, which will allow to know the customers with a high probability of fraud. Finally, the customers selected by the machine learning model will be displayed on the map, and the spatial correlation of the individuals and the magnitude of the possible losses will be analyzed to program the execution of the fieldwork with the available resources and technologies.
3.1 Customer georeferencing
Visualizing on a map any activity developed in the territory allows us to discover patterns that are impossible to find if we only stop to analyze data on a set of tables, any utility company needs to know where their customers are located, what is their environment and how the relevant variables of the business are interrelated. To achieve this, organizations must have structured processes that facilitate the location of each customer on updated cartography or use geo-coding services based on existing addresses in commercial systems, although with some degree of uncertainty associated with the quality of the data and the updating of the road grids used for the process.
3.2 Preliminary analysis
In addition to the consumption history, it is recommended to structure a relational database with its spatial component and connect it to a Machine Learning development environment, which allows the involvement of all the variables relevant to the business, for example:
3.3 Customer segmentation
To improve the accuracies of machine learning models, it is recommended to segment the training and production sets, generating consumption typologies based on activity and location, for this it is necessary to group customers according to their neighborhoods and calculate average consumption by activity, this will allow associating consumption characteristics explained by the spatial correlation of individuals, a phenomenon that has been studied in the field of geography since the late 1960s [23].
3.4 Balancing data sets
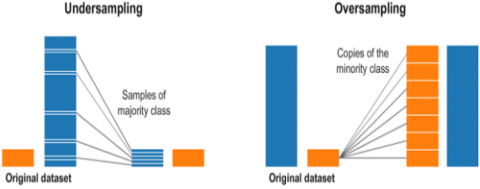
To train the classification algorithms it is recommended to have balanced data sets, i.e. to have a similar amount of observations in each of the expected sets (binary in the case of fraud detection), if there is not enough data on any of the sets, the amount of data available for training should be adjusted using one of the following techniques:
Figure 4. Techniques for adjusting unbalanced data sets [24]
Figure 4 shows the most commonly used techniques for balancing data sets.
3.5 Pre-processing information
As with any machine learning technique, data review and curation must be performed during the training and production sets, taking care not to eliminate records with null data, or to eliminate as few as possible, as long as other options are exhausted, such as assigning the averages of the segmented classes.
3.6 Descriptive statistics
This will allow knowing in detail the data under study, types of variables, minimum and maximum values, averages, deviations, and types of distribution, for this, the most recommended tools are histograms, whisker boxes, heat maps, probability density functions, cumulative distribution functions, and QQPlot graphs available in several machine learning libraries.
3.7 Diagnostic analysis
It is important to be clear that machine learning models predict from known historical data, so they must be fed with variables that significantly affect it and improve the performance of their predictions. To select the variables that will participate in the models, inferential statistic tests must be performed on the dependent variable (Fraud) against each of the independent variables proposed in the training set and depending on the type of data. These tests use parametric or non-parametric statistics depending on the type of distribution of the data. Among categorical or nominal variables, hypothesis contrast tests such as Fisher, Barnard, Pearson’s χ2, McNemar, or Q-Cochran are usually used, while among categorical and numerical variables Analysis of Variance is usually performed using F-test One-way. The estimators obtained, and their level of significance will allow us to define whether or not to include the analyzed variable in the prediction model, based on the acceptance or rejection of the null hypotheses and consequently the action on the alternative hypotheses.
3.8 Data preparation for training
Once the significant variables are selected, we proceed to encode the categorical variables, because the machine learning models only receive numbers, for this it is highly recommended to use the technique of Dummies variables, which converts all possible values of a field into new columns, this will increase the dimensionality of the data set but improves the convergence of the algorithms. It is essential not to forget that the first or the last of the dummy columns representing each of the categorical variables must be eliminated to avoid multicollinearity problems.
Another important point in the preparation of data for training or production processes is the scaling or normalization since it improves the performance of the machine since most classification algorithms are based on criteria associated with distance, however, it is necessary to remember that some classification algorithms such as decision trees, Random Forest and XGBoost work better on data without scaling or normalization.
Although dimensionality reduction is not a mandatory process, it is recommended whenever there is a very good computational resource or small data sets in terms of quantity and dimensions.
3.9 Metrics definition
To select the best prediction model the most used parameter is usually the accuracy obtained on the training set, however, for classification problems it is necessary to evaluate other metrics calculated from the confusion matrix, which allows to address different perspectives of the problem and improve the interpretation of the results, the models selected only based on a high accuracy usually detect very few frauds. This situation is even more critical in unbalanced data sets.
Confusion Matrix
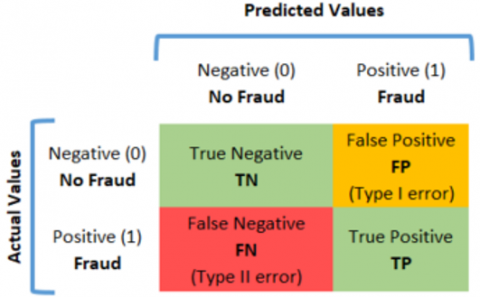
Figure 5. Confusion matrix for binary classification
Note: Figure 5: Adapted from binary confusion matrix [25]
This tool allows visualizing the performance of a supervised classification algorithm, as shown in Figure 5, allows cataloging the results obtained on the training data set, and facilitates the evaluation of the model based on different metrics:
True Positives (TP): Fraud correctly predicted by the model.
True Negatives (TN): No frauds correctly predicted by the model.
False Positives (FP): Frauds wrongly predicted by the model, also known as type one error.
False Negatives (FN): Non-frauds predicted incorrectly by the model are also known as type two errors and it is essential to reduce their occurrence to the minimum possible.
Accuracy: Number of correctly predicted records (frauds and non-frauds) over the total number of records in the training set.
Accuracy $=\frac{\mathrm{TP}+\mathrm{TN}}{\mathrm{TP}+\mathrm{TN}+\mathrm{FP}+\mathrm{FN}}$ (1)
Precision: number of actual frauds over frauds predicted by the model.
Precision $=\frac{\mathrm{TP}}{\mathrm{TP}+\mathrm{FP}}$ (2)
Recall: corresponds to the rate of true positives, in our case frauds, calculated as the number of true positives over the sum of true positives and false negatives, a high value guarantees a lower occurrence of type two errors.
$\mathrm{TPR}=\frac{\mathrm{TP}}{\mathrm{TP}+\mathrm{FN}}$ (3)
F1 Score: calculates a harmonic mean between Precision and Recall.
F1 Score $=2 * \frac{(\text { Precision } * \text { Recall })}{(\text { Precision }+ \text { Recall })}$ (4)
3.10 Supervised algorithm training
Before selecting a machine learning model, we must be clear that none of them will be perfect, however, they will be very useful to support decision-making. The first thing to do then is to determine the type of problem to be solved; Regression for continuous output data or Classification to associate labels or classes. For fraud detection it is recommended to use supervised classification algorithms:
Classification and regression tree (CART):
These predict a class based on a feature matrix, it is the oldest algorithm and usually does not always deliver the best results.
Random Forest:
An evolution of classification trees, it is an ensemble learning algorithm in which each tree makes a prediction and then a majority voting decision is made.
Logistic Regression:
Used to predict the probability in percentage terms of a binary categorical dependent variable (Yes/No, 1/0, Open/Closed) based on one or more independent variables.
K-Nearest Neighbors (KNN):
Classifies a point according to the labels of its nearest neighbors (with smaller distance) by performing a majority vote among the k selected points, a k = 5 is recommended to improve the convergence of the algorithm.
Support Vector Classification (SVC):
Seeks to construct a maximum margin hyperplane separating two groups supported by two support vectors (1 from each group), invented in the 1960s, refined in the 1990s, and been widely used in the last decade.
Naive Bayes:
Chooses the group in terms of probabilities conditional on something known a priori and something inferred subsequently.
Artificial Neural Networks (ANN):
Aim to simulate the behavior of human neurons by optimizing very complex classification or prediction processes, based on the adjustment of weights, and can be supported by high-level libraries such as Theano, Tensor Flow, and Keras.
Multilayer Perceptron (MLP):
Is one of the most common neural networks and is characterized by being unidirectional with one or more hidden layers, using as global cost function the mean square error and a minimization procedure known as gradient descent.
Gradient Boosting (XGBoost):
Is a combination of ANN, CART, and Random Forest so many of its parameters are similar.
3.11 Predictive analytics
The algorithm to be used on the production set to make predictions will be the one whose Recall and F1 Score metrics have the highest values. To obtain the best results with each of the classification algorithms, it is recommended to use grid search and cross-validation techniques to evaluate combinations of hyperparameters (configuration variables such as entropy, depth, weight, number of trees, number of layers, booster, learning rate, etc.) to train each model, selecting the best of them to optimize the metrics defined in the previous paragraph.
3.12 Spatial autocorrelation
Finally, the possible frauds are plotted on a map to analyze the spatial autocorrelation of the individuals through indexes such as Moran's I. This analysis makes it possible to sectorize the fieldwork and optimize the available resources for the verification and detection of anomalous situations.
3.13 Unsupervised algorithm
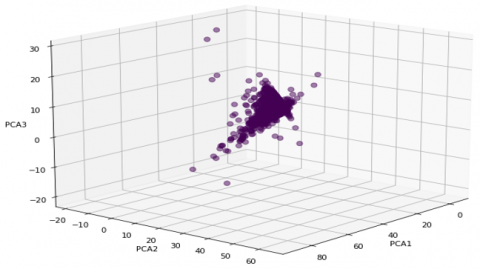
If the utility does not have a history of fraud, it is proposed as an option to treat the problem as the detection of outliers (customers with possible fraudulent behavior), in which case it is recommended to work with consumption information enriched with that of segmented markets, performing a dimensionality reduction to 2 or 3 characteristics (principal components) that provide the greatest explanation of the variance as shown in Table 1 and Figure 6, and then using the unsupervised classification algorithm such as K-Means and a single cluster, perform the detection of outliers. This technique may have poor approximations when compared to supervised classification techniques, but it is a good option when there is no information on historical fraud within the utility company.
Figure 6. Principal component and outlier analysis
Note: Figure 6: Principal components and outliers for classification with an unsupervised algorithm
Table 1. Main components
|
Component |
Variance (%) |
|
PCA1 |
48.9 |
|
PCA2 |
19.5 |
|
PCA3 |
14.1 |
|
Total |
82.5 |
Note: Table 1: Explanation of variance on each component
To validate the methodologies proposed in the previous chapter, the behavior of the fraud variable was analyzed on the training dataset made up of 2,107 records that include in equal proportions clients on whom fraud has been detected and clients without any type of anomaly. The data for training and production were structured and stored in a relational database, then geo-referenced to enrich it with additional characteristics, some obtained from third parties through spatial cross-referencing and business logic through SQL queries. A total of 14 variables were analyzed (5 categorical and 9 numerical).
The database was connected to the Python work environment and different routines were executed to guarantee the quality of the compiled data by curing them, as well as descriptive statistics and diagnostic analysis on each of the variables.
Tables 2 and 3 show the statistical associations between the predictors and the result variable after performing the corresponding hypothesis tests. For categorical variables, the X2 test was performed, while for numerical variables we used analysis of Variance using F-test One-way, in both cases the significance levels (P Value) were verified and compared against the critical value to decide whether or not to include them in the proposed machine learning models.
Table 2. Diagnostic analysis of categorical variables
|
Independent Variable |
Possible Settings |
Degrees of Freedom |
Chi-Squared |
P value |
Chi-Squared Critical Value |
Decision |
|
Category |
3 |
2 |
26.19 |
2.04E-6 |
5.99 |
Rejected Ho and Ha accepted (***) |
|
Economic Status |
6 |
5 |
37.78 |
4.16E-7 |
11.07 |
Rejected Ho and Ha accepted (***) |
|
Tariff |
2 |
1 |
5.45 |
0.019 |
3.84 |
Rejected Ho and Ha accepted (**) |
|
Activity |
9 |
8 |
82.48 |
1.54E-14 |
15.51 |
Rejected Ho and Ha accepted (***) |
|
Type of consumption |
2 |
1 |
0.77 |
0.380 |
3.84 |
Ho accepted and the variable is not included in the model (*) |
Note: null hypothesis (Ho): there is no relationship between the variables of interest; alternative hypothesis (Ha): there may be a dependence between the variables of interest; (***) significant at 1%, (**) significant at 5%, (*) no significant at 5%
Table 3. Diagnostic analysis of numerical variables
|
Independent Variable |
F-Test in One-way |
P Value |
Decision |
|
Average monthly consumption |
3.65 |
0.056 |
Ho accepted and the variable is NOT included in the model (*) |
|
Standard deviation |
8.37 |
0.004 |
Rejected Ho and Ha accepted (***) |
|
Monthly minimum consumption |
15.22 |
1.0E-4 |
Rejected Ho and Ha accepted (***) |
|
Maximum monthly consumption |
9.41 |
0.002 |
Rejected Ho and Ha accepted (***) |
|
Average category consumption |
8.35 |
0.004 |
Rejected Ho and Ha accepted (***) |
|
Average consumption of the activity in the area |
35.10 |
3.90E-9 |
Rejected Ho and Ha accepted (***) |
|
Load kw |
0.34 |
0.556 |
Ho accepted and the variable is not included in the model (*) |
|
Theoretical month consumption |
0.10 |
0.752 |
Ho accepted and the variable is not included in the model (*) |
|
Estimated lost monthly m3 |
0.02 |
0.890 |
Ho accepted and the variable is not included in the model (*) |
Note: null hypothesis (Ho): the average of the variable is equal between customers who have committed fraud and those who have not; alternative hypothesis (Ha): the average of the variable is not equal between customers who have and have not committed fraud; (***) significant at 1%, (**) significant at 5%, (*) no significant at 5%
Table 4. Evaluation metrics
|
Variables |
Classifier |
Accuracy Default Parameters % |
Best Accuracy Hiperparam % |
F1 Score % |
Recall % |
FN (Type 2 Error) % |
|
Only Consumption |
CART |
53.1 |
57.6 |
51.7 |
53.0 |
47.0 |
|
Random Forest |
62.3 |
58.1 |
54.3 |
57.6 |
42.4 |
|
|
XGBoost |
57.1 |
57.1 |
58.0 |
60.6 |
39.4 |
|
|
Logistic Regression |
59.4 |
59.6 |
58.7 |
74.2 |
25.8 |
|
|
K-Nearest Neighbors |
56.7 |
56.9 |
55.4 |
56.1 |
43.9 |
|
|
SVM (SVC) |
58.7 |
61.1 |
50.0 |
50.8 |
49.2 |
|
|
Naive Bayes |
51.6 |
14.5 |
8.3 |
91.7 |
||
|
Multilayer Perceptron |
60.3 |
60.1 |
57.8 |
60.6 |
39.4 |
|
|
Keras ANN |
51.6 |
58.4 |
58.5 |
72.7 |
27.3 |
|
|
Consumption + Additional data |
CART |
58.5 |
58.6 |
52.8 |
53.0 |
47.0 |
|
Random Forest |
64.3 |
65.1 |
57.4 |
59.1 |
40.9 |
|
|
XGBoost |
60.7 |
60.7 |
55.6 |
56.1 |
43.9 |
|
|
Logistic Regression |
64.2 |
64.4 |
60.2 |
70.5 |
29.6 |
|
|
K-Nearest Neighbors |
62.6 |
62.6 |
59.8 |
63.6 |
36.4 |
|
|
SVM (SVC) |
62.3 |
63.9 |
60.3 |
72.0 |
28.0 |
|
|
Naive Bayes |
62.1 |
58.2 |
67.4 |
32.6 |
||
|
Multilayer Perceptron |
64.0 |
65.9 |
58.2 |
62.1 |
37.9 |
|
|
Keras ANN |
55.14 |
65.3 |
58.6 |
67.4 |
32.6 |
Note: Evaluation metrics on the proposed machine learning models
Although some of the proposed variables did not have the expected significance within the diagnostic analyses and therefore were not included in the machine learning models evaluated, they allowed the identification of 63 customers with important anomalies that were corrected after the structuring of the relational database and the application of SQL queries that obeyed business logic. This shows the importance of structuring the information and applying controls on the data regardless of whether artificial intelligence models are used or not. Once the significant variables to be included in the machine learning models were selected, we prepared the boards for the training process as defined in section 3.8 and ran the set of classification algorithms proposed in this work. The models were run first using only consumption data (average, minimum, maximum, and standard deviation) as proposed in previous studies for the electricity market and then on the variables proposed in this research to compare the differences of each of the metrics defined in the confusion matrix.
The metrics obtained on the machine learning models evaluated in the research and detailed in Table 4, show that working with additional consumption data is more profitable for fraud detection than not doing so since it not only increases the accuracy of the model and the metrics proposed in the methodology (F1 Score and Recall) but also it reduces the dreaded type two errors (false negatives).
Based on the results obtained during the training phase, the Support Vector Classification (SVC) algorithm was selected because it provided the best F1 Score and Recall levels, as well as the lowest FN. The predictive analysis was performed on a total of 55,755 customers in the commercial market of the city of Bogota. allowing the identification of 5,112 clients with some type of anomaly or fraud situation, which have been normalized in the last year, contributing to the decrease in the level of losses, however, these continue to be above the values recognized in the tariff schemes, so it is necessary to continue working on other fronts to bring the indicator of unaccounted natural gas (losses) to values below those allowed in the current regulation, these fronts include the installation of deterrents such as digital meters with tamper alarms, pressure regulators with tamper-evident caps and Internet of Things (IoT) communication systems that communicate online in addition to consumption other variables of interest.
On the other hand, the treatment of the problem as outliers and the use of unsupervised algorithms for anomaly or fraud detection, as mentioned in section 3.13, is less effective than supervised algorithms but would allow the detection of about half (2,457) of the clients identified with supervised algorithms.
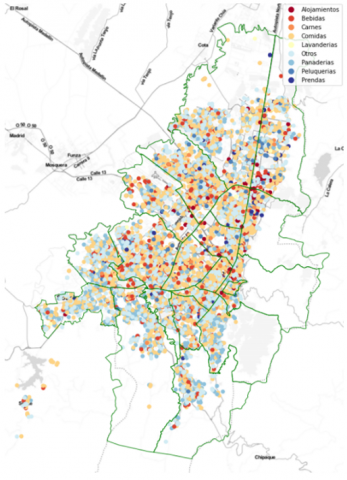
Figure 7. Frauds by activity
Note: Figure 7: Results obtained with the selected machine-learning model
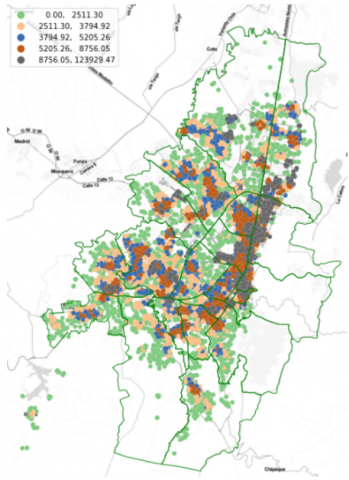
Finally, the customers identified as having a high potential for fraud are displayed on a map as shown in Figure 7, and the spatial correlations are analyzed to identify the clusters with the highest losses as shown in Figure 8 in order to schedule the field verification work, always seeking the efficiency of the available resources.
Figure 8. Loss clusters
Note: Figure 8: Clusters of losses obtained with the proposed machine-learning model
The methodology proposed in this research can be replicated in any utility company or other sector that has similar problems. The potential of machine learning models and artificial intelligence is changing our habits and ways of proceeding, it is important to know their scope and take the best of these technologies to solve many of the problems that companies have regardless of their size because doing it the right way will provide benefits and efficiencies of all kinds that will be reflected in the welfare of users, business profitability, the environment and any relevant aspect of our lives.
The results obtained show that the methodology proposed in this research improves the percentage of detection of fraud committed to public utilities and decreases the percentage of type two errors (false negatives), if we compare it with methodologies proposed by other authors for the electricity market that only contemplate the analysis of consumption behavior. It is then very convenient to use data enrichment techniques to enhance the consumption history information with variables from the business itself and others from third parties, which can be added from geospatial analysis tools available in GIS software and other open-source software that support these tasks with the help of libraries built on the same mathematical logic.
The structure of the alphanumeric and geographic data allowed the identification of some important anomalies on high consumption customers that were corrected in a short time and also facilitated the construction of automatic learning models that, when run on the production data, allowed the identification of 5,112 customers with anomalous situations and/or frauds dispersed in the area of operation of the distribution company. The proposed evaluation metrics showed that algorithms such as Artificial Neural Networks and Logistic Regression can be as efficient in fraud detection as the Support Vector Classifier algorithm.
Figure 9. Area of highest estimated losses (hot spots)
Note: Figure 9: Spatial correlation between possible fraud and estimated losses, calculated through the Moran index
As shown in Figure 9, the spatial correlation analyses revealed areas of the city where the greatest fuel losses are estimated to occur and facilitated the planning of works and the implementation of complementary solutions such as smart metering systems.
The research also shows that data analytics combined with new technologies turn out to be great allies of utilities, as they allow online controls and monitoring that a decade ago were impossible to think of or were very expensive; progress in telecommunications, particularly in the Internet of Things (IoT), as well as new standards and wireless communication protocols, facilitate real-time data collection and storage in the cloud to analyze, manage and act promptly. The operating costs of this type of solutions are lower every day, so they can become competitive in the short term if compared to current operating schemes and the costs of water, light or electricity losses for utilities, which are reflected in their cash flows and management indicators.
The implementation of new technologies in companies can be challenging so it is imperative to work on organizational change management with process leaders showing the benefits and profitability that these investments will have in the medium and long term.
This research showed the benefits of involving the spatial component in data analytics through the georeferencing of customers and the enrichment of data with own and third-party variables from business logic and spatial analysis. The results showed that the proposed methodology differs from others existing in the electricity market because it allows:
In future research, it is recommended to validate and involve recent information, since it is common to see the change of use in customers of commercial and industrial markets. Likewise, whenever possible, it is suggested to use the information provided by new technologies such as smart meters that are beginning to be installed in different countries.
[1] Superintendencia Servicios Públicos Domiciliarios. (2019). En el Día Mundial del Agua, Superservicios muestra un panorama de consumo en el país. https://www.superservicios.gov.co/Sala-de-prensa/noticias/en-el-dia-mundial-del-agua-superservicios-muestra-un-panorama-de-consumo-en-el-pais.
[2] BID. 2014. https://publications.iadb.org/publications/spanish/document/Electricidad-perdida-Dimensionando-las-p%C3%A9rdidas-de-electricidad-en-los-sistemas-de-transmisi%C3%B3n-y-distribuci%C3%B3n-en-Am%C3%A9rica-Latina-y-el-Caribe.pdf.
[3] Comisión de Regulación de Energia y Gas. (2016). Factor de pérdidas trasladable al usuario y factor de pérdidas para el calculo de la demanda para la aprobacion de cargos de distribución de gas combustible. http://apolo.creg.gov.co/Publicac.nsf/1c09d18d2d5ffb5b05256eee00709c02/6758e53d4dbfde8c052580cf005f252c/$FILE/D-145-16%20P%C3%89RDIDAS%20DE%20GAS.pdf.
[4] Comision de Regulacion de Agua Potable, "Resolución 151 de 2001," 2 Marzo 2001. [Online]. Available: https://cra.gov.co/documents/resolucion-151-de-2001-cra.pdf.
[5] Comison de Regulacion de Energia y Gas, "Resolución 082," 17 Diciembre 2002. [Online]. Available: http://apolo.creg.gov.co/Publicac.nsf/Indice01/Resoluci%C3%B3n-2002-CREG082-2002.
[6] Sistema Único de Información Normativa, "Resolución 127 de 2013," 20 Septiembre 2013. [Online]. Available: http://www.suin-juriscol.gov.co/viewDocument.asp?id=4019709.
[7] Kwaku Afriyie, J., Tawiah, K., Adoma Pels, W., Addai-Henne, S., Achiaa Dwamena, H., Odame Owiredu, E., Amening Ayeh, S., Eshun, J. (2023). A supervised machine learning algorithm for detecting and predicting fraud in credit card transactions. Decision Analytics Journal, 6: 100163. https://doi.org/10.1016/j.dajour.2023.100163
[8] Aslam, F., Imran Hunjra, A., Ftiti, Z., Louhichi, W., Shams, T. (2022). Insurance fraud detection: Evidence from artificial intelligence and machine learning. Research in International Business and Finance, 62: 101744. https://doi.org/10.1016/j.ribaf.2022.101744
[9] Papík, M., Papíková, L. (2022). Detecting accounting fraud in companies reporting under US GAAP through data mining. International Journal of Accounting Information Systems, 45: 100559. https://doi.org/10.1016/j.accinf.2022.100559
[10] Angelos, E.W., Saavedra, O.R., Carmona, C., Nunes de Souza, A. (2011). Detection and identification of abnormalities in customer consumptions in power distribution systems. IEEE Transactions on Power Delivery, 26(4): 2436-2442. http://dx.doi.org/10.1109/TPWRD.2011.2161621
[11] Nagi, J., Tiong, S.K., Yap, K.S. (2009). Detection of abnormalities and electricity theft using genetic support vector machines. TENCON 2008 - 2008 IEEE Region 10 Conference, Hyderabad, India, pp. 1-6. http://dx.doi.org/10.1109/TENCON.2008.4766403
[12] Han, W.L., Xiao, Y. (2014). NFD: A practical scheme to detect non-technical loss fraud in smart grid. 2014 IEEE International Conference on Communications (ICC), Sydney, NSW, Australia, pp. 605-609. http://dx.doi.org/10.1109/ICC.2014.6883385
[13] Glauner, P., Meira, J.A., Dolberg, L., State, R., Bettinger, F., Rangoni, Y. (2016). Neighborhood features help detecting non-technical losses in big data sets. BDCAT '16: Proceedings of the 3rd IEEE/ACM International Conference on Big Data Computing, Applications and Technologies, pp. 253-261. http://dx.doi.org/10.1145/3006299.3006310
[14] Massaferro, P., Marichal, H., Di Martino, M., Santomauro, F., Kosut, J., Fernandez, A. (2018). Improving electricity non technical losses detection including neighborhood information. 2018 IEEE Power & Energy Society General Meeting (PESGM), Portland, OR, USA, pp. 1-5. http://dx.doi.org/10.1109/PESGM.2018.8586146
[15] Lydia, M., Prem Kumar, E.G., Levron, Y. (2019). Detection of Electricity Theft based on Compressed Sensing. 2019 5th International Conference on Advanced Computing & Communication Systems (ICACCS), Coimbatore, India, pp. 995-1000. http://dx.doi.org/10.1109/ICACCS.2019.8728396
[16] Brkovic, M., Radovanovic, L., Desnica, E., Pekez, J., Adamovic, Z. (2014). Analysis of loss reduction in natural gas transportation and distribution. Energy Sources, 10(2): 214-222. https://doi.org/10.1080/15567249.2010.551824
[17] Dobó, Z., Kovács, H., Tóth, P. (2014). Investigation of natural gas theft by magnetic remanence mapping. Forensic Science International, 245: 1-6. http://dx.doi.org/10.1016/j.forsciint.2014.09.020
[18] Carmona, J., Gavalda, R., Martin, V., Alcoverro, S., Coma Puig, B. (2016). Fraud detection in energy consumption: A supervised approach. 2016 IEEE International Conference on Data Science and Advanced Analytics (DSAA), Montreal, QC, Canada. http://dx.doi.org/10.1109/DSAA.2016.19
[19] Wiratama, F.I., Syaifuddin, M., Wibowo, I.K., Ardilla, F., Purnomo, A. (2018). Gas billing system based on automatic meter reading on diaphragm gas meter with email notification. 2018 International Electronics Symposium on Knowledge Creation and Intelligent Computing (IES-KCIC), Bali, Indonesia, pp. 395-402. http://dx.doi.org/10.1109/KCIC.2018.8628521
[20] World Energy Council. (2019). Global Energy Scenarios Comparison Review. pp. 1-35.
[21] International Energy Agency. (2021). https://www.iea.org/reports/key-world-energy-statistics-2021/supply, accessed on date.
[22] Naturgas. Indicadores 2021. https://naturgas.com.co/wp-content/uploads/2021/09/informe-indicadores-naturgas-2021.pdf.
[23] Siabato, W., Guzmán, J. (2019). La autocorrelación espacial y el desarrollo de la geografía cuantitativa. Cuadernos de Geografia, 28(1): 1. https://doi.org/10.15446/rcdg.v28n1.76919
[24] Ambi, C. (2020). Imbalanced-learn: Handling imbalanced class problem. Towards AI. Available: https://pub.towardsai.net/imbalanced-learn-handling-imbalanced-class-problem-40aa3cb6525b, accessed on date.
[25] Ruuska, S., Hämäläinen, W., Kajava, S., Mughal, M., Matilainen, P., Mononen, J. (2018). Evaluation of the confusion matrix method in the validation of an automated system for measuring feeding behaviour of cattle. Behavioural Processes, 148: 56-62. https://doi.org/10.1016/j.beproc.2018.01.004