Saleh Mohammed Saleh Zakaria*![]() | Mohammad Tariq Mahmood
| Mohammad Tariq Mahmood![]()
© 2023 IIETA. This article is published by IIETA and is licensed under the CC BY 4.0 license (http://creativecommons.org/licenses/by/4.0/).
OPEN ACCESS
In arid and semi-arid regions, rainwater harvesting (RWH) system may achieve a new water source. RWH dam can be constructed, based on criteria of small earth dam, at the out let of the selected catchment area to store the harvested rainwater in its reservoir. RWH dam may suffered by seepage problem (the flow of water through dam body). Seepage problem represents a major problem that may cause dam failure if it is not controlled. Dam failure is very dangerous resulting in property destruction and loss of life. In this study, the characteristics of seepage analysis are investigated through the proposed Al-Khoser RWH dam. Seepage modelling based on finite element method and numerical analysis has carried out using SEEP/W, a sub-program of Geo Studio. The analysis is covered eight scenarios for two types of dam (homogeneous and zoned) with different filters types (toe, horizontal, chimney, and without filter) for each dam type. In order to, make suitable decision of using core and filter including specifying filter type, seepage parameters such as total head, pore water pressure, seepage discharge, velocity and the gradient are computed. The phreatic line and factor of safety against vertical and horizontal piping are also studied and presented.
filter, finite element, numerical analysis, piping, rainwater harvesting, SEEP/W, seepage, seepage modelling
In arid and semi-arid regions, rainwater harvesting systems are relied upon to find new sources of water. However engineers focus on improving the performance of these systems for the purpose of maintaining the amount of water harvested and to increase the effectiveness of these systems. Mainly, RWH system consists of a catchment that has a certain area, topographic, low rainfall rate and at the outlet of catchment area a small earthen dam is constructed to store the harvested rainwater in its reservoir [1].
Seepage problem (movement of water through the earth dam body and its foundation) is one of the main reasons of earth dam failures. Dam failure may lead potential risk to property and lives of people who live downstream area of the dam. Seepage may produce loss in water volume, piping (the progressive removal of soil particles from a soil mass by percolating water, leading to the development of channels) , heave (occurs due to an excessive uplift pressure forming a boil as it breaches the confining dam foundation), which reduce shear strengths of embankment soils therefore the dam slope stability may effect [2, 3]. Therefore studying seepage analysis and estimating factor of safety is one of the most important issues of design earth dam in order to satisfy and achievement dam safety.
The risk of seepage problem can be reduced through the use of low permeability soils, dam core, and drainage system with different types of filters (toe, horizontal and chimney), in addition to monitoring dams and conducting studies for dams under construction or dams that have already been established.
Numerical models are providing us acceptable approximations for the governing equation of flow (seepage) through pores media. There are different methods of numerical solution [4], however Finite Element Method (FEM) is a common technique for analyzing seepage problems [5, 6]. A number of researchers studied dams’ problems due to seepage events; such as:
The authors Al-Shukur and Mahmoud [7], used finite elements method to analyze seepage and limit equilibrium method to study stability of Al-Adhaim earth fill dam, that located west of Iraq, during the flood condition; their results show that the values of seepage through the embankment increased by 55.1% from maximum water level (maximum water level=143m); and water flux during maximum condition was 3.915*10-5 m3/sec and it is increased up to 5.87*10-5 m3/sec at the end of flooding condition, so the amount of increase is 33.3% at the end of transient state. This shows that the deposit is not well compacted.
The authors of the scientific paper Al-Janabi et al. [8], used three types of models (physical, mathematical, and numerical) to investigate the seepage through earth dams; seven different configurations of these dams were conducted using the SEEP/W model at normal and maximum water levels of the reservoir to find the most appropriate dam configuration among them. Three type of results were obtained from (physical models, mathematical model (L. Casagrande equations), and numerical model (SEEP/W program); these results were compared. The comparisons indicate that the location of the seepage line obtained from the three methods was almost the same. Among the considered four homogenous dams and three zoned dams. Seepage analysis indicate that a homogenous dam type with a medium drain length of 0.5 m thickness is the best design configuration if the raw material (silty sand) are available If not, a zoned earth dam type with a central core and 1:0.5 Horizontal to Vertical ratio slope is preferred.
Within the scope of the article by Beiranvand and Komasi [9], the authors have investigated seepage rate, pore water pressure and the performance of the cut-off wall of the Iranian Eyvashan earth dam; also comparison the observed seepage and pore water pressure with the results of numerical analysis were investigated too. The results of their research show that the maximum seepage rate in full reservoir conditions is equal 831,604 m3/year. Multivariate regression was used to fit the observed data with the results of numerical analysis. The results show that very good agreement between the observed and predicted data indicates the proper behavior of the dam in terms of pore water pressure.
The study of Brontowiyono et al. [10], the authors investigated earth-type Sattarkhan dam on the Aharchai River using SEEP/W model to examine the effects of various lengths and positions of cutoff wall and horizontal drainage on seepage, uplift pressure, and exit gradient. They found that increasing the length of the cutoff wall reduces seepage in both selected sections (section 1 is located in the core while section 2 is located between the core and the downstream slope); it also decreases the uplift pressure and the exit gradient. Changing the position of the cutoff wall has a significant effect on seepage fluctuations in Section 1 but has no effect on seepage in Section 2. Increasing the horizontal drainage’s length increases seepage, reduces uplift pressure, and increases the exit gradient. The closer proximity of the horizontal drainage position to the dam’s core increases seepage and decreases uplift pressure and exit gradient. They concluded that the construction of a cutoff wall and horizontal drainage with appropriate lengths and positions reduces risk and improves the stability of earth dams.
The article by Sun et al. [11], studied the effects when the water level in front of a slope drops at different each of speeds, drop ratios, initial water levels, filling materials, and matrix suction on the seepage field and slope stability. They used Seep/W and Slope/W modules of the GeoStudio finite element software with a laboratory physical model of the dam. They conclude that the greater the speed at which the water level in front of a slope falls, the greater the downward seepage force formed by the seepage field of the slope to the slope body; the change curve of the safety factor at a higher speed is steeper when the water level falls at different speeds, and the safety factor value when the water level in front of the slope is constant is smaller; the safety factor of the slope decreases with an increase in the drop ratio; when the drop ratio is the same, the loss of stability is worse if the initial water level is lower; when there is a drawdown of water levels in front of the slope, the non-cohesive medium sand slope is more prone to instability failure than the cohesive silt slope; and when this modeling method is applied to matrix suction, the effect of matrix suction increases the safety factor of the slope.
Moreover, the above-mentioned researchers, through their studies, share a set of points in addition to the methodology and differ in others epically selected analysis parameters. However, all dams under study represent a prominent importance to their communities, the researchers have made a distinguished effort to highlight seepage analysis problems for dams that suffered by these problems, and clarify some of the relationships that connected them.
All the above researches covered the study of seepage through the bodies of dams that has been constructed on a permanent river. In addition, the purpose of these dams is either for irrigation, flood regulation or/and for generating electrical energy. None of these researches had investigated seepage through RWH dam.
In this study, the characteristics of seepage analysis are investigated through the proposed Al-Khoser earth dam for RWH purpose. However, Al-Khoser RWH dam is designed according to the criteria of small earthen dams that have been proposed to construct on a Al-Khoser seasonal river. The geometrical dimensions are considered from the research made by Musa [12].
The main objectives, of the current study, are to determine each of: seepage flow rates, hydraulic gradient, factors of safety against piping by investigating seepage performance through Al-Khoser RWH dam using two types of dams (homogeneous and zoned) with three different filters types (toe, horizontal, and chimney) in order to choose the most appropriate configuration among them based on seepage analysis; the objectives include developing a numerical computer model (using finite element method (FEM) based on the SEEP/W) of different scenarios for dam and filter to simulate, determine and comparison seepage flow and the influence parameters such as: total head, pore water pressure, seepage velocity and gradient. The phreatic line is also simulate and presented. In many parts of the world and in Iraq in particular, the seepage through the rainwater harvesting dam has not been studied.
2.1 Site description
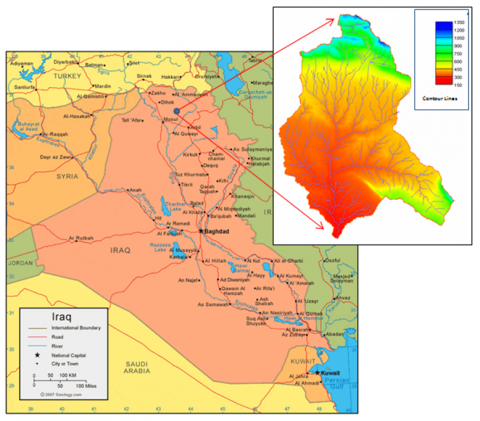
The basin of Al-Khoser seasonal river is located at 45 km northeast of Mosul in Nineveh Governorate, Iraq (Figure 1). The basin area is about 654 km2, a length of 30 km. Al-Khoser seasonal river is facing a proposed small earthen dam of rain water harvesting (RWH) at the outlet of the basin, at the grid lines of 36° 27´ 23" and 43° 11´ 29"; to store the harvested runoff that produced by rain water in dam’s reservoir. The soil of the main part of the basin area is of Silty Clay Loam, Silty Clay, Silty Loam type. The area is famous for the Rain-fed agriculture of wheat and barley crops as well as olive trees, (the source of Iraq map is geology.com/world/iraq-satellite-image.shtml).
2.2 Dimensions of Al-Khoser RWH dam
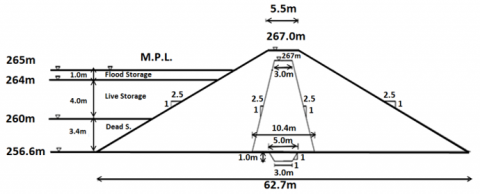
Total height of Al-Khoser RWH dam is about 10.4 m, with top crest width of 5.5 m with elevation of 267 m asl, the base dam width of 62.7 m with about 256.6 m asl of elevation, upstream side slope of the dam is 1V: 3H and downstream slope of 1V : 2.5H, total dam length is about 980 m, maximum reservoir capacity of 3.4 million m3, the maximum pool water level of the reservoir is 8.4 m. Dam core is about 3.0 m of crest width and 10.4 m of base width with 9.4 m of height with upstream and downstream slope are 1V: 2.5H. Dam cutoff depth of 1 m, top width is about 5 m, base width 3 m, with upstream and downstream slope are 1V: 1H. Dam spillway is an Ogee type (chosen due to the hydraulic characteristics of effective drainage and high accuracy in discharge measurement) with a design capacity of 1084 m3/s based on the discharge of maximum flood storm with return period of 100 years, Figure 2 shows RWH dam section; Figure 3 shows Annual Volume of Reservoir of Al-Khoser RWH dam [12].
Figure 1. Location of Al-Khoser seasonal river basin, northeast of Mosul city, Nineveh Governorate, Iraq
Figure 2. RWH dam section, zoned earth dam type, (source: [12])
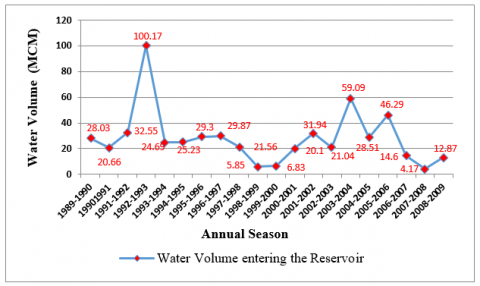
Figure 3. Annual harvested volume of water entering the reservoir of Al-Khoser RWH dam
2.3 Reservoir capacity of Al-Khoser RWH dam
The volumes of water that entering the rainwater harvesting reservoir is varied with a range of (4.17-100.17) MCM based on HEC-HMS model, (developed by the US Army Corps of Engineers), for the study period (20 year). This range is depending on the value of total annual rainfall and the hydrological conditions prevailing in the study area [12]. However, these quantities of water are very critical for the arid and semi-arid region due to the lack of surface and ground water. The RWH system was enabled to collect the raindrops in a reservoir. The harvested raindrops will seep through the RWH dam body, which requires studying water movement through the dam body to ensure that the seepage is under control and does not threaten the safety of the dam.
Table 1. Materials characteristics of Al-Khoser dam
|
Dam component |
Material |
Saturated x-hydraulic conductivity (m/day) |
Saturated volumetric |
|
Embankment |
Silty Clay |
1.2e-007 |
0.286 |
|
Core |
Clay |
1.0e-008 |
0.276 |
|
Cutoff |
Clay |
1.0e-008 |
0.276 |
|
Filter |
poorly graded sand- silty sand |
5.0e-005 |
0.300 |
|
Foundation |
Clay |
1.0e-010 |
0.260 |
2.4 Al-Khoser RWH dam components
The proposed rain water harvesting dam is a small earthen dam type for the purpose of control flood and irrigation. The material zones for the dam are consisted as the following: The embankment of the dam’s body is consisted of silty clay, while the foundation and core of the dam are made of clay. Filter is consisted of poorly graded sand-silty sand; which are local soils available inside the basin of Al-Khoser seasonal river area in large quantities. The characteristics of the materials are mentioned in Table 1. These material properties were assigned to the finite element model of the dam.
3.1 Steps for modeling of Al-Khoser RWH dam
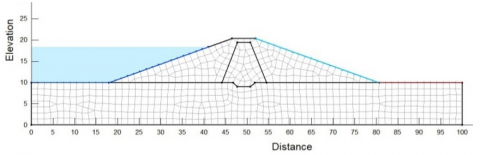
For dam type, two cross sections (homogenous and zoned) of RWH dam are chosen to develop a numerical model based on SEEP/W software. Then SEEP/W (a part of GEOSTUDIO 2012 software package) is used to generate FEM mesh, Figures 4 and 5, and the seepage analysis was conducted accordingly.
For each selected section, the input data to the SEEP/W includes suitable dimensions of the material properties respectively and verification for each cross section has been made accordingly. Then the model can be used for simulations and analysis of the results.
Boundary conditions for upstream and downstream are assigned as Dirichlet and Neumann boundary nodes [13, 14]. The nodes at the bottom of the dam foundation are considered with zero-flux (Nuemann) condition.
The mesh is developed with (705 nodes and 636 elements) for homogenous cross section and with (670 nodes and 610 elements) for zoned cross sections. For both cross sections, the mesh is consisting of triangular, square, rectangular and trapezoidal type of elements of different sizes. The mesh need experience to avoid the situation of complexity and the large number of elements for the objective of the analysis.
Three types of simulation boundary conditions were chosen. The first is Zero Pressure boundary condition with type of head (H). The second is the potential seepage face with type of total flux (Q). The third is zero pressure with type of pressure head (P) represents the surface of the foundation that located far from the reservoir.
3.2 Numerical model
The steady state of water flow (seepage) through the dam body was considered and analyzed using SEEP/W 12 software (a sub-program of Geo-Studio) based on Finite Element Method (FEM) to analyze seepage process within the soil porous media of the dam body. SEEP/W is a numerical model that can mathematically simulate the real physical process of water flowing through a particulate. Many researches, around the world, have used the SEEP/W program for various seepage problems [15].
3.3 Fundamental equations
In this study, FEM is utilized to model the water flow (seepage) in soil porous media by using the following partial differential equations (PDE) to analyze the seepage through the dam body and foundation. The mass conservation law is considered to derive the needed equations [13]. The PDE (1) is used in SEEP/W:
$\left(\frac{\partial}{\partial \mathrm{x}}\right)\left(k x \frac{\partial \mathrm{H}}{\partial \mathrm{x}}\right)+\left(\frac{\partial}{\partial \mathrm{y}}\right)\left(k y \frac{\partial \mathrm{H}}{\partial \mathrm{y}}\right)+Q=\left(\frac{\partial \theta}{\partial \mathrm{t}}\right)$ (1)
where,
Kx and Ky = horizontal and vertical hydraulic conductivity respectively; H = hydraulic head; Q = discharge; t = time N-domain; and θ = volumetric water content.
The above equation is a two-dimensional and nonlinear 2nd order PDE and is used for transient flow. It is derived from Darcy’s Law:
Eq. (1) is dependent on time, and meaning that the differences between entering and leaving flow from the elemental volume at a point is equal to the volumetric water content at that point. For steady state condition, the right side of Eq. (1) becomes equal to zero; this is true when the two water volumes (the entering and leaving of the water volume) are equal.
$\left(\frac{\partial}{\partial \mathrm{x}}\right)\left(k x \frac{\partial \mathrm{H}}{\partial \mathrm{x}}\right)+\left(\frac{\partial}{\partial \mathrm{y}}\right)\left(k y \frac{\partial \mathrm{H}}{\partial \mathrm{y}}\right)+Q=0$ (2)
In steady state and for isotopic soil (kx=ky) and absence of any drains Eq. (2) simplified into:
$\left(\frac{\partial^2 \mathrm{H}}{\partial \mathrm{x}^2}\right)+\left(\frac{\partial^2 \mathrm{H}}{\partial \mathrm{y}^2}\right)=0$ (3)
For analytical purposes, only the steady state condition for water flow (seepage) with soil saturated condition of the earth dam is considered where the boundary conditions inside and outside of the ground does not change with time. Therefore, the inflow is always equal to the outflow within the analysis range.
The analysis is carried out where the reservoir is full i.e. the water is to be at maximum pool level of height (8.4 m).
The results from the basic analysis are taken at two flux sections, the first is at upstream shell of coordinate (42, 0) m, (42, 25) m while the second is at downstream shell of coordinate (60, 0) m, (60, 25) m; each section is passed from up and down steam slope to the end of foundation of the dam therefore the calculated seepage flows (m3/sec) is represent total seepage flows for dam body and foundation.
Results are generated for eight scenarios for numerical analysis using two dam types (homogenous and zoned) and three filter type (toe, horizontal blanket, and chimney) for drainage system; with the following scenarios configurations: homogenous dam type without filter (S-1-1); homogenous dam type with horizontal filter (S-1-2); homogenous dam type with toe filter (S-1-3); homogenous dam type with chimney filter (S-1-4). For other dam type: zoned dam type without filter (S-2-1); zoned dam type with horizontal filter (S-2-2); zoned dam type with toe filter (S-2-3); zoned dam type with chimney filter (S-2-4).
Maximum reservoir level is used with all scenarios. The analysis will investigate the following characteristics through the above scenarios at selected section of 12.5 m of height above the foundation bottom: total head, pore water pressure, pressure head, X-Gradient and, x-velocity, and vertical and horizontal factor of safety against piping.
5.1 Flow net, flow direction and phreatic line activity
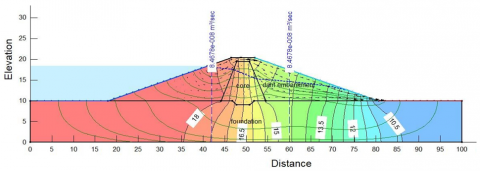
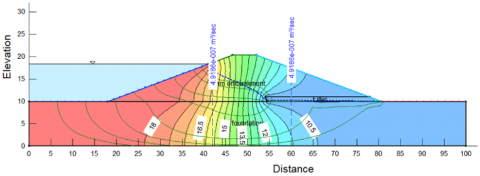
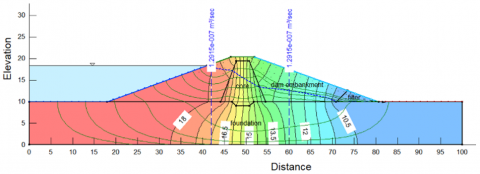
The SEEP/W program is used to analyze the seepage in the embankment and foundation of Al-Khoser proposed RWH dam for maximum pool level of height (8.4 m). Figures 6 and 7 show the following: seepage flow rate at the two selected sections, the distribution of total head (ranged between 10.5-18 m), and the flow net details for considered homogenous and zoned dam type. The flow net includes streamlines, equipotential lines, seepage flow direction and phreatic line representing the seepage behavior through Al-Khoser proposed RWH dam. In general, the phreatic line is strongly depend and affected by permeability coefficient.
For homogenous section (Figure 6), the phreatic line does not faced what can destroys its energy or changes its direction, where all dam material are the same so there is no change in permeability value in addition no filter is available therefore the phreatic line is nearly moved linearly form the upstream side slope to downstream. When a filter is available, scenarios (S-1-2 to S-1-4), (Figures 8 to 10), the phreatic line enters the filter without changing of its straight path.
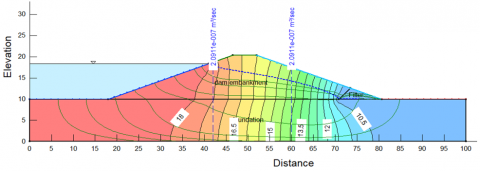
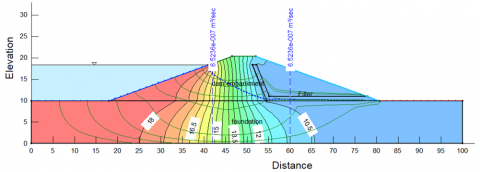
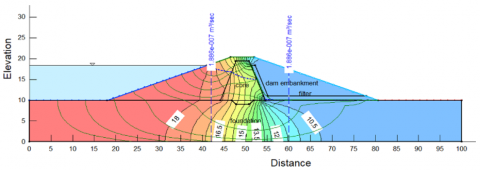
For zoned section (Figure 7) where the core is faced the phreatic line path causing refraction in the motion direction and make the position is lower than the phreatic line of homogenous section. When a filter is available, scenarios (S-2-2 to S-2-4), (Figures 11 to 13), the phreatic line suddenly dropped, when filter is used, and enters the filter without changing of its straight path inside the filter.
5.2 Total head
Seepage flow is computed with eight different scenarios (Tables 2 and 3); all of them with maximum pool water level of 8.4 m, and isotropic condition (i.e. Ky/Kx=1). Generally, the SEEP/W software introduced results in terms of flow-net which consist of streamlines and equipotential lines.
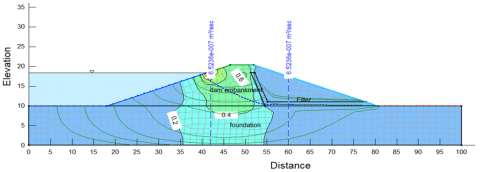
Figure 6. Flow net and total head details for homogenous dam without filter; scenario (S-1-1)
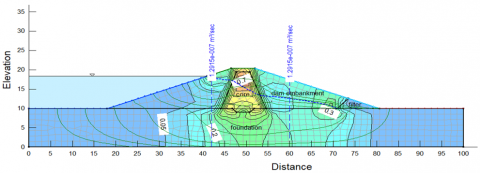
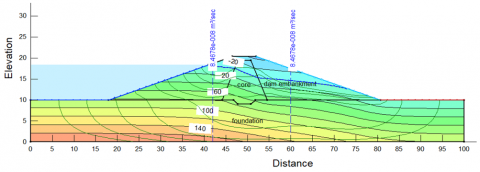
Figure 7. Flow net and total head details for zoned dam without filter; scenario (S-2-1)
The results show (Figures 8 to 13) that the flow-net shape changes depending on the presence or absence of each of filter and core, and it is also changes according to the type of filter used. In fact, what happened is that: For scenario (S-1-1), (Figure 6), it’s clearly that the boundary between saturated and unsaturated soils inside the dam body (the phreatic line) is uncontrolled and has a chance to cut the downstream slope face of the dam; which is a completely unsafe for the dam, and may leads to the dam failure.
In general, for dam section without core and without filter (Figure 6), there is no effect on the continuity of moving of the water particle through the path of soil pores until it reaches downstream exit point; and all water flow is affects by energy gradients associated with the total head of water as represented by the components of pressure head (or pore water pressure) and elevation. In the literature, the term of seepage is used to express the seepage problems where gravitational energy is dominant and such a situation is illustrated by the transfer of water particles of reservoir through the dam embankment to a downstream exit point. However, according to above, the minimum and maximum values of total head ranged between 10.5-18.0 m; which contributed to the values of seepage flow to be 1.3177e-007 m3/sec that measured at the selected two flux sections 1 of coordinates: (42, 0) and (42, 25) m, and flux sections 2 of coordinates: (60, 0) and (60, 25) m, inside the dam embankment before and after the dam core location, respectively.
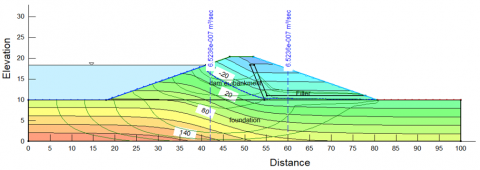
For the considered steady state of seepage flow with saturated soil condition of the earth dam where the boundary conditions inside and outside of the ground does not change with time. Therefore, the inflow is always equal to the outflow within the analysis range at the selected two flux sections 1 and 2, respectively. Unlike cases having a drainage system at the downstream of the dam, such as scenarios (S-1-2) - (S-1-4), (Figures 8 to 10), the phreatic line is controlled and has no chance to reach the downstream slope face of the dam. However, for scenarios (S-1-2), (S-1-3), and (S-1-4), the minimum and maximum values of total head also ranged between 10.5-18.0 m through dam body; which contributed to the values of seepage flows to be 4.9186e-007, 2.0911e-007, and 6.5236 e-007 m3/sec, for the mentioned scenarios where seepage flow rate measured at the same selected two flux sections 1 and 2 respectively.
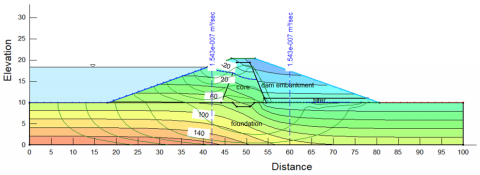
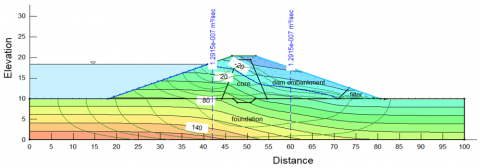
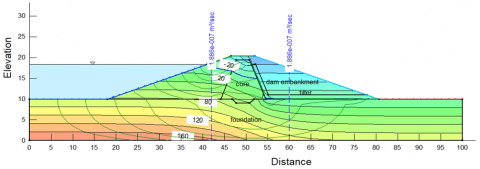
For scenarios (S-2-2), (S-2-3), and (S-2-4), (Figures 11 to 13), the minimum and maximum values of total head also ranged between 10.5-18.0 m through dam body; which contributed to the values of seepage flows to be 1.543e-007, 1.2915e-007 and 1.896e-007 (m3/sec) respectively.
Seepage discharge is affected and its value change with alternating using filter type; minimum seepage discharge found with using toe filter; while maximum seepage discharge found with using chimney filter, same thing for percentage increase in seepage discharge where ranged between 0.587-3.951 for homogenous dam section; while ranged between 0.52-1.22 for zoned dam section. Therefore, the drain plays a very important role in the dam safety issue.
Tables 2 and 3 show the percentage increase in seepage discharge depending on the type of dam section and filter used. The references condition of seepage discharge value is for scenario (S-1-1) and (S-2-1) for homogenous and zoned dam section respectively. Best result was found with scenario (S-2-3) which produced minimum percentage of seepage increased.
Table 2. Percentage increase in seepage discharge for homogenous section dam
|
Scenario |
Range of total head (m) |
Seepage flows (m3/sec) |
Percentage of Seepage increased |
|
(S-1-1) |
10.5-18.0 |
1.32E-07 |
0.000 |
|
(S-1-2) |
10.5-18.0 |
4.92E-07 |
2.727 |
|
(S-1-3) |
10.5-18.0 |
2.09E-07 |
0.587 |
|
(S-1-4) |
10.5-18.0 |
6.52E-07 |
3.951 |
Table 3. Percentage increase in seepage discharge for zoned section dam
|
Scenario |
Range of total head (m) |
Seepage flows (m3/sec) |
Percentage of Seepage increased |
|
(S-2-1) |
10.5-18.0 |
8.467E-08 |
0.000 |
|
(S-2-2) |
10.5-18.0 |
1.543E-07 |
0.822 |
|
(S-2-3) |
10.5-18.0 |
1.291E-07 |
0.525 |
|
(S-2-4) |
10.5-18.0 |
1.886E-07 |
1.227 |
5.3 XY-Gradient
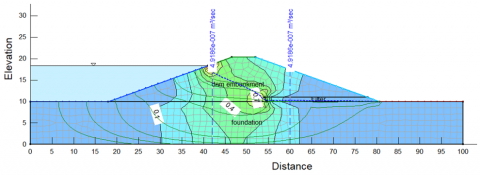
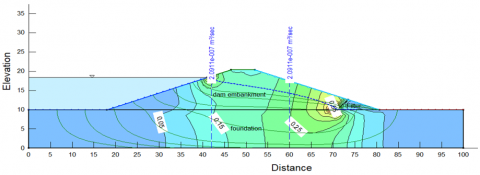
Using the SEEP/W software, the XY-Gradient (the value of the Gradient considering the total dam body) is computed for all the selected scenarios for maximum pool water level (8.4 m). The results of XY-Gradient distribution for homogenous and zoned dam sections i.e. for all considered scenarios (S-1-1 to S-2-4) are included in Figures 14 to 21 and their summary are recorded in Tables 4 and 5. The results show that the XY-Gradient changed in value depending on the location of calculation, if no filter is used; XY-Gradient appeared with the highest value that located at toe location (for homogenous dam) and at near the top middle of the core (for zoned dam) as shown in Figures 14 and 15. When filter is used; XY-Gradient appeared with the highest value at entering the filter or at near the top middle of the core (for zoned dam). Considering availability of filter, minimum value of XY-Gradient at entering the filter was found with scenario (S-2-3). The results of XY-Gradient could be summrized in Tables 4 and 5.
Table 4. Summary of the XY-Gradient values for selected filters, for homogenous dam section
|
Scenario |
Filter type |
Range of XY-Gradient (m) |
|
(S-1-1) |
without |
0.02-0.36 |
|
(S-1-2) |
horizontal |
0.10-0.70 |
|
(S-1-3) |
Toe |
0.05-0.55 |
|
(S-1-4) |
chimney |
0.20-0.60 |
Table 5. Summary of the XY-Gradient values for selected filters, for zoned dam section
|
Scenario |
Filter type |
Range of XY-Gradient (m) |
|
(S-2-1) |
without |
0.05-0.45 |
|
(S-2-2) |
horizontal |
0.20-1.60 |
|
(S-2-3) |
Toe |
0.05-0.70 |
|
(S-2-4) |
chimney |
0.20-1.60 |
Figure 8. Flow net and total head distribution for homogenous dam with horizontal filter; scenario (S-1-2)
Figure 9. Flow net and Total head distribution for homogenous dam with toe filter; scenario (S-1-3)
Figure 10. Flow net and total head distribution for homogenous dam with chimney filter; scenario (S-1-4)
Figure 11. Flow net and total head distribution for zoned dam with horizontal filter; scenario (S-2-2)
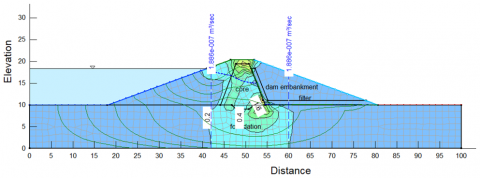
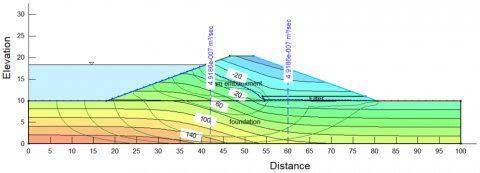
Figure 12. Flow net and total head distribution for zoned dam with toe filter; scenario (S-2-3)
Figure 13. Flow net and total head distribution for zoned dam with chimney filter; scenario (S-2-4)
Figure 14. Flow net and XY-Gradient distribution for homogenous dam without filter; scenario (S-1-1)
Figure 15. Flow net and XY-Gradient distribution for zoned dam without filter; scenario (S-2-1)
Figure 16. Flow net and XY-Gradient distribution for homogenous dam with horizontal filter; scenario (S-1-2)
Figure 17. Flow net and XY-Gradient distribution for homogenous dam with toe filter; scenario (S-1-3)
Figure 18. Flow net and XY-Gradient distribution for homogenous dam with chimney filter; scenario (S-1-4)
Figure 19. Flow net and XY-Gradient distribution for zoned dam with horizontal filter; scenario (S-2-2)
Figure 20. Flow net and XY-Gradient distribution for zoned dam with toe filter; scenario (S-2-3)
Figure 21. Flow net and XY-Gradient distribution for zoned dam with chimney filter; scenario (S-2-4)
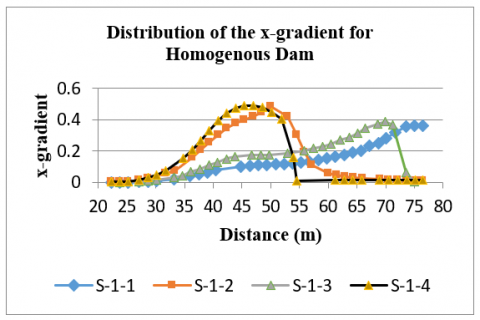
Figure 22. Comparison of the X-Gradient distribution for for homogenous dam
Figure 23. Comparison of the X-Gradient distribution for zoned dam
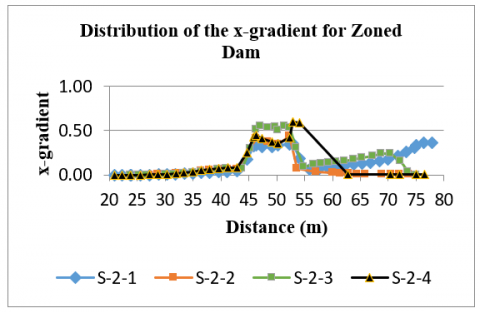
5.4 X-Gradient
Figures 22 and 23 show a graphical relationship for X-Gradient as function of distance along the considered homogenous and zoned sections respectively.
The X-Gradient was calculated at section of height 12.5 m above the dam foundation. It can be noticed that the values of X-Gradient are found at the downstream exit point which are ranged (0.05) and (0.6). The X-Gradient and exit gradation falls within the permissible limits i.e. less than unity for all scenarios and in all selected sections for the study; therefore it also complies with the safety standards of the dam.
5.5 Factors of safety against piping
A dam is consisted of different parts such as embankment, core, cutoff, foundation etc. In fact, not all these parts under same level of safety; some parts, especially downstream toe location, are more critical areas that are exposed to different types of problems such as blowouts, piping and excessive seepage. These more critical areas can be evaluated for the potential piping by seepage analyses. Nowadays, SEEP/W is relied on by a number of researchers around the world; however, SEEP/W does not directly equip the user with the value of factors of safety against piping, but rather equips the user with the required data (gradients at nodes of the mesh) that enables the user to calculate factors of safety against piping for both vertical and horizontal directions.
Factor of safety against vertical piping at the seepage exit can be determined by the equation below:
FSVertical= gravitational pressure / seepage pressure; which leads to:
$F S_{\text {Vertical }}=\left(\frac{\Upsilon_{\mathrm{sub}}}{\mathrm{i} \Upsilon_{\mathrm{w}}}\right)$ (4)
where, i is the hydraulic gradient, γw is the unit weight of water, and γsub is the submerged unit weight of the soil (the saturated unit weight minus the unit weight of water).
According to the soil and seepage conditions, a minimum computed factor of safety may range 1.5 to 5.0 [16-18].
In present work, minimum computed value of factor of safety against vertical piping is found to be 6.88 for homogenous dam without filter; scenario (S-1-1). Table 7 shows the values of factor of safety against vertical piping for all selected scenarios.
The factor of safety against horizontal piping can be calculated based on critical gradient and seepage gradient shown below
$F S_{\text {Horizontal }}=\left(\frac{i_{\text {critical }}}{i}\right)$ (5)
where,
$i_{\text {critical }}=$= critical cradient; which is equal one.
5.5.1 Calculated factors of safety against vertical and horizontal piping
The developed seepage model was used with all selected scenarios to investigate the factors of safety against vertical and horizontal piping.
For vertical piping, ten nodes were evaluated along the first 6.0 m of the downstream toe along surface and up to 2.5 m of depth, Figures 24 and 25 show the locations of the selected nodes for scenarios (S-1-1) and (S-1-3) as examples. The vertical hydraulic gradients were measured at each node; their average values were considered and used to estimate the factors of safety against vertical piping. Table 6 shows the recorded vertical hydraulic gradients of each of the evaluated nodes.
For horizontal piping, the exit and critical hydraulic gradients were used to estimate factor of safety against horizontal piping. The exit hydraulic gradients were measured at exit points; where the seepage water exits from the dam body to the filter.
Table 7 shows the hydraulic safety of consider RWH dam against vertical and horizontal piping.
The results (Table 7) indicated that all scenarios give safety condition against horizontal and vertical piping.
Figure 24. Location of the evaluated nodes for scenarios (S-1-1)
Table 6. Vertical hydraulic gradient at the selected nodes
|
(S-1-1) |
(S-1-2) |
(S-1-3) |
(S-1-4) |
(S-2-1) |
(S-2-2) |
(S-2-3) |
(S-2-4) |
|
y -1 |
y -2 |
y -3 |
y -4 |
y -5 |
y -6 |
y -7 |
y -8 |
|
0.2643 |
0.0179 |
0.0589 |
0.0209 |
0.2306 |
0.0126 |
0.0382 |
0.013 |
|
0.2312 |
0.0139 |
0.0414 |
0.0165 |
0.2091 |
0.0092 |
0.0269 |
0.0097 |
|
0.1303 |
0.0135 |
0.0457 |
0.0158 |
0.1706 |
0.0097 |
0.0298 |
0.0102 |
|
0.2095 |
0.0152 |
0.0474 |
0.0179 |
0.1935 |
0.0105 |
0.0309 |
0.0110 |
|
0.1402 |
0.0100 |
0.0358 |
0.0116 |
0.1268 |
0.0075 |
0.0233 |
0.0078 |
|
0.1490 |
0.0107 |
0.0369 |
0.0125 |
0.1361 |
0.0079 |
0.0240 |
0.0082 |
|
0.1067 |
0.0077 |
0.0282 |
0.0088 |
0.0960 |
0.0059 |
0.0184 |
0.0061 |
|
0.1115 |
0.0080 |
0.0290 |
0.0093 |
0.1017 |
0.0061 |
0.0189 |
0.0063 |
|
0.0828 |
0.0059 |
0.0223 |
0.0068 |
0.0749 |
0.0046 |
0.0145 |
0.0048 |
|
0.0858 |
0.0062 |
0.0229 |
0.0071 |
0.0776 |
0.0047 |
0.0149 |
0.0049 |
|
i average of 10 point |
|||||||
|
0.15113 |
0.0109 |
0.03685 |
0.01272 |
0.14169 |
0.00787 |
0.02398 |
0.00822 |
Table 7. Hydraulic safety of RWH dam against vertical and horizontal piping
|
Scenario No. |
Scenario Name |
i exit |
i critical |
FSHorizontal |
γw (g/cm3) |
i average of 10 point |
γsub (g/cm3) |
FSVertical |
|
1 |
(S-1-1) |
0.36 |
1 |
2.777 |
1 |
0.15113 |
1.04 |
6.88 |
|
2 |
(S-1-2) |
0.70 |
1 |
1.428 |
1 |
0.0109 |
1.04 |
95.41 |
|
3 |
(S-1-3) |
0.55 |
1 |
1.818 |
1 |
0.03685 |
1.04 |
28.22 |
|
4 |
(S-1-4) |
0.40 |
1 |
2.500 |
1 |
0.01272 |
1.04 |
81.76 |
|
5 |
(S-2-1) |
0.35 |
1 |
2.857 |
1 |
0.14169 |
1.04 |
7.34 |
|
6 |
(S-2-2) |
0.2 |
1 |
5.000 |
1 |
0.00787 |
1.04 |
132.15 |
|
7 |
(S-2-3) |
0.30 |
1 |
3.333 |
1 |
0.02398 |
1.04 |
43.37 |
|
8 |
(S-2-4) |
0.2 |
1 |
5.000 |
1 |
0.00822 |
1.04 |
126.52 |
|
γw |
Unit Weight of Water |
|||||||
|
γsub |
submerged unit weight of the soil; (γsub)= the saturated unit weight minus the unit weight of water |
|||||||
|
FSHorizontal |
Factor of Safety against Vertical Piping= i critical/ i exit; acceptable minimum FSHorizontal=1 |
|||||||
|
FSVertical |
Factor of Safety against Horizontal Piping = γsub / i average of nod * γw; acceptable minimum FSVertical=4 |
|||||||
|
i average of 10 point |
Average value of vertical hydraulic gradient at the selected nodes |
|||||||
Figure 25. Location of the evaluated nodes for scenarios (S-1-3)
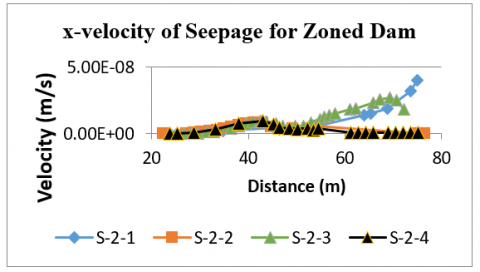
5.6 Seepage velocity
Seepage velocity was measured at section of height 12.5 m of the foundation bottom for both of homogenous and zoned dam section.
The results (Figures 26 and 27) show that the value of seepage velocity changes according to the type of dam section, the presence or absence of the filter, and the change in the type of filter, this can be explained as follows: The seepage velocity at homogenous section is greater than of zoned section for all selected scenarios.This is true, where the path of the phreatic line does not face any additional resistance or obstacle neither changing in soil permeability through the homogenous section.
For homogenous dam section (Figure 26), seepage velocity is at the lowest value when the filter is not used (scenario S-1-1).
For using different type of filter, seepage velocity changes too; and the seepage velocity increases or decrease depending on the type of filter; minimum value of seepage velocity found with the toe type filter (S-1-3), then increases with using horizontal filter (S-1-2), and maximum value of seepage velocity found with the chimney filter (S-1-4). This is true due to the variation in the size of the filter and its location inside the dam body, where the pressure at filter is equal to zero, in addition to the fact that the permeability coefficient of the filter is greater than of the dam embankment, as a result, the water passes easily and faster inside the filter.
For zoned section (Figure 27), the phreatic line is faced the core of dam; the core consists of fin soil particles of clay with permeability lower than of soil embankment of dam; which leads to a decrease in the seepage velocity. For upstream dam embankment; through distance from 22 to 50 meters (Figure 27), the behavior of seepage velocity is similar to velocity behavior of homogeneous section, but with lower velocities values, where the seepage velocity increases according to the following sequence of scenarios S-2-1, S-2-2, S-2-3, and S-2-4 respectively. For scenario S-2-4, at horizontal distance equal 50 m the velocity is reached about 3.54E-9, then start to drop reaching zero value at the horizontal distance 61 m; the effect of the filter is so clear on the flow of seepage that it cancels out any seepage flow in this location and therefore there is certainly no seepage flow above or down the measured section of seepage velocity; and the same is the case with scenario S-2-2 with a slight effect of capillary water.
While in scenario S-2-1, the seepage velocity is continued rising till reach maximum value of 4.02E-08 at horizontal distance equal 75 m; this is due to no filter available in this scenario to intercept the seepage, so the seepage water continues to progress to downstream of the dam section.
Figure 26. Comparison of the x-velocity distribution for homogenous dam
Figure 27. Comparison of the x-velocity distribution for zoned dam
Scenario S-2-3 has toe filter which is located at the same level of the measured section for seepage velocity, however, the velocity of seepage, at horizontal distance equal 51 m, start rising with maximum value lower than of scenarios S-2-1 and higher than of scenarios S-2-2 and S-2-4 respectively. For the area within the filter the velocity of seepage is decreased where the toe filter collects all seepage water.
5.7 Pore water pressure
Terzaghi (1923) was first documented the influence of pore water pressure on the soils properties. Pore water pressure is defined as the pressure of water in the voids between soil particles. Using different types of filters (horizontal, toe and chimney) within the seepage model, the position of phreatic line is changed comparison without filter. For all selected scenarios, the phreatic line is moved horizontally from the pool elevation toward downstream side slope, when filter is available, the phreatic line is intercepted and the zero pressure boundary is directed the most quantity of seepage water to the filter. For the scenarios without filter, (S-1-1 and S-2-1), the results show that pore water pressure distribution looks like same for the both homogenous and zoned dam sections (Figures 28 and 29); where pore water pressure ranged from positive value, of (160) near the dam foundation; which is under the phreatic line, to negative value of (-20) (above the phreatic line) and reached (-60) near dam crest. Figures 30 to 35 show the results of others selected sections.
Figure 28. Distribution of the pore water pressure for homogenous dam without filter; scenario (S-1-1)
Figure 29. Distribution of the pore water pressure for zoned dam without filter; scenario (S-2-1)
Figure 30. Distribution of the pore water pressure for homogenous dam with horizontal filter; (S-1-2)
Figure 31. Distribution of the pore water pressure for homogenous dam with toe filter; (S-1-3)
Figure 32. Distribution of the pore water pressure for homogenous dam with chimney filter; (S-1-4)
Figure 33. Distribution of the pore water pressure for zoned dam with horizontal filter; scenario (S-2-2)
Figure 34. Distribution of the pore water pressure for zoned dam with toe filter; scenario (S-2-3)
Figure 35. Distribution of the pore water pressure for zoned dam with chimney filter; scenario (S-2-4)
It is noted that the negative value of pore water pressure appears in the unsaturated region due to the effect of the capillary rise. For the scenarios with filter, (S-1-2 to S-1-4 and S-2-1 to S-2-4); through the Figures 30 to 32 and Figures 33 to 35, the results show that the different types of filter are lead to lowered the phreatic line and produced negative pore water pressure for the area above the used filter and lead to remove the seepage face from it.
In the present study, the SEEP/W model was used to explain the behavior of seepage through proposed RWH dam including homogenous and zoned earth dam types using different configuration scenario with three filters types (horizontal, toe and chimney) which show that:
* The individual condition of maximum water level (8.4m) in the reservoir of RWH dam shows that, for dams without filter, the minimum seepage discharge reaches 1.32*10-7 and 8.467*10-8 for homogenous and zoned dam type respectively.
* For same above condition, maximum seepage discharge reaches 6.52E-07 for homogenous dam type with chimney filter type; while it reaches 1.886E-007 for zoned dam type with chimney filter type.
* There is an important influence of the core of dam on seepage discharge which may reduce it by 55.8% through the dam body.
* Using filter, leads to increase seepage discharge; the percentage of increased of seepage reached 0.587-3.951 for homogenous dam type; while reached 0.525-1.227 for zoned dam type.
* Minimum value of seepage discharge occurs when using toe filter; while maximum value of seepage discharge occurs when using chimney filter.
* Using core, leads to increase the hydraulic gradient with all selected filters type.
* The RWH dam is safe against vertical and horizontal piping for the maximum pool water level of the reservoir (8.4 m).
* Phreatic line will change in position according to use the core and filter or one of them. After all, the RWH dam is in a safe condition as long as the phreatic line does not interrupt the downstream side slope, in addition there is no negative impact of piping.
* The results of this study recommend that the best configuration for a rainwater harvesting dam is to have a core in addition to a Toe type filter. The RWH dam will be under safety conditions, most engineering efficient and the least expensive to build.
Special thanks go to the Geo-Studio Team.
|
Kx |
horizontal hydraulic conductivity, m.day-1 |
|
Ky |
vertical hydraulic conductivity, m.day-1 |
|
H |
hydraulic head, m |
|
Q |
seepage discharge, m3.sec-1 |
|
t |
time N-domain |
|
θ |
volumetric water content, m3.m-3 |
|
i |
hydraulic gradient, m. m-1 |
|
$F S_{\text {Horizontal }}$ |
factor of safety against horizontal piping |
|
$F S_{\text {Vertical }}$ |
factor of safety against vertical piping |
|
$\boldsymbol{i}_{\text {critical }}$ |
critical cradient; which is equal one |
|
i average of 10 point |
Average value of vertical hydraulic gradient at the selected nodes, m. m-1 |
|
Greek symbols |
|
|
γw |
unit weight of water, g.cm-3 |
|
γsub |
submerged unit weight of the soil, g.cm-3 |
[1] Al-Ansari, N., Ezz-Aldeen, M., Knutsson, S., Zakaria, S. (2013). Water harvesting and reservoir optimization in selected areas of South Sinjar Mountain, Iraq. Journal of Hydrologic Engineering, 18(12): 1607-1616. https://doi.org/10.1061/(ASCE)HE.1943-5584.0000712
[2] ASTM, American Society of Testing and Materials. (2002). Standard Terminology Relating to Soil, Rock, and Contained Fluids, ASTM, West Conshohocken, PA, USA.
[3] Murthy, V.N.S. (2002). Geotechnical engineering: Principles and practices of soil mechanics and foundation engineering. Boca Raton, FL: CRC Press.
[4] Fukuchi, T. (2016). Numerical analyses of steady-state seepage problems using the interpolation finite difference method. Soils and Foundations, 56(4): 608-626. https://doi.org/10.1016/j.sandf.2016.07.003
[5] Hnang, T.K. (1996). Stability analysis of an earth dam under steady state seepage. Computers & Structures, 58(6): 1075-1082. https://doi.org/10.1016/0045-7949(95)00230-8
[6] Tayfur, G., Swiatek, D., Wita, A., Singh, V.P. (2005). Case study: Finite element method and artificial neural network models for flow through Jeziorsko earthfill dam in Poland. Journal of Hydraulic Engineering, 131(6): 431-440. https://doi.org/10.1061/(ASCE)0733-9429(2005)131:6(431)
[7] Al-Shukur, A.H.K., Badea’Mahmoud, R. (2019). Failure of zoned earth dam (An analysis of earth dam break). Journal of University of Babylon for Engineering Sciences, 27(1): 344-353.
[8] Al-Janabi, A.M.S., Ghazali, A.H., Ghazaw, Y.M., Afan, H.A., Al-Ansari, N., Yaseen, Z.M. (2020). Experimental and numerical analysis for earth-fill dam seepage. Sustainability, 12(6): 2490. https://doi.org/10.3390/su12062490
[9] Beiranvand, B., Komasi, M. (2021). An Investigation on performance of the cut off wall and numerical analysis of seepage and pore water pressure of Eyvashan earth dam. Iranian Journal of Science and Technology, Transactions of Civil Engineering, 45(3): 1723-1736. https://doi.org/10.1007/s40996-021-00613-y
[10] Brontowiyono, W., Hammid, A.T., Jebur, Y.M., Al-Sudani, A.Q., Mutlak, D.A., Parvan, M. (2022). Reduction of seepage risks by investigation into different lengths and positions for cutoff wall and horizontal drainage (Case study: Sattarkhan Dam). Advances in Civil Engineering, 2022: 6441646. https://doi.org/10.1155/2022/6441646
[11] Sun, Y., Li, Z., Yang, K., Wang, G., Hu, R. (2023). Analysis of the influence of water level change on the seepage field and stability of a slope based on a numerical simulation method. Water, 15(2): 216. https://doi.org/10.3390/w15020216
[12] Musa, N. (2018). Dam Design for rainwater harvesting works for selected catchment at Mosul city. Unpublished diploma thesis. University of Mosul.
[13] Seepage Modelling with SEEP/W. (2012). GEO-SLOPE International Ltd, Calgary, Alberta, Canada T2P 2Y5 Web: http://www.geo-slope.com.
[14] Arshad, I., Babar, M.M. (2014). Finite element analysis of seepage through an earthen dam by using geo-slope (SEEP/W) software. International Journal of Research (IJR), 1(8): 612-619.
[15] Irzooki, R.H. (2016). Computation of seepage through homogenous earth dams with horizontal toe drain. Engineering and Technology Journal, 34(3 part): 430-440. https://doi.org/10.30684/etj.34.3A.1
[16] U.S. Army Corps of Engineers. (1986). Seepage Analysis and Control for Dams. EM 1110-2-1901, September 30.
[17] Garai, J. (2016). Hydraulic failure by heave and piping. In Eighth International Conference on Scour and Erosion (ICSE-8), pp. 427-431).
[18] Al-Hadidi, M.T., Hashim, S.H. (2021). Finite element analysis of seepage for Kongele earth dam Using Geo-Studio software. Journal of Physics: Conference Series, 1895(1): 012003. https://doi.org/10.1088/1742-6596/1895/1/012003