Ghassan M. Suleiman | Mohammad K. Younes* | Murat Ergun | Khaled Al Omari
© 2021 IIETA. This article is published by IIETA and is licensed under the CC BY 4.0 license (http://creativecommons.org/licenses/by/4.0/).
OPEN ACCESS
Traffic accidents present a serious problem for both developed and developing countries and have become an urgent matter to tackle in all large metropolitan areas. This study aims to perform a deep comprehensive analysis of the traffic accidents issue in Istanbul, one of the world’s most populous cities. The accidents were classified and its intensities were presented on Istanbul map using a GIS tool. Furthermore, the performance of Negative Binomial Regression analysis and Adaptive Neuro-Fuzzy Inference System (ANFIS) model was assessed. Data collection of independent variables included distribution of trips, percentage of street parking, rate of car ownership, street density and population density. Trips were divided into three categories, passenger car, minibus and bus trips. The results showed that four legs intersection got the highest proportion of accidents among the other types with (40%). It also demonstrated that increasing both the percentage of bus trips and the percentage of street parking will decrease the traffic accident rate. Furthermore, the implementation of ANFIS model increased the accuracy of forecasts and reduced errors more than the regression model.
GIS and traffic, ANFIS, traffic modeling, traffic regression analysis, traffic accidents
Growing urban traffic congestion has become a serious problem in all large metropolitan areas, impacting flow speed and safety of transportation, causing travel delays and having significant negative implications on economies. More than 1.25 million people die each year as a result of road traffic accidents [1], according to a 2015 report by the World Health Organization (WHO). Studies are being heavily conducted to investigate metropolitan area accidents and their causes. In one such research, weather and other environmental factors have been analysed to model traffic accidents. The degree of correlation between the number of injuries and weather variables varies according to the type of road (motorways, rural roads or urban roads) [2]. In another study, use of communication technologies like
As urban planning parameters, the percentage of green area has also been shown to have a positive impact on traffic reduction while both intersections and population density increase the traffic accident rate [4]. In addition, human, car and road factors are all mutually correlated with the severity of accidents [5]. However, ANFIS was implemented to predict traffic hot spots on rural roads [6]. Also, ANFIS has been used to evaluate the impacts of intelligent transportation systems and technologies on number of road accident fatalities [7]. Moreover, ANFIS was used for prediction of traffic accidents [8].
However, comparing the performances of mathematical, artificial intelligence and statistical methods seems useful technique and capable to infer meaning from complicated and ambiguous data. For instance, in order to predict the frequency of freeway accidents the performances of negative binomial regression and artificial neural network were evaluated and compared [9]. The negative binomial regression modeling can be used to identify significant traffic and geometric elements that tend to increase or decrease accident frequency [10].
In order to better display traffic accidents, Geographic Information System (GIS) which is defined as a tool for collecting, analyzing, and displaying information about areas of the earth [11] is used in this study. Large amounts of data can be simplified visually at both macroscopic and microscopic levels by the use of GIS software [12, 13]. The GIS was used as a management system for accident analysis and determination of hot spots with statistical analysis methods [14-16]. Moreover, the highest accidents potential hot spots were determined using GIS tool. The used parameters were number of accidents, fatalities and injured cases per accident [17]. The importance of this study is its ability to investigate Istanbul’s traffic accidents by means of different statistical, graphical and mathematical methods. Consequently, the traffic accidents issue in Istanbul is explained through graphical and mathematical equations and the results are compared with outputs of ANFIS model.
Istanbul is a major global city and the economic center of Turkey, producing 22% of the country’s total national GDP (average GDP per capita was about 9,127 USD in 2019). Rapid population growth since the 1950s – 4% annually (although at a slightly lower rate over the past 10 years) – and economic development have led to a surge in motorization in Istanbul. Personal vehicle ownership increased from 43 per 1,000 people in 1980 to 186 in 2019. Passenger cars account for the biggest portion of motorized trips in Istanbul with a share of 27.5%. Considering that the city is still at an early stage of vehicle ownership, this share is expected to rise sharply over the next two decades.
Asian and European sides of the Istanbul Strait are both highly urbanized although the European side accommodates more population and job opportunities. The city has a poly-centric structure and a linear pattern of development from the west to the east across the Strait. Unfortunately, there has been an urban sprawl towards the green northern part of the city in the past decade. The three bridges and Eurasia Tunnel crossing the Istanbul Strait are mostly used by personal cars; hence their expressways constitute the two main and trafficked corridors which have strongly influenced the direction of urban development. İstanbul Transportation Master Plan predicts nearly 35 million daily trips occur throughout the city. This huge amount of daily trip traffic causes nearly 50 accidents per day along the 50,000 km highway network. In Istanbul, 15,077 accidents happened in 2014. The accidents resulted in 376 deaths and 43,536 injuries. Data from 2014 was used in this study.
3.1 Mathematical modelling
For each one of Istanbul Metropolitan Area zones, data on traffic accidents, street density, trips distribution, car ownership, percentage of street parking and population density were obtained from relevant authorities in the city. Then, data processing and regression analysis were applied to classify the accidents as well as establishing possible mathematical relationships by using Statistical Package for the Social Sciences (SPSS) software. Negative binomial regression analysis was carried out to estimate traffic accident averages in each zone. The above model assumes that the variance of accident frequency is more than the mean [18]. This model is given below [13]
lnλi=βxi+εi (1)
where:
Ln=natural logarithm,
λi=expected traffic accident at zone level (accident/year),
β=estimate coefficients,
x=explanatory variable,
ε=error term.
3.2 Development of ANFIS model
ANFIS is a multilayer feed-forward network and performs a fuzzy logic function on incoming signals. To build the fuzzy logic structure, it is essential to (i) select the model inputs, (ii) determine the membership functions (MF), and (iii) generate the fuzzy rules [19]. The accuracy of the model’s performance was evaluated by using Root Mean Square Error (RMSE) [20, 21], shown in the expression below:
$R M S E=\sqrt{\sum_{i=1}^{n} \frac{\left(X_{t}-X_{o}\right)^{2}}{n}}$ (2)
where, Xt is actual output, Xo is predicted output, and n is the number of outputs.
3.3 Graphical analysis
Graphical analysis was used to provide an idea about the extent of traffic accidents problem in Istanbul metropolitan area using a GIS tool, and to investigate the possible distribution based on different classification types.
4.1 Graphical analysis
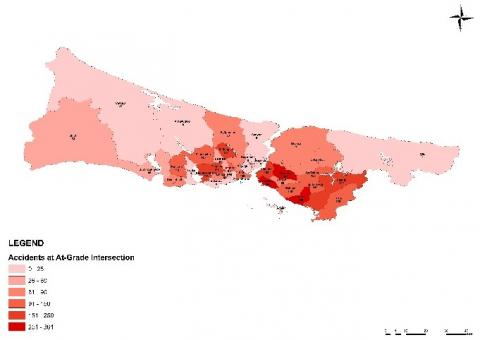
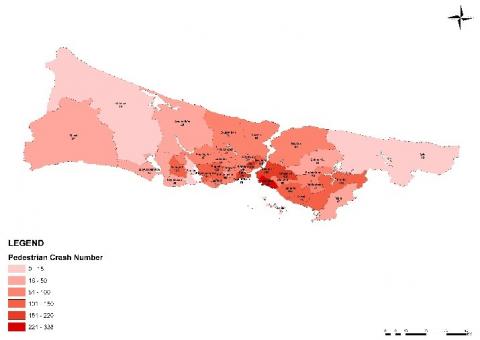
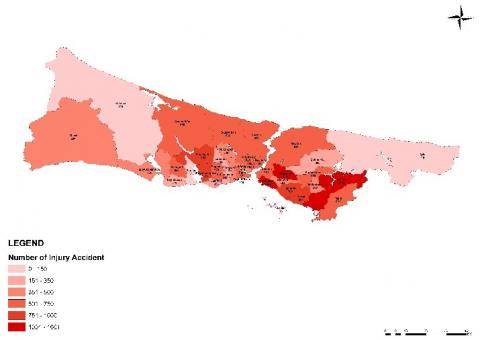
The analysis of accidents in Istanbul during 2018 showed that a total of 15,078 accidents occurred. The total number of fatalities and injuries in these accidents were 188 and 43,438, respectively. It can be seen that four-leg intersections tend to have a higher traffic accident probability, as shown in Figure 1. This result is logical because a four-leg intersection has more conflicts between traffic flows than any other type of intersection. In other words, cross-traffic conflicts at four-leg intersections will not occur at three-leg intersections. Overall, the average accident rate at four-leg intersections is slightly higher [4, 22]. Figure 2 showed the accidents at -at-grade-intersection map among Istanbul districts. Different classification of accidents like pedestrian-crash-number, injuries and fatal accidents were presented in Figure 3 to Figure 5 respectively.
Figure 1. Distribution of accidents based on intersection type
Figure 2. Traffic accidents at-at-grade-intersection density map
Figure 3. Pedestrian-crash-number/zone for Istanbul districts
Figure 4. Fatal-number/zone for Istanbul districts
Figure 5. Injury-accidents-number/zone for Istanbul districts
Table 1 interprets the data used in the analysis statistically. As can be seen from this table, population density varied from 103 to 1,276 persons / km2 and street density ranged between 4.29 and 31.18 km/km2. In addition, bus trips made up 15% to 43% of total trips while the shares of car and minibus trips were in the ranges of 24% to 43% and 29% to 46%, respectively. Meanwhile, car ownership was found to have a lower value of 65 in Esenler zone, compared- with the highest value of 238 in Bakirkoy zone. Finally, the percentage of streets that were occupied by parking varied from 38% to 75% with a mean of approximately 59%.
Table 1. Descriptive statistics for included variables
|
Variable |
Unit |
Symbol |
Min. |
Max. |
Mean |
S |
|
Population Density |
Persons /1.000 m2 |
X1 |
103.79 |
1276.45 |
639.66 |
329.74 |
|
Street Density |
Km/km2 |
X2 |
4.29 |
31.18 |
17.59 |
8.45 |
|
Car Trips |
% |
X3 |
0.24 |
0.43 |
0.32 |
0.04 |
|
Minibus Trips |
% |
X4 |
0.29 |
0.46 |
0.36 |
0.05 |
|
Bus Trips |
% |
X5 |
0.15 |
0.44 |
0.32 |
0.07 |
|
Car owner. |
Car/1.000 people |
X6 |
65.00 |
238.00 |
119.72 |
49.37 |
|
Street parking |
% |
X7 |
38.00 |
75.00 |
58.69 |
10.76 |
|
Accidents |
Accidents /zone/year |
Y |
209.00 |
2014.00 |
492.70 |
345.86 |
4.2 Correlation analysis
Table 2 presents the correlation matrix for the variables included in this study. This table indicates that traffic accidents are negatively correlated with both the percentage of bus trips and the percentage of street parking in each zone. In addition, the percentage of car trips and car ownership were positively correlated with traffic accidents. The degree of correlations between traffic accidents and population density, street density and share of minibus trips were slightly smaller. The analysis illustrated that multicollinearity was found between car ownership and percentage of street parking. Urban zones with high car ownership rates may generate higher levels of parking demand; therefore, a high percentage of street parking is expected. Besides, the effect of car trips on traffic accidents was positive, but the effect of bus trips was negative. In other words, bus trips negatively played into the increase in traffic accidents. This may be justified by the relatively high speed of car trips in comparison with the slower speeds of buses. In addition, the numbers of car maneuvers and circulations were high, so more accidents would normally be anticipated.
Table 2. Correlation matrix for included variables
|
X1 |
X2 |
X3 |
X4 |
X5 |
X6 |
X7 |
Y |
|
|
X1 |
1.00 |
|||||||
|
X2 |
0.77 |
1.00 |
||||||
|
X3 |
-0.14 |
-0.11 |
1.00 |
|||||
|
X4 |
-0.22 |
-0.11 |
0.16 |
1.00 |
||||
|
X5 |
0.24 |
0.14 |
-0.74 |
-0.78 |
1.00 |
|||
|
X6 |
-0.29 |
-0.13 |
-0.08 |
-0.06 |
0.09 |
1.00 |
||
|
X7 |
0.37 |
0.37 |
-0.14 |
-0.05 |
0.13 |
0.67 |
1.00 |
|
|
Y |
0.10 |
0.06 |
0.35 |
0.29 |
-0.41 |
0.28 |
-0.42 |
1.00 |
4.3 Development of the general regression model
Regression analysis was carried out to develop a general traffic accident prediction model. Three groups of models were developed in this study. The first group included the trips’ distribution variables (X3, X4 and X5). Effects of population density (X1), car ownership (X6) and street parking (X7) were entered in the second group. The third group was a combination of all independent variables for a stepwise approach to develop the regression analysis model.
Analysis of the first group resulted in the following model:
Y=17606. X5-1.014 (3)
IY = Average yearly number of accidents /zone/year,
X5 = Percent of bus trips.
The models and its parameters were found to be significant at 95% confidence level. The percent of bus trips explained about 48% (R2 = 0.482) of traffic accident variations.
In the second group, effects of population, car ownership and percentage of street parking were determined. The obtained models were:
Y=2121.7* X7-1.667 (4)
Y=7331.5*e0.0004X1 X1-1.845 (5)
X1 = Population density,
X7 = Percentage of street parking.
The percentage of street parking (occupation of streets by parked vehicles) explained about 59% (R2 = 0.562) of the traffic accidents. Little improvement in explanatory power was obtained by introducing the population density variable (Eq. (3)). Using the percentage of street parking and population as independent variables explained 65.3% of accident variations (R2 = 0.654). Eqns. (2) and (3) and their parameters were significant at the 95% confidence level.
In the third group, stepwise regression analysis was carried out to develop a general traffic accident prediction model. Based on the regression analysis, the following model was obtained
Ln Y = 4.533+0.000335X1-0.605LnX5 -1.408X7 (6)
The above regression equation can be rewritten as:
Y=93.1X5-0.605 X7-1.408 e0.00035x1 (7)
where: Y = Average yearly number of accidents/zone/year,
X1 =Population density,
X5 =Percent of bus trips, and
X7 =Percentage of street parking.
The model and all parameters were significant at the 95% confidence level. Furthermore, the model explained about 80% of accident variations (N=32, R2=0.795, F=15.98, p=0.0001, RMSE=119.2). Explanatory variables of the percentage of bus trips and the percentage of street parking were found to have negative coefficients, indicating that the traffic accident rate will decrease as these variables increase. In fact, increasing the parking rate will lead to a decrease in street capacity because the right lane will be reserved for parking purposes.
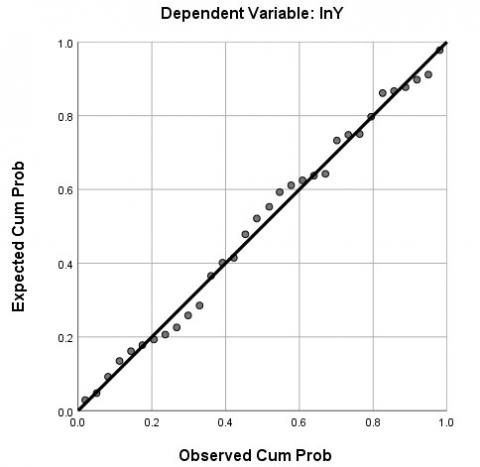
As a consequence, there will be a decrease in vehicle speeds, which is considered to be one of the most important causes of accidents, and eventually lower the accident rate. Likewise, with regard to the effect of bus trips, increasing them will trigger a reduction in the number of trips by cars and thus diminish the number of dangerous maneuvers and speeding attempts in the traffic stream. In other words, it is known that public transport buses in general travel within speed limits and stay on the right lanes, thus creating a safer travel environment than private vehicles and lower possibility of traffic accidents. In contrast, increase in population density would slightly raise the frequency of accidents at zone level. At the end, the Normal P-P Plot of Regression Standardized Residual was presented in Figure 6. From the figure, we can see that the residuals closely follow the diagonal which is the case for normal distribution.
Figure 6. Normal P-P Plot of regression standardized residual
4.4 Input selection for modelling of traffic accidents
In order to facilitate the modelling of traffic accidents, a systematic variance search was implemented to select the most influencing inputs using Matlab R2015. Thus, the input variables that may be considered as the main cause of traffic accidents in Istanbul city were divided into training and testing inputs. The odd readings were used as training inputs while the even inputs were used for testing. However, the model tested 98 possible combinations and used the RMSE to differentiate between and select the optimal input combinations that reduce the traffic accidents. The evaluated combinations were input-output, two inputs-output, three inputs-output and four inputs-output. In general, increasing the number of input variables reduces the RMSE, but complicates the modelling process. However, the optimum input-output combination that reduces the RMSE in this study is X1, X5, X7 (population density, percentage of bus trips and percentage of street parking).
So, ANFIS structure was modified to improve the modelling and reduce error. The modification was performed by evaluating Membership Function (MF) types, number of MF as well as data clustering and partitioning. Table 3 shows the performance of various MF (eight MFs). It also demonstrates the performance of various numbers of optimum MF. At this point, optimum inputs and a hybrid training algorithm were used for model development which was initiated by two membership functions and 10 epochs. The optimum MF type is a Pi shaped curved MF. Its testing RMSE equals to 62.74 while its checking RMSE is 101.12. However, Triangular MF gives almost the same results with RMSE 62.38 for testing and 103.82 for checking. The performance of a Pi shaped curved MF was evaluated by using 2-7 MF.
The best performance was obtained when two MF (Pi shaped curved) are used with RMSE = 62.38 for testing and 103.82 for checking. Furthermore, raising the number of MF decreases the testing RMSE, but it results- in a significant increase in checking RMSE, thus two Pi shaped curved MFs are considered to be the optimum model structure to simulate the accidents in Istanbul city. Furthermore, to improve the modelling, the model was trained by using 100 epochs (two Pi-shaped MF) with hybrid training and the results of RMSE for testing was improved by 3.6% (RMSEtesting = 60.45) and the one for checking by 2% (RMSEchecking = 98.88).
Table 3. Evaluation of function type and number
|
Function type |
RMSEtrain |
RMSEtest |
Function type |
RMSEtrain |
RMSEtest |
|
Triangular |
65.54 |
127.02 |
Trapez |
62.38 |
103.82 |
|
Gen. bell curve |
63.28 |
132.43 |
Gaus. curve |
63.67 |
131.97 |
|
2-sided Gaussian |
66.02 |
122.46 |
Pi-shaped curve* |
62.74 |
101.12 |
|
Comp. of difference Between two sigmoidal |
68.42 |
114.17 |
Product of 2 si |
68.7 |
123.7 |
|
Noof MF |
RMSEtrain |
RMSEtest |
No of MF |
RMSEtrain |
RMSEtest |
|
2 |
62.74 |
101.12 |
3 |
33.6 |
244.14 |
|
4 |
41.04 |
260.15 |
5 |
65.78 |
329.7 |
|
6 |
63.06 |
393.75 |
7 |
76.98 |
399.3 |
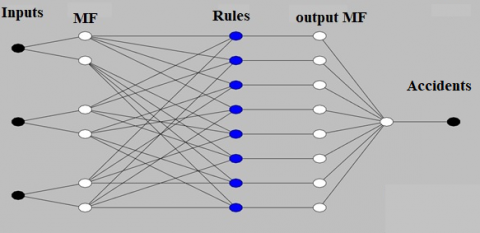
Figure 7 illustrates details of the modified final ANFIS structure for modeling traffic accidents at zone levels, comprising three inputs, two membership functions, eight fuzzy rules and the desired output. Figure 8 displays the effects of Population density, Street Parking and their impacts on number of accidents in 3-D. The value of traffic accidents is decreased from right to left with respect to population density. In other words, when population dropped from 1,400 to 200, the accident rate also fell due to the positive impact of population density on traffic accident generation. In contrast, the traffic accident rate climbed with a lower percentage of street parking, corresponding to the same result we obtained from the statistical analysis.
Figure 7. Final ANFIS structure for traffic accidents model
Figure 8. 3D Surface performance of population density and street parking
In this paper, impacts of some urban planning parameters on traffic accident generation in Istanbul metropolitan area have been analysed. However, several socioeconomic variables also have added effects on accident production rate. Therefore, modelling by using different methods to reach the best explanation for the issue of accidents is required. The statistical and ANFIS models that were developed in this paper can help traffic planners to formulate much-needed mitigation measures to reduce the frequency of traffic accidents. It showed fewer errors than statistical regression models. This study also demonstrates the consequences of urban planning features on the accident rate by analysing the effects of car ownership, street parking and travel distribution percentages as well as street and population densities. The results show that the percentage of bus trips and the percentage of properly street parking have a positive impact on reducing the traffic accident rate at the regional level while the population density has a negative effect on increasing the accidents. Finally, encouraging the use of public transportation instead of private vehicles and automated parking system will drastically reduce the traffic accidents in the city. For instance, adopting public transportation usage for each district and imposing taxes on some routes specially at peak hours as a motivation to use the public transit.
[1] World Health Organization. (2015). Global status report on road safety 2015.
[2] Bergel-Hayat, R., Debbarh, M., Antoniou, C., Yannis, G. (2013). Explaining the road accident risk: Weather effects. Accident Analysis & Prevention, 60: 456-465. https://doi.org/10.1016/j.aap.2013.03.006
[3] White, J., Thompson, C., Turner, H., Dougherty, B., Schmidt, D.C. (2011). Wreckwatch: Automatic traffic accident detection and notification with smartphones. Mobile Networks and Applications, 16(3): 285-303. https://doi.org/10.1007/s11036-011-0304-8
[4] Al-Masaeid, H.R., Suleiman, G. (2004). Relationships between urban planning variables and traffic crashes in Damascus. Road & Transport Research, 13(4): 63.
[5] Lee, J., Chae, J., Yoon, T., Yang, H. (2018). Traffic accident severity analysis with rain-related factors using structural equation modeling–a case study of Seoul City. Accident Analysis & Prevention, 112: 1-10. https://doi.org/10.1016/j.aap.2017.12.013
[6] Hosseinlou, M.H., Sohrabi, M. (2009). Predicting and identifying traffic hot spots applying neuro-fuzzy systems in intercity roads. International Journal of Environmental Science & Technology, 6(2): 309-314. https://doi.org/10.1007%2FBF03327634
[7] Rahimi, A.M. (2017). Neuro-fuzzy system modelling for the effects of intelligent transportation on road accident fatalities. Tehnicki vjesnik/Technical Gazette, 24(4): 1165-1171. https://doi.org/10.17559/TV-20151203230220
[8] Liu, M., Chen, Y. (2017). Predicting real-time crash risk for urban expressways in China. Mathematical Problems in Engineering, 2017: 6263726. https://doi.org/10.1155/2017/6263726
[9] Chang, L.Y. (2005). Analysis of freeway accident frequencies: Negative binomial regression versus artificial neural network. Safety Science, 43(8): 541-557. https://doi.org/10.1016/j.ssci.2005.04.004
[10] Poch, M., Mannering, F. (1996). Negative binomial analysis of intersection-accident frequencies. Journal of Transportation Engineering, 122(2): 105-113. https://doi.org/10.1061/(ASCE)0733-947X(1996)122:2(105)
[11] Chien, S., Li, G., Daniel, J. (2002). Geographic information system-based truck accident information and management system for New Jersey roadways. Transportation Research Record, 1818(1): 134-142. https://doi.org/10.3141/1818-20
[12] Hall, J.W., Pendleton, O.J. (1990). Rural accident rate variations with traffic volume. Transportation Research Record, (1281). http://worldcat.org/isbn/030905060X
[13] Al-Masaeid, H.R., Obaidat, M.T., Gharaybeh, F.A. (1997). Pedestrian accidents along urban arterial midblocks. Journal of Traffic Medicine, 25(3-4): 65-70.
[14] Erdogan, S., Yilmaz, I., Baybura, T., Gullu, M. (2008). Geographical information systems aided traffic accident analysis system case study: City of Afyonkarahisar. Accident Analysis & Prevention, 40(1): 174-181. https://doi.org/10.1016/j.aap.2007.05.004
[15] Shafabakhsh, G.A., Famili, A., Bahadori, M.S. (2017). GIS-based spatial analysis of urban traffic accidents: Case study in Mashhad, Iran. Journal of Traffic and Transportation Engineering (English edition), 4(3): 290-299. https://doi.org/10.1016/j.jtte.2017.05.005
[16] Gundogdu, I.B. (2010). Applying linear analysis methods to GIS-supported procedures for preventing traffic accidents: Case study of Konya. Safety Science, 48(6): 763-769. https://doi.org/10.1016/j.ssci.2010.02.016
[17] Ma, Z.Q., Pan, C.Z., Wang, Y.Q. (2008). Road safety evaluation from traffic information based on ANFIS. In 2008 27th Chinese Control Conference, pp. 554-558. https://doi.org/10.1109/CHICC.2008.4605560
[18] Poch, M., Mannering, F. (1996). Negative binomial analysis of intersection-accident frequencies. Journal of Transportation Engineering, 122(2): 105-113. https://doi.org/10.1061/(ASCE)0733-947X(1996)122:2(105)
[19] Sulaiman, G., Younes, M.K. (2018). Modelling of traffic emissions using modified synchro-anfis integrated model on traffic signals. Feb-Fresenius Environmental Bulletin, 8308.
[20] Antanasijević, D.Z., Pocajt, V.V., Povrenović, D.S., Ristić, M.D., Perić-Grujić, A.A. (2013). PM10 emission forecasting using artificial neural networks and genetic algorithm input variable optimization. Science of the Total Environment, 443: 511-519. https://doi.org/10.1016/j.scitotenv.2012.10.110
[21] Willmott, C.J., Matsuura, K. (2005). Advantages of the mean absolute error (MAE) over the root mean square error (RMSE) in assessing average model performance. Climate Research, 30(1): 79-82. 10.3354/cr030079
[22] Crowe, E.C. (1990). Traffic conflict values for three-leg, unsignalized intersections. Transportation Research Record, (1287). http://worldcat.org/isbn/0309050626