Seiyed Maryam Hosseiny* | Akram Isvand Rahmani | Morad Derakhshan
© 2020 IIETA. This article is published by IIETA and is licensed under the CC BY 4.0 license (http://creativecommons.org/licenses/by/4.0/).
OPEN ACCESS
Nowadays computer networks are play a major role in the communication and transmission of information, however increasing security threats in computer networks is one challenging concern that has received lot of attention in the computer science field. Intrusion detection systems help increase security by detecting or preventing attacks on computer networks and play an effective role in providing security. Therefore, design and implement an effective Intrusion Detection Systems (IDS) is important. In this paper we propose a new method of intrusion detection system based on grasshopper optimization algorithm (GOA) for eliminating undesirable features is presented. In this way, after decreasing the feature by grasshopper algorithm and finding the optimal features, the attacks are classified as normal and abnormal using the decision tree. Experiments have been performed on the NSL-KDD dataset. The results show that the proposed method has higher accuracy and precision than other methods of PSO, Genetics and ACO and has increased accuracy and speed in attack detection.
intrusion detection system, grasshopper optimization algorithm, nearest neighborhood
In today’s world, computer and computer networks connected to the internet play a major role in communication and communication. Among these, manipulators with access to important information centers or other people’s information and with the intention to exert influence or exert pressure or even to disturb the system order have taken the action of exceeding computer systems. Therefore, it is necessary to maintain information security and maintain efficiency in computer networks connected with the outside world. Since it is virtually impossible to create computer programs (ware and software) without weaknesses and security failures, intrusion detection in computer - based researches is of particular importance.
Intrusion detection systems (IDS) are used to help security managers in the system to detect intrusions and attacks. The purpose of an intrusion detection system is not to prevent attacks and is the only discovery and possibility of detecting attacks and detecting security failures in the system or computer networks and declaring it to the system administrator. Generally, intrusion detection systems are used by fire walls and as a security supplement to them.
Digital security tools can be viewed as equivalent to physical security tools. For example, if we consider the information we have in our network as confidential documents in a house, the firewall has a key role to lock. Indeed, locking horns have the role of deterrence and prevention of influence, but they are not alarming in the event of intrusion, but the role of intrusion detection is like the installed alarm clock in the house to prevent its occurrence, but warned the system that the intrusion is under way. Removing undesirable features from feature sets is introduced as an appropriate strategy to reduce the data set for intrusion detection. The selection problem of a subset is defined as the identification and selection of a useful subset of tuples from the original dataset.
In general, various researches and researches have been carried out on intrusion detection systems in different fields and is currently under way in the field of intrusion detection. Therefore, some of the challenges posed in this field and the researches done in each case have been mentioned. Objective (s): the objective of this study was to determine the accuracy of the proposed method. The main idea is that the decision tree is partitioned into infiltration data and classification of various types of denial - of - service attacks. The proposed method has improved detection of intrusion attacks. In a research we reviewed the decision tree based algorithm for intrusion detection. The proposed algorithm is based on feature selection and value division. The results show that this algorithm can be used to detect signatures based on signature. Previous studies have focused on the detection system of smart attacks. In this paper, a combination of applied machines learning techniques is proposed on a rich set of features extracted from a large dataset of malicious and malicious files by means of extracting custom features. A rich set of features of each file and support vector tool, decision tree and increased decision tree to obtain the highest possible detection rate was extracted and also a cloud based cloud architecture that hosts the amazon service was introduced to meet the needs of the identification method. The proposed method was tested in different scenarios and achieved results that were generated by energy consumption of the host device [1]. Using this algorithm, only a few labeled samples are needed, while the detection result is at high level. Also, a general framework was proposed by analyzing independent component that reduces the limited conditions of participation. Finally, we prove the effectiveness of this model [2].
The researchers performed influence detection using a predictive algorithm of SVM. In the proposed method, the kernel function has been modified in the svm algorithm. In the proposed method, the data distance is lost to the data points according to data distance. These weights determine how close the data points are close to the backup vector. The proposed method performs better accuracy compared to the use of other kernel a function with better accuracy [3].
Using genetic algorithm, researchers propose an intrusion detection system in the learning phase, using network audit data to produce rules for intrusion detection. In the second stage, the highest fitness function and the best set of rules are used to diagnose the intruders in the internet. In the second phase, the highest fitness function and the best set of rules for diagnosis of intruders in the internet [4].
A feature selection using PSO and svm is presented in a method proposed by Manekar and Waghmare [5] so that after pre - processing and normalization of data, the feature selection was performed by the PSO. Finally, we used svm classifier to classify normal and abnormal attacks. In order to verify the accuracy of the proposed method, the accuracy of the proposed method is evaluated.
In another study presented by Desale and Ade [6] using of genetic optimization was introduced. In this experiment, which was done on the NSL - KDD datasets, normalization of data and selection of property by genetic algorithm using classifier was calculated to classify normal and abnormal attacks. The highest accuracy of this method is predicated on the detection of attacks and their classification.
An attribute selection [7] was developed using the Ant Colony Optimization (ACO). In this method, after preprocessing and selection of optimal features has been done by ACO. The highest classification rate is equal to the set of the cup 99 and NSL - KDD data set.
An examination of the above-stated methods and the collected data on intrusion detection systems reveal that many of the features are ineffective, useless in attack scenarios, or irrelevant features. Eliminating inappropriate features from the feature set is a convenient way to reduce the data set of intrusion detection systems. The issue of selecting a subset of features is the identification and selection of a useful subset of features from the original data set. In this paper, the study and research has focused on the method of reducing the dimensions and their effect on penetration detection [8]. The aim of this study is to improve the accuracy of classification, increase detection rate accuracy and reduce the false alarm rate in inhalation detection systems.
Therefore. In this paper we propose a new method of intrusion detection system based on GOA for eliminating undesirable features is presented. In this way, after decreasing the feature by grasshopper algorithm and finding the optimal features, the attacks are classified as normal and abnormal using the decision tree. The striking point is that so far, such an algorithm has not been developed for the intrusion detection system, which we will elaborate on in the next section.
The remainder of the paper is described as follows: In the section 2, the effect of the GOA is to reduce the dimensions in intrusion detection systems. The sections 3 and 4 of the evaluation methods along with the results table and the comparisons and their analysis are presented respectively, and the overall conclusion is stated in section 5.
In this paper, the method of reducing the size and effect of them in the detection of penetration has been investigated. The aim of this study is to improve classification accuracy, increase the correct detection rate and reduce the false alarm rate in the influence detection systems using the hybrid approach of the GOA to reduce the dimension of the attribute decision tree. Finally, the attacks are classified as normal and abnormal using the decision tree.
2.1 Algorithm optimization algorithm
Optimization in old methods like optimization with mathematical algorithms is mainly based on information from derivative of objective function to find the optimal solution. Although it is still used by various researchers, it has some disadvantages. Mathematical optimization methods of falling into optimal local optimal solutions, i.e. the algorithm of a local optimum solution, as a general and global optimum solution, can be considered as a general and global optimum solution. Mathematically, mathematical equations are often used for problems that their derivatives are not known or derived.
The propeller optimization algorithm which mimics the behavior of swarm optimization in nature, therefore, is the propeller flight path under the influence of three components, which are mathematically represented by equation.
${{X}_{i}}={{S}_{i}}+{{G}_{i}}+{{A}_{i}}$ (1)
In the above equation, the position of the ith grasshopper, social interaction, the force of gravity on the ith grasshopper, the horizontal force of the wind is in the direction of the ith grasshopper. It is also noteworthy that Eq. (1) can be written as follows. It can be a random number between 0 and 1 [9].
Social interaction is the main purpose of the search for the GOA algorithm, which is calculated in Eq. (2):
$S_{i}=\sum_{i=1, j \neq i}^{N} s\left(d_{i j}\right) \hat{d}_{i j}$ (2)
In the above equation, the distance between the ith and jth grasshopper is defined as, as well, the unit vector of ith grasshopper to jth grasshopper, which is calculated as, and finally, s the power function of the social interaction that is expressed in Eq. (3).
$s(r)=f e^{\frac{-r}{l}}-e^{-r}$ (3)
Now, except G, which expresses the force of the grasshopper “s gravity, Eq. (4) is calculated in Eq. (4) as Eq. (4).
$G_{i}=-g \hat{e_{g}}$ (4)
In the above equation, g is the gravitational constant, a unit vector to the center of the earth.
Finally, component A, which expresses the horizontal force of the wind, is calculated in Eq. (5) as Eq. (5):
$A_{i}=u \widehat{e_{W}}$ (5)
Here, a constant drift is a unit vector in the wind direction.
Saremi and colleagues corrected the optimization algorithm as an equation [9], while the grasshoppers are interacting, (6).
$X_{i}^{d}=c\left(\sum_{j=1, j \neq i}^{N} c \frac{u b_{d}-l b_{d}}{s} s\left(\left|x_{j}^{d}-x_{i}^{d}\right|\right) \frac{x_{j}-x_{i}}{d_{i j}}+\hat{T}_{d}\right.$ (6)
In the above, upper bound in d, the lower bound in d, the best found solution so far and c is a reduction factor to shrink the comfort zone, pull zone and pull zone.
Therefore, it is an equation that linearly reduces the space that the grasshoppers have to discover and exploit.
Show whether a grasshopper should be repelled (exploration) or target.
After finding promising areas, exploitation forces the search agents to find a local search to find an accurate approximation of the overall optimization. To balance exploration and exploitation, the parameter c has to be reduced to fit the number of iterations. This mechanism increases the number of interactions. The coefficient c reduces the comfort zone to the number of interactions and is calculated as (7).
$c=\operatorname{cmax}-l \frac{\operatorname{cmax}-\operatorname{cmin}}{L}$ (7)
In fact, the maximum value is the minimum value that is equal to.
2.2 The decision tree classification
The decision tree algorithm is able to the qualitative variables in addition to quantitative variables. The result of the implementation of the decision - tree algorithm is a set of logical conditions (conditions then - if) with the tree structure used to predict an attribute. So that the data that fall in the leaves at the end of the tree. They are labeled by one of the values of the target attribute. The model does not require the default linear relationship between the independent and dependent variables due to its ease in interpreting the results and nonparametric and nonlinearities. The decision tree algorithm works in such a way that it tries to minimize the diversity or diversity (in terms of the target attribute) in the nodes. This lack of uniformity in the nodes is measurable using criteria of non - purity, which is most important and the most widely used indicator of Ginny. Often the difference in the types of decision - trees is the measurement of the purity, the method of ramification, and pruning of tree nodes.
C4.5 algorithm performs the classification by dividing the data into subsets containing the records of their parent, which are used in this study. C4.5, for instance, split the samples based on the field, which is the highest rate of information. It uses an incremental method of pruning trees to reduce the error classification error due to noise or too many details on the training data. Pruning by replacing the internal node with the leaf node occurs when the percentage is reduced or the error rate is reduced [10].
2.3 Feature reduction by GOA
In general, the higher the dimensions or the characteristics of the case study, the more dispersed the images in the search space. One of these methods is choosing a subset of attributes. In this method, features that lower their information value will be eliminated. For this reason, the number of attributes that will be ignored in this way is not high. Accordingly, we cannot select the selection operation below a set of attributes to solve problems that have a high number of features. It is also important in the selection of a subset of features to solve the problem of preserving the nature of the attributes in order to book the model interpretation. The feature selection is a binary optimization problem, as solutions are constrained to binary value [0, 1]. For this reason, the GOA [10] has been proposed to solve the problems with high dimensions of strategy - based approaches.
A binary characteristic selection method using the grasshopper algorithm was presented such that the grasshopper position is encoded in the search space. In this method a vector of attributes is shown in N with numbers 0 and one data (1).
Figure 1. Grasshopper position [11]
For example, in Figure 1 (1) Gi represent the feature vector, f1, f3, f4, f5, f8, f9, elective, f6, and f2 features. For the initial population in the proposed method, i. As Xi, (i = 1, 2… N).
It represents binary vector. The value allocated is Eq. (9):
$X_{i}^{j}(0)=\left\{\begin{array}{c}1, \text { if Rand }()>0.5 \\ 0, \text { else }\end{array}\right.$ (8)
In the above equation, the initial value of J - Min returns after i - grasshopper and rand takes some in the range [0, 1]. The fitness function is used to select optimal features and increase classification accuracy. Such accuracy increases the classification accuracy, and minimizes the number of selected features. the fitness function in (9) is used to select the independent features [11].
Fitness $=\alpha \times$ ErrorRate $+(1-\alpha) \times \frac{\# S F}{\# A L L F}$ (9)
In the above case, the error rate of the classifier is selected by means of a classifier. On the other hand, the percentage of false classification indicates the values that are between a and b, Sf indicates the choice given, while all _ f is all orthogonal. The value is used to control the quality of the classification and the length of the subset. In this method, amount is considered. The error of classification of predictions is calculated as false predictions based on the number of predictions between 0 and 1.
At the end, what can be summarized in the proposed method that is performed on the data related to the intrusion detection system, is done after pre - processing in order to normalize the data. Also, to reduce the property of the grasshopper algorithm to choose the best features. Then the decision - class C4.5 to the normal classification or abnormal of the data. it is noted that such a method has not been done on detection of penetration in the network.
This section includes implementation results of the methods for reducing the dimensions in the intrusion detection system. The first part of the data set is used with the data associated with it. The second part of the evaluation criteria is presented in the third part of selection of classification parameters. Finally, the results of the tests and comparisons as well as the conclusion are made in the fourth and fifth section.
To evaluate the proposed method, network traffic data collection is used. This data collection was collected by the Technology Unit and the MIT Lincoln Laboratory. The NSL - KDD data set (the 1999 improved dataset) was used in Table 1 in this paper. The dataset consists of 41 discrete and continuous features and each record (including a set of attributes) has a tag that specifies, the record is normal or one of the types of attacks. The selection of the NSL - KDD data set to the original dataset contains the advantage that it does not include the set of repeated records in the learning dataset so that the category does not bias over repeated records. These data sets include the DoS attacks, R2L, U2R and probe [12].
Table 1. Dataset information NSL-KDD [12]
|
Data Count |
Educational Data Collection (KDDtrain+) |
Set of experimental setups (KDDTest+) |
|
Normal |
67343 |
9711 |
|
Advance |
58630 |
12833 |
|
Total |
125973 |
22544 |
3.1 Measures of assessment
Reduction of reduced data from the methods proposed in the previous section by the C4.5 decision tree. Takes place. In this part, reduced data as training and test data are considered to be used for classification of data, cross - sectional authentication of 10. The evaluation criteria considered to investigate test data include accuracy, accuracy, G - mean and mean square error. First, we evaluate the evaluation criteria for the total dataset with 41 features, without reducing the dimensions. The results of this study are presented in Table 2. The accuracy of the class diagnosis consists of the number of attacks that are correctly identified divided by the total number of attacks related to that class, a positive error is the normal behaviors that have been detected, divided by the whole normal records. The experiments were carried out by Matlab software and 4 GB of original memory. In the investigation the accuracy of the data classification given by the C4.5 decision tree is tested and evaluated.
Also, the analysis is done based on different parameters such as how many seconds the classifier takes to construct the model, false-positive rate, true positive rate, and accuracy [13-15]. True Positive (TP) represents the examples that are correctly predicted as normal. True Negative (TN) shows the instances which are correctly predicted as an attack. False Positive (FP) identifies the instances which are predicted as an attack while they are not. False Negative (FN) represents the cases which are prefigured as normal while they are attacked in reality. Accuracy, Precision and Recall can be defined as the number of correct predictions. they can be computed using Eqns. (10), (11) and (12) [16-18].
Accuracy $=\frac{T P+T N}{N}$ (10)
Precision $=\frac{T_{P}}{T_{P}+F_{N}}$ (11)
Recall$=\frac{T_{P}}{T_{P}+F_{N}}$ (12)
In this section, the results are reported. First, the results of the meta-analysis without reducing the dimensions in the given dataset, i.e., are presented with a specification, are presented. The results of classification of c4.5 various features have been analyzed using tables and charts. The obtained results are compared with the results obtained from the best method with the proposed method in the detection of intrusion detection by genetic algorithm (GA) [6], particle swarm optimization [5] and algorithm ant colony optimization [7]. So, all results are obtained by a repetition-cycle of 100 times and the parameters cMAX = 2.079 and cMIN = 0.00004 [14, 19].
As can be found from Table 2, the DOS attacks with 41 features have the highest classification accuracy. Also, due to the values of accuracy, accuracy, G - means and mean square error obtained for this class, we can conclude that the class data with other classes is higher. Now for attributes with reduced dimensions, 18 features, 21 features and 29 features are presented in Table 3, Table 4 and Table 5.
What is found from the Table 3 is the superiority of accuracy and the G - mean attack against other attacks. The mean square error of the attack is lower than other attacks. Of course, with a greater number of iterations, the increase in these values is very high. The iteration number for these values is considered 200.
Table 2. Presents the results from the classifier with entries containing 41 features
|
Type of attacks |
Accuracy |
Recall |
G-mean |
Mean error squares |
|
Normal |
0.9298 |
0.9292 |
0.9314 |
0.0338 |
|
Probe |
0.941 |
0.9408 |
0.9493 |
0.0106 |
|
DOS |
0.9382 |
0.9344 |
0.9303 |
0.0129 |
|
R2L |
0.9406 |
0.9284 |
0.9348 |
0.0316 |
|
U2R |
0.9392 |
0.9349 |
0.9347 |
0.0249 |
|
Type of attacks |
Accuracy |
Recall |
G-mean |
Mean squared error |
|
Normal |
0.9269 |
0.9246 |
0.9255 |
0.0232 |
|
Probe |
0.9238 |
0.9238 |
0.9222 |
0.0197 |
|
DOS |
0.9337 |
0.9339 |
0.9329 |
0.0094 |
|
R2L |
0.934 |
0.9339 |
0.9345 |
0.009 |
|
U2R |
0.9293 |
0.9306 |
0.9343 |
0.0128 |
|
Type of attacks |
Accuracy |
Recall |
G-mean |
Mean squared error |
|
Normal |
0.9592 |
0.9644 |
0.9586 |
0.0239 |
|
Probe |
0.958 |
0.9603 |
0.9633 |
0.0191 |
|
DOS |
0.9595 |
0.9624 |
0.9616 |
0.0313 |
|
R2L |
0.9636 |
0.9663 |
0.9651 |
0.0168 |
|
U2R |
0.9603 |
0.9643 |
0.9649 |
0.0324 |
Table 5. Results from the classifier with entries containing 29 features
|
Type of attacks |
Accuracy |
Recall |
G-mean |
Mean squared error |
|
Normal |
0.9347 |
0.9451 |
0.9342 |
0.0469 |
|
Probe |
0.9395 |
0.9415 |
0.9347 |
0.0028 |
|
DOS |
0.9403 |
0.9369 |
0.9295 |
0.0424 |
|
R2L |
0.9375 |
0.9376 |
0.9336 |
0.0125 |
|
U2R |
0.9405 |
0.9453 |
0.9372 |
0.0084 |
Given the table (as shown in Table 1), it can be found that the accuracy, precision, and g - mean have a better outcome for the attack. However, the mean square error is more than other Attacks.
In addition, it can be found from the tables depicting the C4.5 as shown in Figure 2.
Figure 2. Results from the C4.5 decision tree classification for different number of Features
As seen in Figure 2, the best results of accuracy, precision, and g - mean and mean square error variances are obtained when the maximum error is obtained.
Figure 3. Fitness plot for GOA Algorithm
Under ideal conditions, when the number of attributes is 18, the proposed method works best by reducing the attribute. Therefore, when compared with other methods, 18 is the appropriate number to be considered.
Figure 3 shows the convergence diagram of the GOA method over 160 repetitions. Figure 3 shows the convergence diagram of the GOA method over 160 repetitions.
As shown in Figure 3, this graph converges to a constant value close to zero at 30 to 160 repetitions, indicating the very good performance of this method.
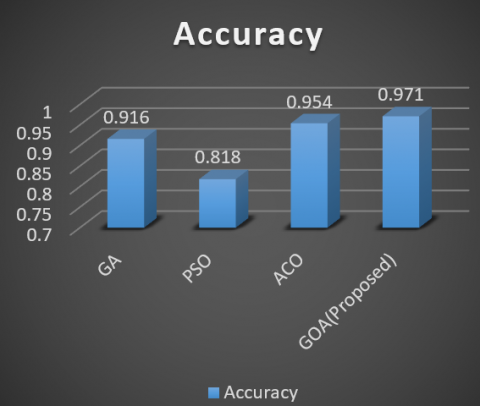
As shown in Figures 4~7, the proposed method has better performance than other methods. Whereas the ant colony method differs slightly from the second. The genetic method is also ranked third because of the random population and providing different solutions each time, which makes it different in terms of values. The PSO approach is ranked last as it takes into account the local and local situation of every particle and does not consider the optimal solution to other solutions.
Figure 4. Results from the different methods of classification of Probe attacks
Figure 5. Results from the various methods of classification of DOS attacks
Figure 6. Results from the different methods of classification of R2L attacks
Figure 7. Results from the different methods of classification of U2R attacks
In this study, using signature-based penetration detection systems and studying and examining their weaknesses and improving this model, the enhanced penetration detection system was proposed using the GOA. Attempts were made in the proposed system to fix the feature selection method that has a local optimization problem in the traditional method. It now utilizes the fit function tool in the proposed method. Moreover, different evaluation criteria were compared, which possess optimal performance compared to other reduced PSO, ACO and GA algorithms.
The results show that the proposed method is capable of detecting types of attacks and its performance results can be very useful when dimensions increase. In the future works, the proposed method can be tested on CIDDS dataset.
[1] Huda, S., Islam, R., Abawajy, J., Yearwood, J., Hassan, M.M., Fortino, G. (2018). A hybrid-multi filter-wrapper framework to identify run-time behaviour for fast malware detection. Future Generation Computer Systems, 83: 193-207. https://doi.org/10.1016/j.future.2017.12.037
[2] Mirza, Q.K.A., Awan, I., Younas, M. (2018). CloudIntell: An intelligent malware detection system. Future Generation Computer Systems, 86: 1042-1053. https://doi.org/10.1016/j.future.2017.07.016
[3] Yi, Y., Wu, J., Xu, W. (2011). Incremental SVM based on reserved set for network intrusion detection. Expert Systems with Applications, 38(6): 7698-7707. https://doi.org/10.1016/j.eswa.2010.12.141
[4] Paliwal, S., Gupta, R. (2012). Denial-of-service, probing & remote to user (R2L) attack detection using genetic algorithm. International Journal of Computer Applications, 60(19): 57-62.
[5] Manekar, V., Waghmare, K. (2014). Intrusion detection system using support vector machine (SVM) and particle swarm optimization (PSO). International Journal of Advanced Computer Research, 4(3): 808.
[6] Desale, K.S., Ade, R. (2015). Genetic algorithm based feature selection approach for effective intrusion detection system. In 2015 International Conference on Computer Communication and Informatics (ICCCI), pp. 1-6. https://doi.org/10.1109/ICCCI.2015.7218109
[7] Aghdam, M.H., Kabiri, P. (2016). Feature selection for intrusion detection system using ant colony optimization. IJ Network Security, 18(3): 420-432. https://doi.org/10.6633/IJNS.201605.18(3).03
[8] Zhang, K., Li, C., Wang, Y., Zhu, X., Wang, H. (2017). Collaborative support vector machine for malware detection. In ICCS, pp. 1682-1691. https://doi.org/10.1016/j.procs.2017.05.063
[9] Saremi, S., Mirjalili, S., Lewis, A. (2017). Grasshopper optimisation algorithm: theory and application. Advances in Engineering Software, 105: 30-47. https://doi.org/10.1016/j.advengsoft.2017.01.004
[10] Ahmed, A.M., Rizaner, A., Ulusoy, A.H. (2018). A novel decision tree classification based on post-pruning with Bayes minimum risk. Plos One, 13(4): e0194168. https://doi.org/10.1371/journal.pone.0194168
[11] Mafarja, M.M., Mirjalili, S. (2017). Hybrid whale optimization algorithm with simulated annealing for feature selection. Neurocomputing, 260: 302-312. https://doi.org/10.1016/j.neucom.2017.04.053
[12] Tavallaee, M., Bagheri, E., Lu, W., Ghorbani, A.A. (2009). A detailed analysis of the KDD CUP 99 data set. In 2009 IEEE Symposium on Computational Intelligence for Security and Defense Applications, pp. 1-6. https://doi.org/10.1109/CISDA.2009.5356528
[13] Verma, A., Ranga, V. (2018). Statistical analysis of CIDDS-001 dataset for network intrusion detection systems using distance-based machine learning. Procedia Computer Science, 125: 709-716. https://doi.org/10.1016/j.procs.2017.12.091
[14] Goeschel, K. (2016). Reducing false positives in intrusion detection systems using data-mining techniques utilizing support vector machines, decision trees, and naive Bayes for off-line analysis. In SoutheastCon 2016, pp. 1-6. https://doi.org/10.1109/SECON.2016.7506774
[15] Rai, K., Devi, M.S., Guleria, A. (2016). Decision tree based algorithm for intrusion detection. International Journal of Advanced Networking and Applications, 7(4): 2828.
[16] Aljarah, I., Ala’M, A.Z., Faris, H., Hassonah, M.A., Mirjalili, S., Saadeh, H. (2018). Simultaneous feature selection and support vector machine optimization using the grasshopper optimization algorithm. Cognitive Computation, 10(3): 478-495. https://doi.org/10.1007/s12559-017-9542-9
[17] Emary, E., Zawbaa, H.M., Hassanien, A.E. (2016). Binary ant lion approaches for feature selection. Neurocomputing, 213: 54-65. https://doi.org/10.1016/j.neucom.2016.03.101
[18] Catherine, F.L., Pathak, R., Vaidehi, V. (2014). Efficient host based intrusion detection system using Partial Decision Tree and Correlation feature selection algorithm. In 2014 International Conference on Recent Trends in Information Technology, pp. 1-6. https://doi.org/10.1109/ICRTIT.2014.6996115
[19] Ibrahim, H.T., Mazher, W.J., Ucan, O.N., Bayat, O. (2019). A grasshopper optimizer approach for feature selection and optimizing SVM parameters utilizing real biomedical data sets. Neural Computing and Applications, 31(10): 5965-5974. https://doi.org/10.1007/s00521-018-3414-4