Cristian Vendittozzi* | Erwin Ciro | Ferdinando Felli | Carla Lupi | Francesco Marra | Giovanni Pulci | Alessandro Astri
© 2020 IIETA. This article is published by IIETA and is licensed under the CC BY 4.0 license (http://creativecommons.org/licenses/by/4.0/).
OPEN ACCESS
The structural health monitoring (SHM) of an infrastructure is of fundamental importance for the structure and people safety. Fiber Bragg Grating (FBG) sensors allow to design for each application, a tailored array of quasi-distributed sensors integrated to the infrastructure. To ensure the structural integrity of the railways is crucial to verify that the infrastructures comply with safety requirements to carry out their task. Railways rolling stock must comply with speed limits, the maximum number of wagons, maximum weight limit distributed on each axis of the wagons and the allowed number of trains on specific routes. The identification of the vertical load acting on each wheel is fundamental for the safety of a rolling-stock moving on a railway line. This paper presents the results of a test campaign on sensitive smart patches for static and dynamic weighing of trains. The system aims to generate a gripping system based on the magnetic force of a plastoferrite patch, taking advantage of the peculiarity that the rails are made of ferritic steel. This solution has the benefit of simplifying and speeding up the installation process and enabling a fast and easy removal or change in the configuration of the sensors array on the rail.
Fiber Bragg Grating (FBG), railways, real time monitoring, Structural Health Monitoring (SHM), structural integrity
In recent years, the vertical load detection, acting on a railway line, is becoming more and more important both for the infrastructure manager and for the railway companies whose main activity is the provision of transport services for goods and /or people. The infrastructure manager is responsible for the construction and maintenance of the railway infrastructure and for the safe management of railway traffic. The trains transit naturally tends to worsen the geometric line conditions, while the degradation of the railway station is somehow directly proportional to the extent of this load. Indeed, there are circulability constraints for the various lines, which are a function of the maximum allowed load per axle, and of the elements that characterize the railway equipment [1]. The infrastructure manager, called the Italian Railway Network (RFI, from the Italian Rete Ferroviaria Italiana), established those constraints.
Recently some railway accidents like that of Pioltello (Mi) Italy, in which the rail failure (Figure 1), caused the train derailment [2, 3] with some dead and wounded, have made this issue very topical and urgent. The objective is to create a load sensor, equipped with a rapid and reversible installation system, which does not require additional work on the rail for installation, such as drilling, polishing, and gluing. This sensor was achieved, creating a coupling system based on magnetic attraction force, by using a flexible plastoferrite magnetic patch, also instrumented with Fiber Bragg Grating (FBG) sensors. The plastoferrite is a permanent magnet composed of a thermoplastic matrix, usually polyamide (PA) or polyphenylene sulfide (PPS) and Ferrite powder (iron oxides sintered with Strontium and/or Barium carbonate at high temperatures).
Figure 1. Pioltello (Mi, Italy). (a) Train accident; (b) Rail point where the failure may have occurred [2, 3]
The use of this flexible magnetic patch, hereinafter referred to as Smart Patch (SP), is justified by the fact of, taking advantage only of the magnetic attraction force for the connection since, there is no sensor intimately constrained to the rail surface. Thus, trying to avoid rigid sliding, which would compromise the quality of measurement, it is required a thin, magnetic and at the same time extremely yielding plate. The objective has been pursued by following these steps:
A static FEA, simulating the weighing of the railway vehicle, permits to determine the most promising positions where to install the strain sensors (i.e., SP). Appropriate installation points are characterized by significant deformation values, i.e. considerable sensitivity to the applied load type, and geometric characteristics in terms of available space for installation. In the static case, which considers a rolling stock in stationary condition on the railway, the rail is subjected only to the vertical loading transferred by the various wheels. The generic vertical load, thought to be perfectly centered on the section symmetry axis, is responsible for shear stresses and bending moments in the rail vertical plane. To develop de FEA model, it has been necessary to define a measurement configuration to obtain the measure reproducibility. In addition is relevant to identify - in the measure conditions - the area where the rail withstands the maximum longitudinal deformation, to have the best sensitivity conditions, and to understand whether adjacent loading, transmitted by adjacent wheels, influences the deformation field in the sensor application area.
2.1 Rail modelling
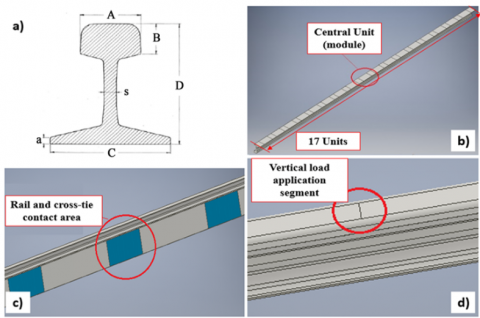
For the FEA model, a rail section was designed using a 60 UNI [4], shown in Figure 2a, section of 10.4 meters in length, corresponding to 17 elementary rail units (modules), allowing the analysis of the central elementary unit and neglecting the edge effects (Figure 2b). The elementary unit (or module) is defined as the rail rolling plane between two contiguous cross-tie.
Figure 2. (a) Standard 60 UNI cross section in use in several of the Italian railway infrastructure installations; (b) rail modules discretization; (c) Rail and cross-tie contact area; (d) FEA application load segment
On the rail base, the contact surfaces between the rail and the cross-tie have been obtained keeping in mind the distance between two consecutive cross-ties (600 mm) and the width of the support surface offered to the rail (200 mm) (Figure 2c). A segment lying on the symmetry plane of the central unit for the application of the vertical load (Both for FEA analysis and bending tests) has been obtained on the rail-rolling plane (Figure 2d). In this way the measurement condition is simulated as the wheel centred between two consecutive cross-ties.
2.2 Model definition in the simulation environment
A linear elastic problem has been considered: the rail does not reach plastic deformation being the loads defined within the circulation constraints. A homogeneous and isotropic material has been considered. Therefore, the Poisson's coefficient and the elastic modulus of the rail steel have been defined. Literature refers to Winkler's theory to characterize the behaviour of rail supports. Each elementary surface belonging to the rail cross-tie contact surface has been constrained to an independent spring with a degree of freedom; thus it can only be subjected to a vertical displacement as a function of the vertical load. The rail cross-tie contact surface has been therefore characterized as an elastic support. A vertical load has been applied with a module of 200 kN on the segment obtained on the rolling surface. The axial deformation of the rail has been setting up as the solution.
2.2.1 Mesh convergence analysis
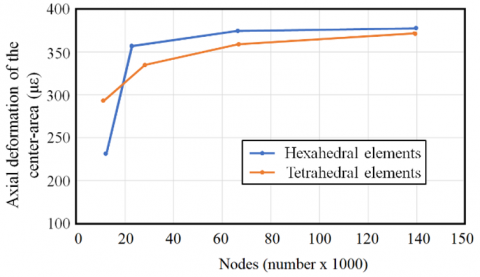
A first simulation with default tetrahedral elements mesh was performed. The point with maximum axial deformation is the center of the lower surface between two consecutive cross-tie. To limit the discretization error, a convergence analysis of the mesh was performed by discretizing the system both with hexahedral elements (8 nodes per element) and with tetrahedral elements (4 nodes per element). The level of discretization has been progressively increased and for each step the axial deformation value of the center area has been evaluated (Figure 3).
Figure 3. Mesh convergence analysis
Figure 3 shows that considering, the same number of nodes for both meshes, the model tends to underestimate the deformation value. Thus, the system has been discretized with hexahedral elements with a total number of nodes about 138,000.
2.3 Sensor placement
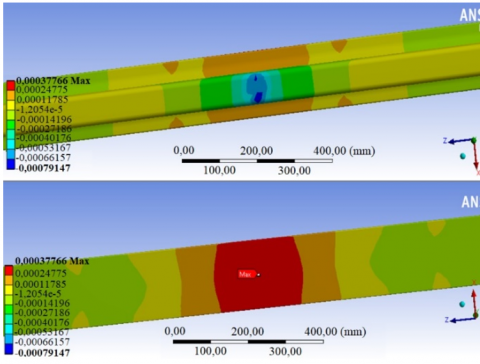
The FEA revealed the candidate zones for the SP installation. The longitudinal deformation is relevant on the back of the rail foot. The point of maximum axial deformation occurs in the center of the surface of the rail between two adjacent cross-tie (Figure 4). To have the condition of maximum sensitivity and reproducibility of installation it would seem appropriate to locate the SP in the point shown in Figure 4. Furthermore, the base of the rail offers a flat surface, which allows a good SP adhesion. It should be emphasized that this solution entails an installation difficulty consisting of eliminating the ballast located near the interest area. Instead, locating the sensor on the back of the rail foot eliminates the problem presented above. The substantial disadvantage would be in grating’s sensitivity loss due to the defective adhesion of the SP, being this area not perfectly planar.
Finally, it was decided to install the smart patch on the rail lower surface, making the FBG coincides with the center of the rail base between two consecutive tie-bars. Hence, there are the conditions of maximum sensitivity, a reproducibility of installation and the correct adhesion of the magnetic patch.
Figure 4. FEA results aimed at sensors position selection
2.4 Neglecting edge effects
To verify the actual negligible nature of the edge effects in the measurement condition, two scenarios were considered:
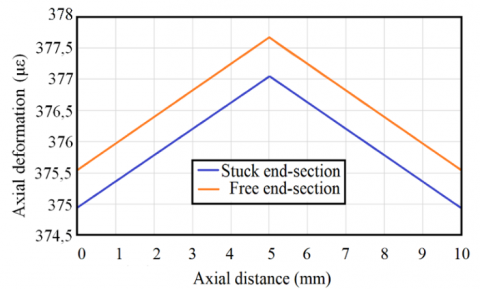
In the real situation, these cross sections are constrained to the all structure, so they are neither stuck nor free; however, if the measuring point is not influenced by the edge effects, the solution should not change substantially in the two cases. A vertical load of 200 kN was applied to the segment indicated in Figure 2d, which corresponds to increasing the maximum load allowed for the single wheel by 40%. To obtain the required solution, a path has been created near the area center of the lower surface of the central modulus, which identifies the portion of material monitored by the optical sensor. A comparison analysis has been performed with a variable vertical load, evaluating for each load step, for both cases, the value of axial deformation at the transducer installation point. Figure 5 shows the simulation results. The axial deformation maximum deviation is about 0.6 με.
Afterward, by considering that measure vertical loading is centered on the sensor, it has been assessed whether a vertical loading imparted by an adjacent wheel could modify the axial deformation value of the sensor application point in the measurement conditions. This scenario has been evaluated by considering the worst condition: an additional vertical load was placed 1.8 meters far to the analysis point, which corresponds to the minimum distance between two adjacent wheels for different freight wagons.
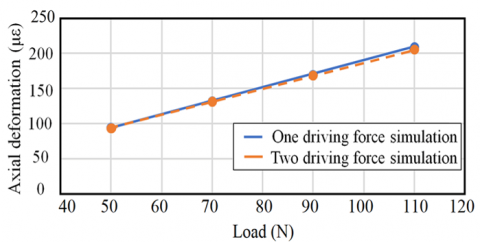
Furthermore, a fair distribution of the load on the wheels of the generic wagon has been assumed. A variable load analysis has been performed for one load, neglecting the effect of the adjacent load, and for two loadings (Figure 6).
Figure 5. Axial deformation field of the path in the two scenarios (free or stuck end-sections); from the analysis has been found an offset of about 0.6 µε
Figure 6. Comparison between one or two disturbing forces
3.1 Sensor selection
The structural health monitoring of infrastructures such as the long motorway viaducts, the pipelines for the transport of gas, or oil, or refined fuels [5, 6], the railway network [7-10], has resulted in recent years as a research area particularly interested in the use of FBGs. In present work, it has opted for the use of these optical strain sensor because, if compared to the traditional resistive strain gauge (SG), these sensors present the following advantages:
An FBG relies on a periodic modulation of the refractive index in the core of a single mode optical fiber. It is based on the so-called Bragg condition, Eq. (1).
$\lambda_{B}=2 n_{e f f} \Lambda.$ (1)
It behaves as a wavelength selective filter which reflects light signals at a specific wavelength, named the Bragg wavelength λB, that is strictly dependent on the fiber effective refractive index neff and the grating pitch Λ of the FBG [11, 12].
3.2 SP design
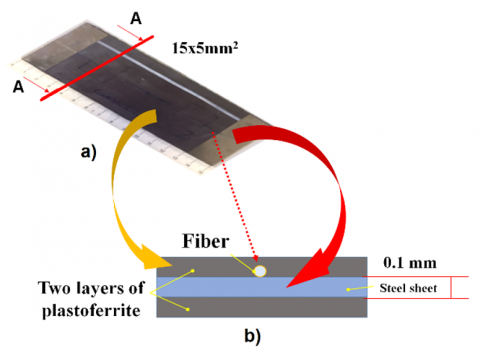
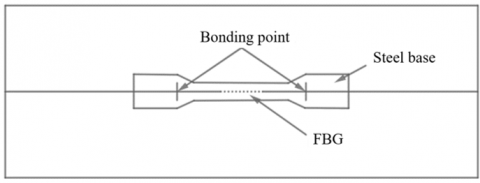
The SP has a layered structure as shown in Figure 7. The first layer of plastoferrite with surface dimensions equal to 15x5 mm and thickness of 1 mm has the task of fixing the transducer in the measurement point by exploiting the magnetic attraction force.
Figure 7. Smart Patch. (a) Top view of the real SP; (b) Section view A-A (not to scale)
The ferritic steel sheet with surface dimensions equal to 15x5 mm and a thickness of 0.1 mm has the task of stabilizing the sensor response at the time of installation. It has been experimentally evaluated that a system characterized by an FBG sensor, simply glued on the magnetic rubber, follows the rail stress state, if it is applied on the rail. The sheet thickness must, in general, be as small as possible to avoid the SP system stiffening. The upper layer of plastoferrite, clearly visible in Figure 7a, instead has the task of protecting the optical SG from mechanical actions. Since plastoferrite layer is in contact with rail and steel sheet, it has been glued by acrylic resin with steel sheet. Then the Bragg grating was pre-tensioned and positioned in the center of the steel sheet in the longitudinal direction.
4.1 Test set-up
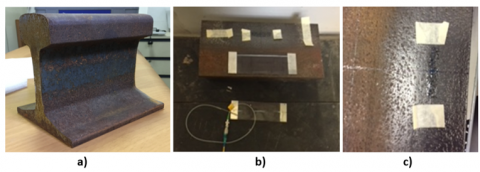
A rail segment, with section 60 UNI, 27 cm in length was used for the experimental phase of the work (Figure 8a). Half of the rear surface of the rail foot has been polished to eliminate the oxide layer. A sensor has been used as a reference for test comparison and has been glued on the oxide-free part using acrylic resin, as shown in Figure 8a and b. It should be emphasized that the reference has been positioned on the almost ideal surface, by eliminating the adherence variability of an inconsistent oxide layer; whereas, SP is installed on the second half, still oxidized, to keep the operating conditions of the patch as similar as possible to the real conditions. We tried to replicate the worst conditions of the possible use of the SP, i.e., on an active rail where it is impossible to polish the surface for sensors installation.
Figure 8. (a) 60 UNI rail segment; (b) Sensors positioning, on top the reference sensor, on the bottom a first SP, out of the rail segment a second SP; (c) Reference sensor glued on the polished side of the rail foot surface
4.2 Bending tests
Bending tests were performed using the Instron hydraulic press - Model 8033. All tests were performed as three points bending, applying the vertical load on the center of the rail segment, as indicated in Figure 2d, but varying the input load mode (single step loading, increasing step loading, sinusoidal loading).
A first step-loading test was performed (Figure 9), with a step of 200 kN, a first result is shown in Figure 10. The average axial deformation recorded by the reference sensor (represented in blue in Figure 10) was about 142 µε, while the average maximum value shown by the SP (in red in Figure 10) was about 8.7 µε. In this first condition the SP shown a sensitivity about 16.3 times lower than that of the reference.
Figure 9. First sinusoidal driving force test
Figure 10. Step-loading test
In addition to the reduced sensitivity already identified in the step loading test, should be noted that the SP signal is clearly not repeatable: there is a distorted wave function that prevents unequivocally to evaluate the position of the maximum and minimum. It has been hypothesized that this effect could be caused by the friction conditions generated between the optical SG and the protection plate and/or possible plastoferrite layer micro-sliding. These assumptions have led to change the bonding scheme of the sensor in the SP.
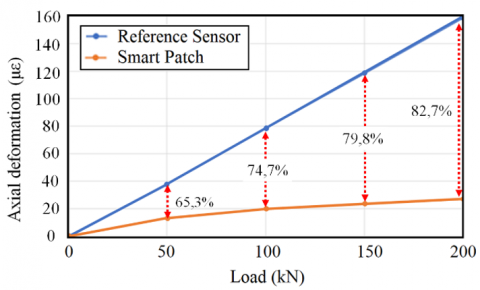
A second configuration has been created by eliminating the protective plastoferrite and by gluing the FBG directly onto the steel sheet (Figure 11). A second step loading test has been performed, but now increasing the load by 50 kN for each step, from 50 kN up to a maximum of 200 kN. Figure 12 shows the average axial deformation of the two sensors as a function of the vertical load.
Figure 11. New SP configuration scheme
The reference sensor (in blue in Figure 12) shows a linear behaviour with a constant sensitivity of about 0.8 με/kN, while the SP (in orange in Figure 12) is characterized by a lower sensitivity that varies as the load conditions change. The orange curve shows an asymptotic behaviour due to the possible progressive increase of the sliding at the interface between rail and plastoferrite.
Figure 12. Sensitivity analysis of the second step-loading test
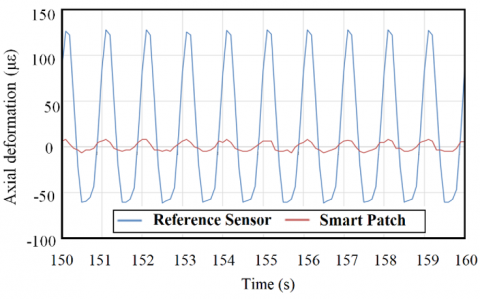
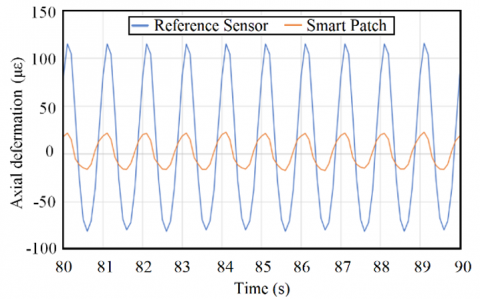
Figure 13. Second sinusoidal driving force test
A new test was performed with sinusoidal loading with the same conditions defined above (Figure 13). The repeatability of the signal is now clearly improved: the wave function is regular, and it is possible to clearly identify from the graph the condition of maximum and minimum. Then it is necessary to develop a sensor protection system that has not direct contact with it, so as not to generate friction conditions that would compromise the repeatability of the measurement.
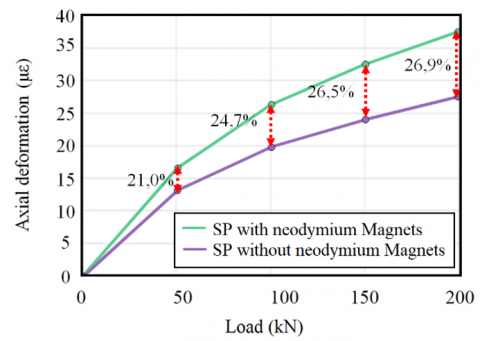
Finally, to detect the presence of a sliding in the interface between rail and plastoferrite, two neodymium magnets have been placed at the ends of the patch base. In this way the normal load acting on the sensor base, which keeps the system adherent at the rail base, is increased and consequently the sliding friction condition between the patch and the rail surface increases.
A new test with step loading has been carried out with the same conditions defined above. Figure 14 relates the mean axial deformation of the system with and without neodymium magnets. The sensor attached to the plastoferrite base continues to have a non-linear behaviour as in the previous case. The substantial difference is the sensitivity increase that confirms a reduction in the sliding of the plastoferrite-rail interface.
Figure 14. Sensitivity analysis of the step-loading test of the neodymium magnets configuration
In this work, a smart patch, instrumented by optical SGs, have been designed and tested. The work is aimed at evaluating of the induced loads of the trains on the tracks and the static weighing of the railway trains. The identification of the vertical load acting on each wheel is of fundamental concerning to allow the movement of a rolling stock on a railway line, since the latter are classified into categories according to the maximum allowed load per axle. Considering the peculiarity that rails are made of ferritic steel, the sensory system is characterized by a plastoferrite base, which aims to create a gripping system based on the magnetic attraction force. This solution presents the advantage of simplifying and speeding up the installation process and being able at any time, with extreme ease and speed, to uninstall and change the configuration of the sensors on the rail. Three different configurations of smart magnetic patches have been realized and tested.
At present, the patches, during the work phase, are affected by a rigid sliding that is generated at the interface between the lower layer of plastoferrite and the surface of the rail that could compromise the reproducibility of the measurement. The design developed, starting from the first configuration, was aimed at reducing this possible loss of adhesion and at preserving the sensor sensitivity that has been reduced due to the presence of some damping layer. The thickness of the steel plate has been reduced as possible to not excessively stiff the measurement system. The upper plastoferrite layer (present in the first configuration with the purpose of sensor protection) was eliminated. The last configuration introduced two permanent and rigid neodymium magnets, placed at the ends of the smart patch, to increase the adhesion strength but keeping the system removable. Further developments will be made with the aim of improving the performance of the smart patch.
|
neff |
Fiber effective refractive, dimensionless |
|
N |
Newton, kg.m.s-2 |
|
Greek symbols |
|
|
e |
Axial deformation, dimensionless |
|
λB |
Bragg wavelength, g/mm |
|
Λ |
Grating pitch, m |
[1] General preface at the service time in use on the (Italian) national railway infrastructure. Italian State Railway Web Site, http://site.rfi.it/quadroriferimento/files/istruzioni/PGOS%20Estratto%20ad%20uso%20delle%20imprese%20ferroviarie.pdf, accessed on Jun. 29, 2019.
[2] Ecodibergamo Magazine. https://www.ecodibergamo.it/stories/bassa-bergamasca/deraglia-un-treno-a-pioltello-fototre-vittime-due-sono-bergamasche_1268138_11/, accessed on Jun. 25, 2019.
[3] Affaritalian Magazine. http://www.affaritaliani.it/milano/tragedia-di-pioltello-la-procura-verso-la-chiusura-delle-indagini-608481.html, accessed on: Jun. 25, 2019.
[4] Mayer, L. (2005). Impianti Ferroviari, ed. Third, CIFI: Roma.
[5] Felli, F., Paolozzi, A., Vendittozzi, C., Paris, C., Asanuma, H., De Canio, G., Mongelli, M., Colucci, A. (2015). Structural health monitoring of pipelines for environment pollution mitigation. Proceedings of the ASME 2015 Conference on Smart Materials, Adaptive Structures and Intelligent Systems, Colorado, USA. https://doi.org/10.1115/SMASIS2015-8922
[6] Paolozzi, A., Paris, C., Vendittozzi, C., Felli, F., Mongelli, M., De Canio, G, Colucci, A., Asanuma, H. (2017). Test of FBG sensors for monitoring high pressure pipes. Proceedings Volume 10168 of Sensors and Smart Structures Technologies for Civil, Mechanical, and Aerospace Systems, p. 101681Q. https://doi.org/10.1117/12.2260474
[7] Klug, F., Lackner, S., Lienhart, W. (2016). Monitoring of railway deformations using distributed fiber optic sensors. Proceedings of Joint International Symposium on Deformation Monitoring.
[8] Zeni, L., Minardo, A., Porcaro, G., Giannetta, D., Bernini, R. (2013). Monitoring railways with optical fibers. Proceedings of SPIE. https://doi.org/10.1117/2.1201311.005246
[9] Lai, C.C., Kam, J.C.P., Leung, D.C.C., Lee, T.K.Y., Tam, A.Y.M., Ho, S.L., Tam, H.Y., Liu, M.S.Y. (2012) Development of a fiber-optic sensing system for train vibration and train weight measurements in Hong Kong. Journal of Sensors, 2012: 1-7. https://doi.org/10.1155/2012/365165
[10] Filograno, M.L., Guillen, P.C., Rodriguez-Barrios, A., Rodriguez-Barrios, S., Rodriguez-Plaza, M., Andres-Alguacil, Á., Gonzalez-Herraez, M. (2012). Real-time monitoring of railway traffic using fiber bragg grating sensors. IEEE Sensors Journal, 12(1): 85-92. https://doi.org/10.1109/JSEN.2011.2135848
[11] Hill, K.O., Meltz, G. (1997). Fiber bragg grating technology fundamentals and overview. Journal of Lightwave Technology. 15(8): 1263-1276. https://doi.org/10.1109/50.618320
[12] Rao. Y.J. (1997). In-fibre Bragg grating sensors, Measurement Science and Technology, 8: 355-375. https://doi.org/10.1088/0957-0233/8/4/002