OPEN ACCESS
The purpose of this study is to determine the influence of face-air velocity distribution of finned tube bundles on the thermal-performance of power plant Air-Cooled Condensers (ACCs) by experimental method and to explore Favorable Face-Air Velocity Distributions (FFAVDs) of the ambient cooling air inside the air-cooled cells by Computational Fluid Dynamics (CFD) method. FFAVD is a face-air velocity distribution favorable for thermo-performance of power plant ACCs. Based on experiments on a specially-constructed wind tunnel test-bed located on-site of a 1000-MW ultra-supercritical direct air-cooled power plant, it was found that face-air velocity distribution of ambient cooling air of finned tube bundles used in ACCs notably affects their thermo-performance, and FFAVDs can be determined. One type of FFAVD tended to increase in the retrograde direction of tube-side turbine-exhaust-condensate flow. The face-air velocity distributions of ambient cooling air that increase in the direction of tube-side turbine-exhaust-condensate flow have an adverse effect on the thermo-performance of power plant ACCs. The existence of FFAVDs can be scientifically explained by the principle of field synergy. Experiments on an A-frame cell on the ACC employed in the 1000 MW ultra-supercritical direct air-cooled power plant showed that the face-air velocity distribution in an A-frame ACC cell has the opposite trend of an FFAVD. Therefore, one type of distributing net with the characteristics of an FFAVD is introduced. The favorable characteristics of the wind distributing net have been verified based on modelling and numerical calculation.
Air-cooled condenser; Face-air velocity; Heat transfer; Thermal performance; A-frame cell; distributing net.
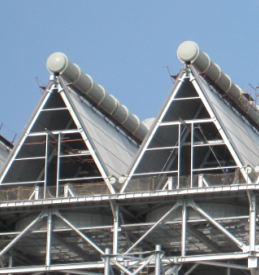
In the last few decades, the use of Air-Cooled Condensers (ACCs) in power plants in countries lacking water resources is been on the rise [1, 2]. A power plant ACC is used to remove waste heat from the turbine exhaust. It usually consists of several dozen air-cooled cells and is constructed in the form of arrays. The typical type of ACC cells used is shown in Fig. 1. It consists of several finned-tube bundles arranged in the form of an A-frame, with a turbine-exhaust duct overhead, a forced draught axial flow fan at the base of the A-frame, and two condensate ducts under each screen of the finned-tube bundles. The axial flow fan forces ambient cooling air to flow across the tube bundles, causing the turbine-exhaust inside the tubes to condense. Power plant ACCs are a typical type of ACC, and an ACC is a type of Air-Cooled Heat Exchanger (ACHE).
In the selection or design of ACHEs, uniform face-air velocity of finned tube bundles (or air flow) is almost universally assumed. In actual ACHEs, uniform face-air velocity is the exception rather than the rule [3]. Non- uniform face-air velocity distributions, so called maldistributions of flow, may have dramatic consequences on the thermal performance of heat exchangers [4].
Figure 1. Schematic representation of an A-frame condenser cell
Chiou [5] employed a mathematical method to determine the effectiveness of the air conditioning condenser accounting for the effect of twelve typical two-dimensional air flow maldistributions. He found that the deterioration of the thermal performance of the condenser duo to the effect of cooling air flow nonuniformity may become significant in some typical applications. Rabas [6] used an integral approach to investigate the impact of one- and two-dimensional inlet flow distributions on the performance of an air-cooled condenser; the largest reduction in thermal performance was less than 7%. He theoretically derived from two-dimensional air flow distribution that the optimum inlet air flow distribution was a uniform distribution under four restrictions. In the work of the aforementioned researchers [3-6], non-uniform face-air velocity distributions were all artificially generated velocity profiles, but their studies almost didn’t consider turbine-exhaust condensation.
Beiler et al. [7] and Meyer et al. [8] employed velocity distributions measured on A-frame ACHE models, finding that maldistribution in well-designed ACHEs reduces the thermal performance by only a few percent. Joen et al. [9] experimentally studied the behavior of a heat exchanger in the case of non-uniform inlet air flow. The effect of non-uniform inlet air flow on the performance was found to be substantial. Song et al. [10] studied the effect of non-uniform face-air velocity distribution on performance of a multi-circuit evaporator, both numerically and experimentally. The results showed that evaporator capacity under non-uniform face-air velocity distribution was 7.78% less than that under uniform air velocity distribution.
According to L.X.,Zhou [11], changing the air-cooling flow in air cooling unit can improve heat transfer performance of ACC, in order to prove it, a physical model of deflector’s installed in ACC for 600 MW unit was established, numerical simulation was conducted to obtain the temperature and velocity field before and after installation of deflector within the ACC in different wind speed, and the results indicated that installation of deflector could make a better air flow, so it can improve the effect of heat transfer and can provide an optimal operation for the air-cooling system. The A-frame geometry of the air-cooled condenser cell and the complicated flow field at the exit of the axial flow fan bring on the air maldistribution on the surface of the finned tube bundles and the deteriorated thermo-flow performances of a condenser cell [12].
In summary, the literature on non-uniform face-air velocity distribution is predominantly focused on the adverse effect of non-uniform face-air velocity on the thermal performance of ACHEs. The literature on cooling air flowing and guiding inside the air-cooled cells revealed that the flow field was uniformity and guiding devices could make a better air flow, so it can improve the effect of heat transfer for the ACCs.
To the best of the author’s knowledge, few studies have been reported on the effect of different non-uniform face-air velocity distributions on power plant A-framed ACCs. Yang et al. [13] introduced a flow guiding device inside an ACC cell to improve the uniformity of the flow cooling air wherein.
As shown in Fig. 1, the A-frame configuration of power plant ACCs are typical ACHEs. The turbine-exhaust flows inside the tubes from top to bottom and gives off its latent heat to the cooling air outside the finned-tube bundles. It is expected that there might be some type of cooling air face-air velocity distribution of finned-tube bundles favorable for the heat transfer of power plant ACCs.
The objective of this study is to confirm the details of non-uniform distribution of face velocities on the A-frame cell finned-tube bundles of commissioned power plant ACCs, evaluate their thermal performance under different face-air velocity distributions, and ultimately identify favorable face-air velocity distributions.
2.1 Experimental apparatus and procedure
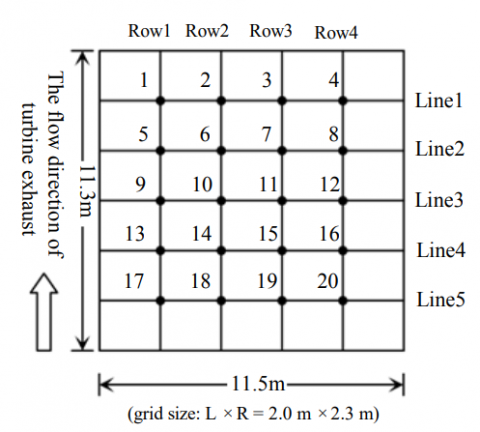
An A-frame downstream cell of the ACC employed in a 1000-MW ultra-supercritical direct air-cooled power plant located in northwest China was selected for the test. Twenty gauging points for face-air velocity measurement were arranged in a uniformly-spaced 9 lines × 4 rows form near the surface of one screen of the A-frame cell as shown in Fig. 2.
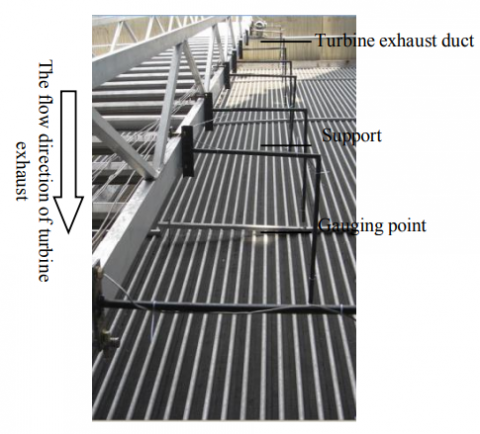
Face velocities were measured by a hot-wire anemometer. Outlet air temperature was measured by nine Platinum Resistance Thermometers (PRTs) shown in Fig. 3(a). Base tube temperature was measured by seven Platinum Resistance Thermometers (PRTs) shown in Fig. 3(b), along the flow direction of turbine exhaust the gauging point was point one to point seven .The parameters of the hot-wire anemometer and the platinum resistance thermometers (Pt100s) are shown in Table 1.
Measurements were taken with a fan operation frequency of 55 Hz.
(grid size: L × R = 2.0 m × 2.3 m)
Figure 2. Arrangement of gauging points(the blackpoints showed in figure) of face-air velocity inside an A-frame downstream cell.
Table 1. Measuring instruments
|
Name |
Parameter |
||
|
Hot-wire anemometer |
velocity ≤ 50 m/s,accuracy 3% |
||
|
Temperature and humidity sensor |
AM2303, accuracy ±0.2% |
||
|
Platinum resistance thermometers |
Pt100, accuracy ±0.2% |
||
|
Armored thermal resistance |
Pt100, accuracy ±0.2% |
||
(a) Outlet air temperature
(b) Base tube temperature
Figure 3. Arrangement of gauging points of temperature.
2.2 Experiment results and discussion
Table 2 shows the measured face-air velocities. As shown in Table 2, the distributions of cooled air face-air velocity of finned tube bundles are non-uniform; face velocities increase from top to bottom along each finned tube. This experimental result should be accepted as a general rule for the A-frame cell used in power plant ACCs. Such distribution of face-air velocity is attributed to the exiting air of the axial flow fan as shown in Fig. 1 such that air velocities greatly increase from the axis to the outer edge of the fan.
Table 2. Measured face velocities (m/s)
|
Fan frequency of 55 Hz |
Row 1 |
Row 2 |
Row 3 |
Row 4 |
|
Line 1 |
9.7 |
11.2 |
11.6 |
10.5 |
|
Line 2 |
5.9 |
5.7 |
10.1 |
7.37 |
|
Line 3 |
4.3 |
3.8 |
5.3 |
4.9 |
|
Line 4 |
4.95 |
3.2 |
4.6 |
4.5 |
|
Line 5 |
3.2 |
1.65 |
3.6 |
3.7 |
Table 3 shows the measured base tube temperatures. As shown in Table 3, the distributions of base tube temperatures of finned tube bundles are non-uniform; base tube temperatures decrease from top to bottom along each finned tube, whose distribution is contrary to the distribution of cooled air face-air velocity of finned tube bundles. This experimental result should be accepted as a general rule for the A-frame cell used in power plant ACCs. Such distribution of base tube temperatures is attributed to the exiting position of turbine exhaust duct that decides the flow direction of the turbine exhaust as shown in Fig. 1.
Table 3. Measured mean base tube temperatures (℃)
|
Fan frequency of 55 Hz |
1 |
2 |
3 |
4 |
5 |
6 |
7 |
|
Mean temperature |
51.2 |
48.1 |
47.1 |
45.3 |
45 |
44.8 |
44.6 |
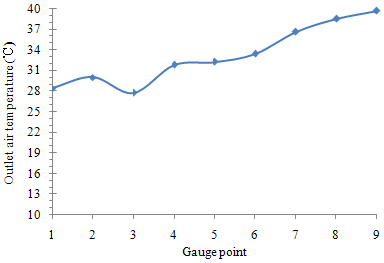
Figure 4. Outlet air temperature distribution on the surface of an A-framed downstream cell.
Figure 4 shows the outlet air temperature distribution of finned tube bundles on the surface of the chosen ACC cell. As shown in Fig. 4, outlet air temperature tends to decrease in the direction of turbine-exhaust-condensate flow in the finned tubes, i.e., from the top to the bottom of the finned tubes.
It can be concluded that the distributions of cooled air face-air velocity and temperatures of finned tube bundles and outlet air are non-uniform. The distribution laws of the measured temperature of base tube and outlet air of finned tube bundles of the chosen ACC cell are same that is decrease from top to bottom, nevertheless, the distributions of face-air velocities increase from top to bottom.
For power plant ACCs, turbine exhaust flows downwards (from top to bottom shown in Fig.1.) and condenses gradually in finned tubes, while cooled ambient air is forced to flow across the finned tubes by axial flow fans. It is natural to expect that there might be favorable face-air velocity distributions along the direction of the turbine-exhaust-condensate flow inside finned tubes. Therefore, an on-site wind tunnel bed was constructed at the power plant mentioned above for investigation.
3.1 Experimental equipment
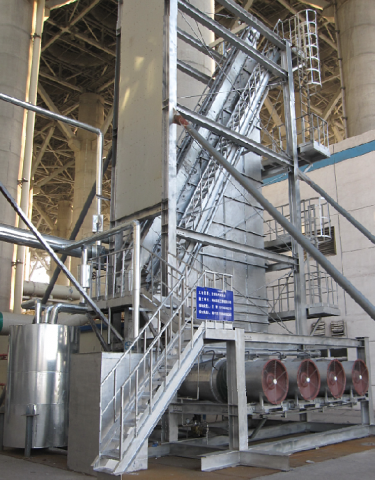
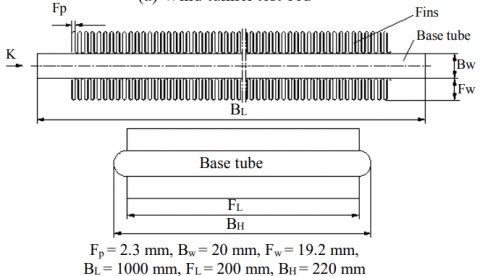
The on-site wind tunnel bed is shown in Fig. 5. The testing specimen consists of seven wavy-finned tubes (6 downward flowing and 1 upward flowing) and is tied into the power plant ACC’s turbine-exhaust and vacuum system. The finned tubes, as shown in Fig. 5(b), are arranged parallel to each other in a single-row, the same as the one employed in the chosen power plant ACC. Each wavy-finned-tube is 1000 mm long with a cross sectional area of 20 mm 220 mm, a fin thickness of 0.25 mm, and a fin pitch of 2.3 mm. The turbine exhaust distribution pipe is designed in such way that the turbine exhaust flow rate in every tested downward flowing finned-tube is equal to the mean turbine exhaust flow rate in every downward flowing finned tube of the power plant ACC. Different face-air velocity distributions along the test specimen are achieved by changing the incline angle of the air deflectors as shown in Fig. 5. The definition of the incline angle is shown in Fig. 6. When the air deflectors are at the position of 0°, no face-air velocity distribution is changed. In other words, cooled ambient air forced by the fan blows freely into the plenum the same as in the case of an A-frame cell. With the inclined angle increasing from 0° to 40°, more and more cooled ambient air is induced upwards along each finned tube, while the inclined angle decreases from 0° to -40°, more and more cooled ambient air is induced downwards along each finned tube.
(a) Wind tunnel test bed
Fp = 2.3 mm, Bw = 20 mm, Fw = 19.2 mm,
BL = 1000 mm, FL = 200 mm, BH = 220 mm
(b) Wavy-finned tube
Figure 5. The on-site wind tunnel test bed
Figure 6. Definition of inclined angle of air deflector
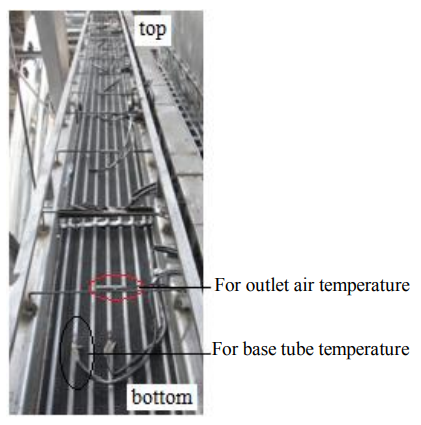
Figure 7. Gauge points on wavy-finned tube of the teat specimen
The outlet air temperatures of the wavy-finned tubes were measured with 20 PRTs. The PRTs are installed uniformly-spaced along a down-flow finned-tube as shown in Fig. 7. The inlet cooled ambient air temperatures of the wavy-finned tubes were measured with 20 PRTs too. Face velocities of test specimen were measured with a hot-wire anemometer near every inlet air temperature gauging point. Gauging points were sorted from bottom to top along the finned tube. Turbine exhaust inlet saturation temperatures were measured at the turbine exhaust distribution pipe with an armored thermal resistance. The parameters of the measurement instruments are shown in Table 1.
3.2 Experimental procedure
Under a turbine-exhaust turbine backpressure of approximately 13 kPa and at each specific fan frequency as well as each incline angle of the air deflectors rotated from -40° to 40° at a 10° interval, temperatures and face velocities at the gauging points as well as the mean air temperature at the inlet of the finned tube were measured, respectively.
3.3 Results and discussion
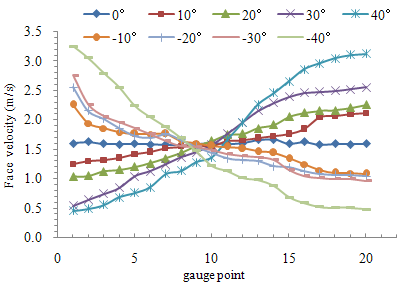
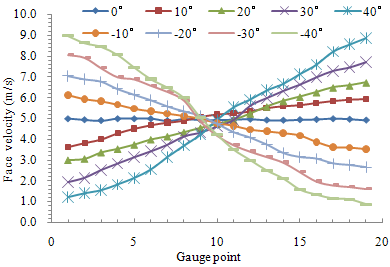
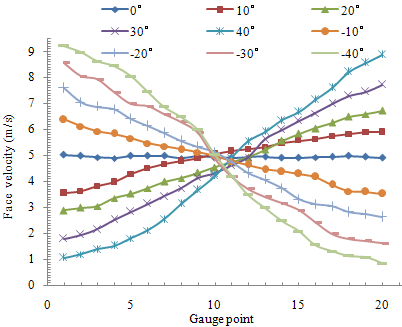
Different face-air velocity distributions under three fan frequencies and nine inclined angles of air deflectors are shown in Fig. 8 (a), (b) and (c). Different outlet air temperature distributions are shown in Fig. 9. The base tube temperature distributions under three fan frequencies are shown in Fig. 10.Based on the experimental data, the air-side convection transfer coefficient of wavy-finned tubes can be derived, the results shown in Fig. 11.
(a) At a fan frequency of 10 Hz
(b) At a fan frequency of 20 Hz
(c) At a fan frequency of 30 Hz
Figure 8. Face-air velocity distributions of test specimen at three fan frequencies
As shown in Fig. 8(a), (b) and (c), the trend of the face-air velocity distribution of test specimen under three fan frequencies is in agreement, but it is different when the incline angle of air deflectors is zero, negative, and positive. The face velocities of test specimen are relatively uniform, decreasing and increasing from bottom to top along the finned tube when the inclined angle is zero, negative, and positive, respectively.
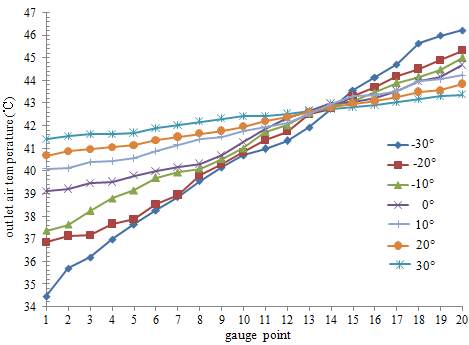
Figure 9. Outlet air temperature distributions of the test specimen at one fan frequencies
As shown in Fig. 9, the trend of outlet air temperature distribution is in agreement under all experimental conditions, i.e., increasing from bottom to top along the finned tube, which is in accordance with the trend of measured data from the actual A-framed cell as shown in Fig. 3.
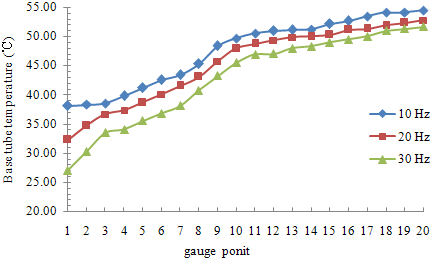
Figure 10. Mean base tube temperature distributions of the test specimen at three fan frequencies
As shown in Fig. 10, the trend of base tube temperature distributions is in agreement under all experimental conditions, i.e., increasing from bottom to top along the finned tube, which is in accordance with the trend of measured data from the actual A-framed cell as shown in Table 3.
In view of ACCs, the most interested is to enhance the heat transfer performance of them, so the air-side convection transfer coefficients of the wavy-finned tube are calculated from the tested data under different mean face-air velocities. As shown in Fig. 11, at a certain air deflector incline angle, the air-side heat transfer coefficient of the wavy-finned tube increases with the increasing of face-air velocity; at a certain face-air velocity, the air-side heat transfer coefficient of the finned tube increases with the increasing of air deflector incline angle. These experimental results reveal that face-air velocity distribution influences the wavy-finned tube thermo-performance, same to ACCs. It can be concluded that such distribution of face-air velocities that increase from bottom to top is favorable for heat transfer of power plant ACCs.
Figure 11. Air-side convection transfer coefficient of the test specimen at 30Hz fan frequencies
As the previous experimental result (shown in Table 2 and Table 3) on an A-frame cell has revealed, face velocities increase from top to bottom along each finned tube, and base tube temperatures crease from top to bottom along each finned tube. It is approximately in accord with the case of -10° to -40° deflector incline angles as shown in Fig. 8 (c). Therefore, it is reasonable to predict that the Air-side convection transfer coefficient will increase soundly if the face-air velocity distribution of the ACC is adjusted to the case of 10° to 30° deflector incline angles, at these angle the face-air velocity distribution increases from bottom to top, i.e., the face-air velocity distribution increases in the retrograde direction of turbine exhaust inside the wavy-finned tubes. The face-air velocity distribution notably affects the thermo-performance of ACCs.
A Favorable Face-air velocity Distributions (FFVD) here denotes a face-air velocity distribution that is favorable for thermo-performance of power plant ACCs. The aforementioned experiments on the constructed wind tunnel test bed are significant in that one type of FFAVD was achieved. The FFAVDs tended to increase in the retrograde direction of turbine exhaust flow and condensate flow.
The existence of FFAVDs can be scientifically explained by the principle of field synergy [14-16]. In [16], Guo introduced a unified principle, the so-called field synergy (coordination) principle. It may be employed to generally describe the performance of different types of convection heat transfer and consequently guide the enhancement of convection heat transfer. According to the field synergy principle, the better the synergy of velocity and temperature gradient/heat flow fields, the higher the convective heat transfer rate under the same conditions. One implication of the field synergy principle is that the local values of the velocity and the temperature gradient should be simultaneously large.
As revealed from the aforementioned experiments on the constructed wind tunnel test bed and an A-framed ACC cell, outlet air temperature increased from the bottom to the top along each wavy-finned tube. Since the inlet air temperature remains at a constant value without hot air recirculation occurring, it can be understood that the temperature gradient should increase from bottom to top along each finned tube. Such temperature gradient distribution has the same trend as the face-air velocity distribution when the air deflector incline angles are positive. Therefore, a distribution in which face velocities increase from bottom to top along finned tubes is favorable for heat transfer of a finned tube, and analogously of an ACC according to the principle of field synergy. This does explain the experimental results shown in Fig. 11.
Unfortunately, as known from the aforementioned experimental results on an A-frame cell, the face-air velocity distribution in the A-frame cell is opposite to the FFAVD. Therefore, the FFAVD can be employed as an important guide for the enhancement of thermal performance of power plant ACCs.
5.1 Geometry of an guiding net
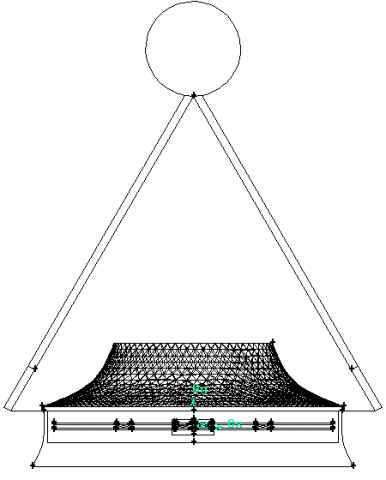
In order to achieve an FFAVD, an air guiding net as shown in Fig. 12 is proposed for power plant ACCs. This air guiding net consists of a ring net that located upon the outlet of axial flow fans, and the ring net was made up of nylon net[17] as shown in Fig.13.
Figure 12. Schematic representation of an air guiding net installed in air-cooled cell.
Figure 13. Nylon net
In the next section, a numerical method will be employed to verify that the FFAVD can be achieved by an air guiding net.
5.2 Computational aspects
The commercially available CFD code, FLUENT, is applied to solve the Reynolds-Averaged Navier-Stokes equations [18] for the cooling air as an incompressible fluid, and the effects of turbulence are incorporated through the application of Launder and Spalding’s k-ε turbulence model [19]. Computational domain mesh of the A-cell with air guiding net is shown in Fig. 14.
Finned tube bundles of the ACC cell are substituted by porous medium in the computational model. FLUENT makes a provision for the use of porous regions within the calculated flow field. The porosity of a predefined porous region can be specified conveniently through user coding, allowing a resistance device such as a heat exchanger to be modelled as a porous region within the flow field. The most notable aerodynamic effect of the ACC cell finned-tube bundles is to direct the air stream in a direction perpendicular to the bundle inlet/outlet plane. These effects can readily be included in the ACC cell model by specifying an infinitely high porosity in the directions parallel to inlet/outlet planes of the bundles and a porosity value consistent with the modelled ACC cell pressure drop characteristics in the direction normal to the heat exchanger inlet/outlet plane. The fan is modelled as a moving reference frame with its six blades modelled as rotators, the rotational speeds of which are set up according to the actual rotational speed of the fan on sit.
Figure 14. Computational domain mesh of the A-frame cell with air guiding net
The atmospheric outlet boundary, which is placed 15 m away, so as not to form backward flow near the ACC cell outlets, is modelled as a pressure-outlet boundary condition. The atmospheric inlet boundary is modelled as a mass inlet boundary condition. The bell-mouth fan inlets and two sagging plates are modelled as zero-slip walls. The right and left areas above the cell and the front and rear areas of the cell are modelled as symmetrical boundaries.
The grid independence test can be achieved through the comparison of the average velocity calculated from three numerical models with 2,820,000, 3,650,000, and 4,650,000 cells or control volumes. Since the maximum deviation of the average velocity calculated from the three set grids is less than 1.6%, the middle set of 3,650,000 cells or control volumes as shown in Fig. 14 is specified during the course of numerical investigation.
5.3 Results and discussion
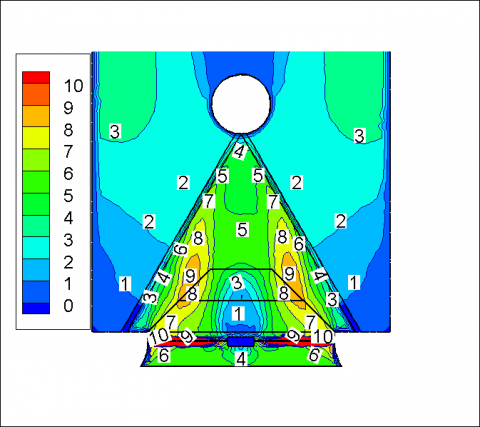
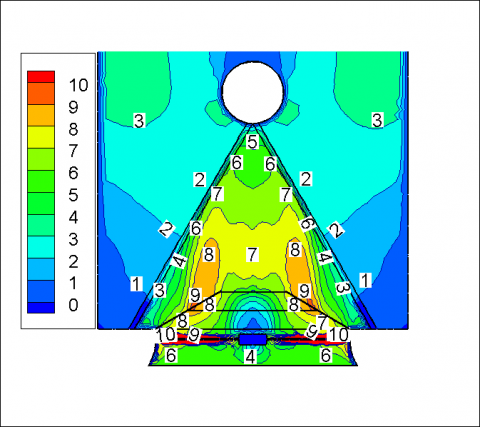
The numerical calculation results of the A-frame cell with different types of air guiding nets are shown in Fig. 15, Fig. 16and Fig. 17.
As reported in Fig. 15, Fig. 16and Fig. 17, the distribution trends of face velocities are similar to each other , and the distribution trends of face velocities as the result of numerical calculation for the tested A-frame cell are in conformity with the experimental data before the air guiding net. This indicates that the introduced methodology for modeling and numerical calculation is reliable to predict the face-air velocity distribution.
As shown in Fig. 15, Fig. 16and Fig. 17, face-air velocity distribution approximately trends to increase from bottom to top along each finned tube when cooled ambient air flow through air guiding net. In other words, opposite to an A-frame cell without any diversion measure, the A-frame cell with air guiding net has the desired characteristics of an FFAVD.
Furthermore, it can be concluded form Fig. 15, Fig. 16 and Fig. 17 that face-air velocity distribution trends was decrease from bottom to top along air guiding net before cooled ambient air flow through air guiding net. Zhang [20] found that there are lots of low temperature areas of downward flowing wavy-finned tube bundles and these areas are easy to freeze. Based on the stimulate results of air guiding net, it can be concluded that the value of velocity of such areas easy to freeze soundly decrease after installing air guiding net. So that air guiding net can be favorable for the antifreezing of ACCs in winter.
Figure 15. Air velocity distribution in the A-frame cell with 45° air guiding net(m/s).
Figure 16. Air velocity distribution in the A-frame cell with 30°air guiding net(m/s).
Figure 17. Air velocity distribution in the A-frame cell with 60°air guiding net(m/s)
In order to investigate the effect of face-air velocity distributions on thermal performance of power plant ACCs, experiments on an A-frame cell chosen from a 1000-MW ultra-supercritical direct air-cooled power plant and on a wind tunnel test bed constructed on-site in a power plant were conducted. Also, the A-frame ACC cell with air guiding net was modeled. One type of FFAVD has been found. An FFAVD denotes a face-air velocity distribution favorable for thermo-performance of power plant ACCs. Favorable characteristics of the A-frame ACC cell with air guiding net were verified. In conclusion, the results show that:
(1) Face-air velocity distribution in power plant ACCs notably affect their thermo-performance.
(2) The FFAVDs for power plant ACCs tended to increase in the retrograde direction of turbine exhaust flow inside wavy-finned tubes rather than being uniformly distributed in this direction. Their existence can be scientifically explained by the principle of field synergy. Face-air velocity distributions tending to increase in the direction of tube-side turbine-exhaust-condensate flow have an adverse effect on thermo-performance of power plant ACCs.
(3) The current power plant A-frame ACC cell has the face-air velocity distribution characteristics opposite to an FFAVD.
(4) The A-frame ACC cell with air guiding net has the characteristics of an FFAVD.
1. D.G. Kröger, Air-cooled Heat Exchangers and Cooling Towers: Thermal-flow Performance Evaluation and Design, vol. 2, Penn well, Tulsa, Oklahoma, USA, 2004.
2. R. Tawney, Z. Khan, J. Zachary, Economic and performance evaluation of heatsink options in combined cycle applications, J. Eng. Gas Turbines Power127 (2) (2005) 397-403.
3. T.F. Fagan. The effects of air flow maldistributions on air-to-refrigerant heat exchanger performance, ASHRAE Transactions 86(2) (1980) 699-713.
4. J. B. Kitto. Effects of maldistribution of flow on heat transfer equipment performance, Heat Transfer Engineering 10(1) (1989)18-25.
5. J.P. Choiu.The effect of air flow nonuniformity on the thermal performance of automobile air conditioning condenser, SAE Transactions 92 (1983) 2.587-2.600.
6. T.J. Rabas. The effect of nonuniform inlet flow and temperature distribution on the thermal performance of air-cooled condensers, ASME HTD 75(1987) 29-35.
7. M.G. Beiler and D.G. Kröger. Thermal Performance Reduction in Air-Cooled Heat Exchangers Duo to Nonuniform Flow and Temperature Distributions, Heat Transfer Engineering 17(1) (1996) 82-92.
8. C.J. Meyer, D.G. Kröger. Plenum chamber flow losses in forced draught air-cooled heat exchangers, Applied Thermal Engineering 18(1998) 875-893.
9. C.T’Joen, M.DePaepe, F.Vanhee. Heat exchanger behavior in non-uniform flow, Experimental Heat Transfer 19 (2006) 281-296.
10. X.Z. Song, D.Huang, X.Y. Liu, Q. Chen. Effect of non- uniform air velocity distribution on evaporator performance and its improvement on a residential air conditioner, Applied Thermal Engineering 40 (2012) 284-293.
11. L.X., Zhou, H.H., Li, S.X., Zhang. Numerical Simulation of Installation of the Deflector in Air- cooling Condenser[J]. Proceedings of the CSEE, 2011, 31(8): 7-12(in Chinese).
12. W.X., Zha, L.J., Yang, etc. Thermo-flow characteristics and air flow field leading of the air-cooled condenser cell in a power plant [J]. Science China Technological Sciences, 2011, 54(9): 2475-2482.
13. L.J. Yang, G. Pu, et al., Flow and heat transfer characteristics of flow guiding device in air-cooled condenser cell, Journal of Engineering Thermophysics, 31(6) ( 2010) 1001-1004 (in Chinese).
14. Y. Guo, D.Y. Li, B.X. Wang, A novel concept for convective heat transfer enhancement, Int. J. Heat MassTransfer 41 (1998) 2221-2225.
15. Y. Guo, S. Wang, Novel concept and approaches of heattransfer enhancement, in: P. Cheng (Ed.), Proceedings of Symposium on Energy and Engineering, vol. 1, BegellHouse, New York, (2000) 118-126.
16. Y. Guo, W.Q. Tao, R.K. Shah, The field synergy (coordination) principle and its applications in enhancing single phase convective heat transfer, International Journal of Heat and Mass Transfer, 48(2005)1797-1807.
17. Yang Jianguo, Liu Da, Zhang Zhaoying, JU Xiaoli. Effects of using wind guiding nets to improve prevailing ambient wind on direct Air-cooled Condensers[J]. Proceedings of the CSEE, 2012, 32(2): 1-8.
18. H.K. Versteeg, W. Malalasekera, an Introduction to Computational Fluid Dynamics, Prentice Hall, Harlow, 1995.
19. B.E. Launder, D.B. Spalding, The numerical computation of turbulent flows, Computer Methods in Applied Mechanics and Engineering 3 (1974) 269-289.
20. Zhaoying. Zhang, Jianguo. Yang, Lijun. Zheng. Experimental research on heat transfer performance of condenser used in 1 000-MW direct air-cooled generator unit [J]. Proceedings of the CSEE, 2014, 34(20): 3317-3323.