Francesco Russo* | Corrado Rindone
© 2026 The authors. This article is published by IIETA and is licensed under the CC BY 4.0 license (http://creativecommons.org/licenses/by/4.0/).
OPEN ACCESS
The beginning of the third millennium was characterized by a large number of disasters causing significant damage. Based on this, the United Nations introduced specific Sustainable Development Goals (SDGs) in Agenda 2030 to minimize the impact of natural and man-made disasters on populations. The basic factor is to organise specific plans for Disaster Risk Reduction (DRR). A relevant role is assigned to exercises aimed at reducing the existing gaps between the formal plan and its implementation during a real disaster. In this context, this paper investigates the main international and national guidelines that promote and address emergency exercises, by focusing on the capacities and capabilities of emergency operators. Available works provide limited guidance on how to assess the potential impacts of planning actions in terms of DRR referring to a performance-based approach; literature refers only to the prescriptive approach. The paper proposes a method based on the Logical Framework Approach that: clearly distinguishes the available resources from the effective results; gives analytical links between capacities, capabilities and DRR. The paper and its results are of interest of scientists and risk management. Furthermore, the paper is of interest to public and private decision makers involved in the emergency planning process.
Disaster Risk Reduction, Logical Framework Approach, evacuation planning, urban transport, emergency exercises
Natural and man-made disasters are producing a relevant quantity of damage and negative effects at global level. In 2024, the international database published by the Centre for Research on the Epidemiology of Disasters (CRED), named EM-DAT, reported 393 disasters linked to natural hazards. These disasters produced 16,753 deaths and impacted 167.2 million people [1]. The consequences of disasters are significant and sometimes permanent. It should be noted that in 2020, the number of people displaced by disasters exceeded 30.6 million [2].
Disaster Risk Reduction (DRR) constitutes one of the main challenges of the Agenda 2030 of the United Nations [3]. This challenge is shared by a range of Sustainable Development Goals (SDGs) and associated targets: SDG1 and target 1.5, SDG11 and targets 11.5 and 11.b, SDG12 and target 12.4, SDG13 and target 13.1. Table 1 summarises the SDGs, targets and indicators for measuring DRR.
Table 1. Summary of Sustainable Development Goals (SDGs), targets and indicators relating to Disaster Risk Reduction (DRR)
|
SDG |
Targets |
Indicators |
|
SDG 1 |
1.5 Build Resilience to Environmental, Economic and Social Disasters |
1.5.1 Number of collecting programmes that aim to build resilience to climate-related events and other shocks and disasters, for example by forming collections that can contribute to related educational and research programmes. |
|
1.5.2 Number of educational programmes drawing on collections that incorporate resilience perspectives. 1.5.3 Number of targeted programmes drawing on collections that are aimed at vulnerable groups, to build their resilience to climate-related and other shocks and disasters. 1.5.4 Number of research programmes drawing on collections that are aimed at building resilience to climate-related and other shocks and disasters. |
||
|
SDG 11 |
11.5 Reduce Deaths and Economic Losses |
11.5.3 (a) Damage to critical infrastructure and (b) number of disruptions to basic services, attributed to disasters. |
|
SDG 12 |
12.4 Manage Chemicals and Waste |
12.4.1 Number of countries with institutional and juridical tools. 12.4.2 Dangerous waste. |
|
SDG 13 |
13.1 Strengthen Resilience and Adaptive Capacity to Climate-Related Hazards and Natural Disasters in All Countries |
Shared indicators with SDG 1 and 11 (1.5.1, 1.5.3, 1.5.4). |
Quantitative indicators allow for the monitoring of both direct impacts (deaths, economic damage, hazardous waste management) and institutional strategies (national and local risk reduction plans).
The 2030 Agenda is closely linked to the “Sendai Framework for Disaster Risk Reduction” [4]. This indicates four priorities for action relating to: 1) understanding disaster risk, 2) strengthening disaster risk governance, 3) investing in disaster reduction for resilience, and 4) enhancing disaster preparedness for effective response and "Building Back Better”. The priorities are broken down into seven global objectives (Table 2) and thirty-eight indicators to monitor the strategy’s progress.
Table 2. Global targets of the Sendai Framework
|
Global Target |
Description |
|
A |
Substantially reduce global disaster mortality by 2030, aiming to lower average per 100,000 global mortality between 2020-2030 compared with 2005-2015. |
|
B |
Substantially reduce the number of affected people globally by 2030, aiming to lower the average global figure per 100,000 between 2020-2030 compared with 2005-2015. |
|
C |
Reduce direct disaster economic loss in relation to global gross domestic product (GDP) by 2030. |
|
D |
Substantially reduce disaster damage to critical infrastructure and disruption of basic services, among them health and educational facilities, including through developing their resilience by 2030. |
|
E |
Substantially increase the number of countries with national and local Disaster Risk Reduction strategies by 2020. |
|
F |
Substantially enhance international cooperation to developing countries through adequate and sustainable support to complement their national actions for implementation of this framework by 2030. |
|
G |
Substantially increase the availability of and access to multi‑hazard early warning systems and disaster risk information and assessments to the people by 2030. |
Literature provides a well-established analytical formula for quantitatively assessing the “risk” (R) of disasters and its components [5] as the product of three components: “occurrence” (O), measurable through the probability (or frequency) of a disaster occurring; vulnerability or inverse of a system's resistance (V), measurable through the probability that the system and its components will withstand the effects of the disaster; exposure (E), measurable through the probability (or frequency) that a given number of people and/or things will suffer the effects of the disaster:
R = O × V × E
This paper focuses on the exposure component and possible mitigation measures, particularly those related to evacuation procedures for urban areas via the transport network.
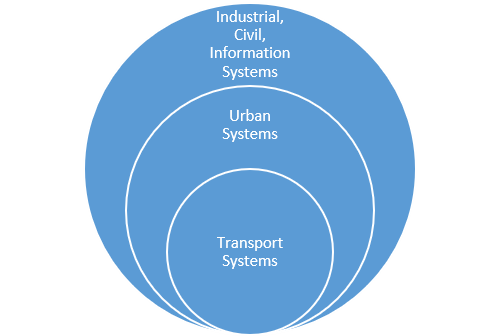
With regard to evacuation procedures, reference may be made to various categories of general systems, including industrial, civil, and information systems. This research focuses in particular on urban systems and, more specifically, on the central role of transport systems (Figure 1). By its very specific nature, this system comprises components belonging to the three general systems, and it requires specific attention due to its fundamental role.
Figure 1. Systems for evacuation
In an urban transport system, the main aim of evacuation is to reduce the number of people in the disaster-affected area, from an initial exposure level (Eini) to a final level after the evacuation (Efin). Given the same probability of occurrence and the same vulnerability, risk reduction is achieved if:
Efin < Eini
The condition is met if the performance of the transport system and the decisions made by its managers ensure that people can be quickly and safely evacuated from the disaster-affected area to safe locations.
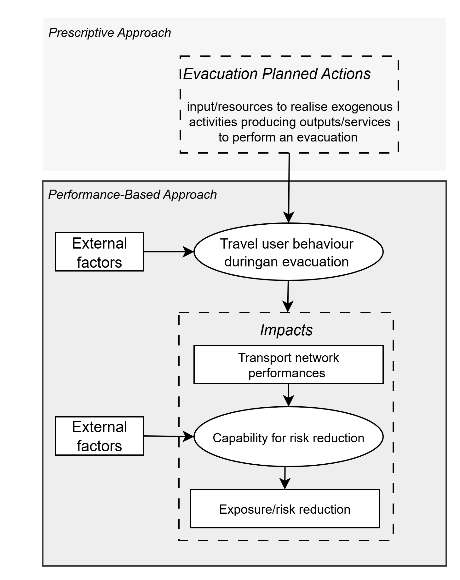
The problem that arises is how to link the actions that can be envisaged in an evacuation transport plan with what will happen in real systems at the time of the disaster. In this context, there are two types of planning approaches:
•Prescriptive approach, in which those in charge (policymakers and managers) must demonstrate that they have adopted a plan, regardless of the actual results it may produce;
•Performance-based approach, in which the aim is to assess in advance whether managers’ knowledge and skills can lead to an actual reduction in exposure when responding to an emergency.
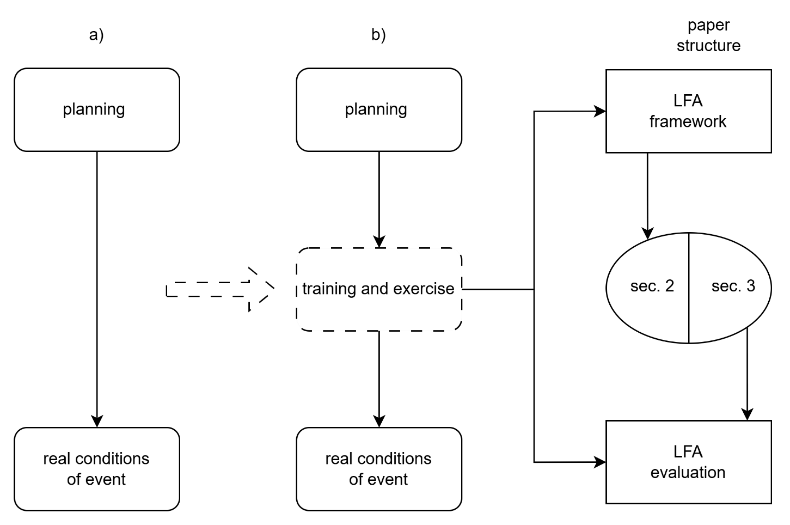
The main advantage of the performance-based approach is its contribution to the construction of causal chains and the identification of measurable analytical links between actions and DRR. This is similar to the functions available in other transport sectors [6]. Following the performance-based approach, training and exercises play a decisive role. In fact, the evacuation plan is not the only response to the problem of risk reduction if it is reduced to a single formal document. Preparedness actions need to be defined and implemented in order to bridge the gap between the plan and its real-world implementation in the event of a generic disaster. Training and emergency exercises play an important role in the preparedness phase. These activities provide an opportunity to diffuse social knowledge and test the effects of the actions outlined in the plan in the field and to obtain feedback to improve the performance of the system in evacuation conditions (Figure 2). It is therefore useful to develop a set of training and exercises between the plan and the current conditions of a disaster event.
Figure 2. Role of training and exercises
It is necessary to define two levels of study:
•A framework of preparedness actions for managers and the community as a whole;
•Some quantitative methodologies for assessing in advance the effect produced by the implementation of generic training and/or exercise action.
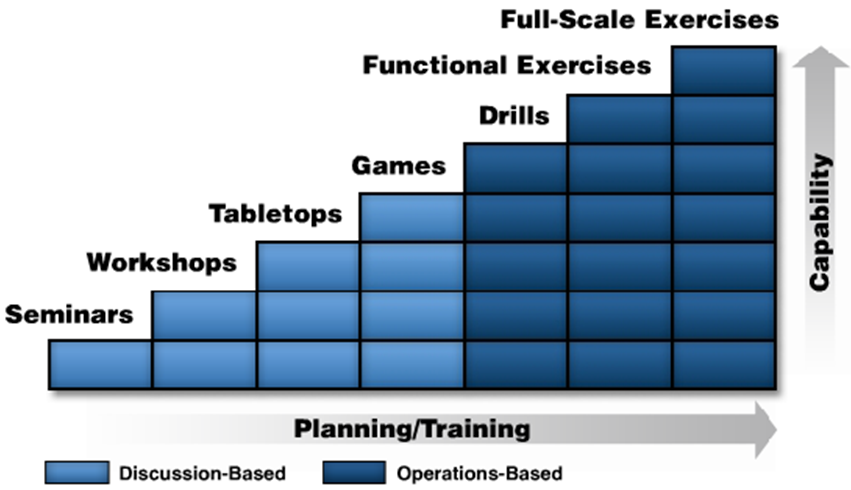
Following the disasters of the Twin Towers and Hurricane Katrina, the US agency FEMA set up a Homeland Security Exercise and Evaluation Program (HSEEP) (Figure 3), which is constantly updated. FEMA defines an exercise as “an event or activity, conducted through discussion or action, to develop, evaluate or validate plans, policies, procedures and capabilities that jurisdictions/organizations can use to achieve planned objectives” [7].
In line with the research’s objective, the literature review presented in this paper aims to investigate whether alternative approaches to evacuation planning exist beyond the traditional prescriptive approach. The aim is to determine whether there are guidelines that promote performance-based approaches, highlighting the links between resources, actions and DRR.
From the literature, it emerges that for each training and exercise activity to be carried out in virtual conditions, as defined by any State, the main characteristics to be studied are:
•Capability, assessed as the ability to intervene in real conditions to reduce exposure, and therefore the possibility of expressing an indicator of the pursuit of the reduction objective;
•Complexity of planning and training, assessed as the number and type of actors involved in the specific activity.
Training and exercise activities can be classified according to an increasing level of capability. The two main classes refer to discussion-based actions that can be carried out in a virtual environment and operation-based actions that take place in a real environment. These concepts are indicated in guidelines published in different parts of the world. The main approaches followed in international guidelines are outlined below with reference to individual countries.
One of the main methods used by international agencies to understand the relationships between resources, actions and results is the Logical Framework Approach (LFA). Originally developed as a planning tool for the U.S. military, LFA was later adopted by the main agencies for development as a results-based management approach [9]. LFA offers the possibility of highlighting the logic behind an action to be carried out, for instance, identifying the relationships between the resources used, the activities to be carried out, and the specific and general objectives to be pursued.
In the case of evacuation transport planning, the LFA makes it possible to clarify the logic behind the plan's actions by identifying the resources to be used to carry out one or more actions, the services provided, users' perception of these services, and thus the reduction in exposure and risk, in line with the pursuit of the SDGs and Sendai priorities. With regard to training and exercise actions, it is necessary to quantify different elements: the number of personnel involved and the hours provided; the contribution that exercise actions can offer by simulating an evacuation procedure in terms of exposure reduction.
The increasing complexity involved in planning and conducting exercises is referred to in the US as the “Progressive Exercise Planning Approach” (PEPA). This involves defining and developing a set of exercises within a programme, i.e., an ordered sequence of actions that provides for a gradual increase in operational complexity and the amount of resources and personnel involved.
It is important to highlight the term “capability” (or “what you can do”) introduced by FEMA, as opposed to the established term “capacity” (or “how much you can do”). While the former, “capability”, refers to the ability to perform a specific function in response to a risk or emergency and includes expertise, plans, equipment and training, the latter, “capacity”, refers to the quantity or level of resources available for that function.
In this context, the following research questions emerge:
•How can the LFA methodology be used for risk applications in urban transport systems to produce a general framework, and what contribution has scientific literature made?
•How do international guidelines address the issue of indicators for measuring risk reduction in relation to the evaluation of SDGs of Agenda 2030?
The two research questions are entirely complementary because they lead to the definition of indicators and the identification of where they should be placed.
In relation to the first research question, the general objective of this paper is to increase social knowledge about the quantification of exercises’ contributions to DRR. To this end, the LFA is used in order to adopt a structured assessment framework, widely used by international agencies to support the design and monitoring of actions in different areas. Specifically, this paper presents a review of: LFA application for risk reduction actions; scientific approaches to measuring exposure reduction.
To answer the second question, the guidelines available at the international level are analysed to verify whether indicators are present and to which class they belong.
According to the general and specific objectives, after this introduction, the paper has four sections. Section 2 summarises the key features of the LFA and its applications for measuring exposure reduction in the context of transport system performance. Section 3 analyses technical literature on evacuation by urban transportation networks. Section 4 reviews available scientific literature on exercises for exposure reduction and presents a specific exercise to highlight the suitability of using LFA to reduce exposure by means of a specific discussion-based action. Section 5 closes the paper with the main findings and future perspectives of the research.
The analysis of documents and papers highlights the main gap in the literature that this paper aims to address. This section refers to:
•LFA specified for structuring an evacuation plan;
•scientific works presenting methods and models for reducing exposure, with specific reference to the analysis of training and exercises.
2.1 Logical Framework Approach structures
Sustainability and global challenges related to DRR impose the evaluation of the potential impacts produced by evacuation planning using transportation networks. The aim is to understand how the resources (human and financial) used to develop actions produce impacts in terms of risk reduction. The primary concern is to ascertain the extent to which evacuation training and exercises contribute to risk reduction. To this end, the paper adopts the LFA approach used in various technical and scientific fields to assess in a structured manner the effects of a generic action in the context of the “theory of change” [10].
European Commission adopts the LFA (or its variants) as a standard method required by many donors for grant applications [11]. The LFA tool is recommended for assessing how resource use can achieve objectives in relation to quantitative targets. A further element to consider concerns the difference in the assessment of tangible and intangible actions aimed at risk reduction.
The effects of tangible actions affect the material/immaterial structure of a system and can be assessed using established methods (e.g. structural calculations). For example, the design of embankments or earthquake-resistant buildings can be assessed using scientific and empirical approaches. Nevertheless, the quantitative estimation of the effects of immaterial actions, including exercises, is more complex. Indeed, in the latter scenario, the consequences are contingent on heightened awareness, behavioural modification, or an augmentation in competencies and organisational elements [12].
The Hyogo Framework for Action (HFA) 2005–2015 is the action program preceding the Sendai Framework; HFA recommends adopting the LFA approach to assess the level of preparedness [13]. For this reason, the United Nations has produced guidelines for defining classes of indicators for the individual components of LFA [14]. The proposed indicators mainly refer to capacity and capability in relation to preparedness planning and readiness for response.
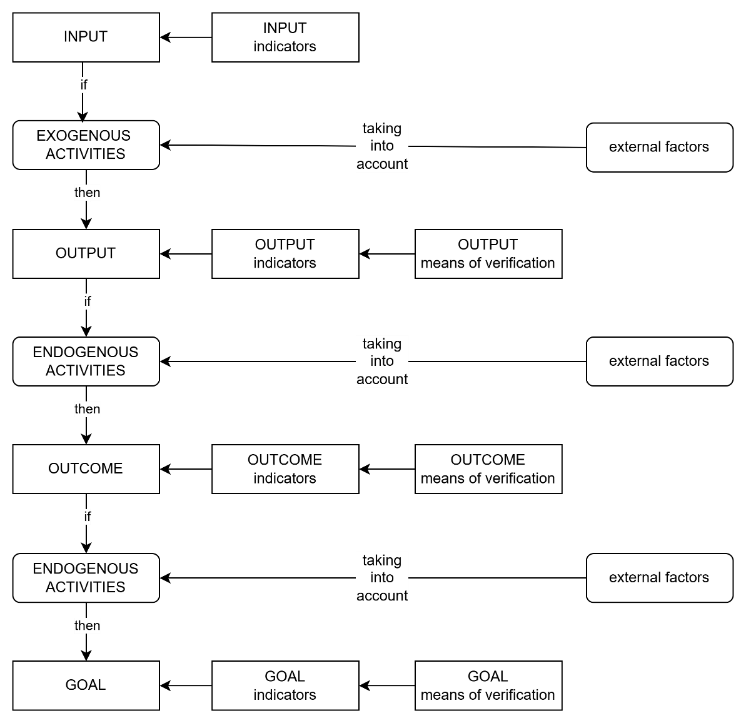
Russo and Rindone [15] proposed a prototypal adaptation of LFA for evacuation planning, specifying its main components:
•inputs or available resources to implement evacuation procedures, including people (for instance, police forces, volunteers, coordinators) and means for enabling mobility between dangerous and safe areas;
•exogenous activities or evacuation planning actions, including exercises to test evacuation procedures;
•outputs or products and services useful for enabling mobility in evacuation conditions;
•endogenous activities representing an increase in knowledge with respect to internal interactions in the transport system between its components (demand and supply); for instance, consider how transport services influence mode choice;
•outcomes or intermediate results in terms of the modification level of knowledge regarding the influence of the transport system on the travel users' behaviour in evacuation conditions;
•endogenous activities to evaluate the evolution from outcomes, measured in terms of knowledge of transport system performances (e.g. link times and flows; path times towards safe areas), to global capability regarding goals, measured in terms of achievements of SDG and Sendai targets;
•goals or final results in terms of the modification level of exposure and then risk reduction.
Each component can be measured with SMART (Specific, Measurable, Achievable, Relevant, Time-bound) indicators and compared with available and fixed targets.
In LFA, elements are connected by relationships that follow an “if” → “then” logic. The transition between two successive elements depends on external factors, i.e. on all the boundary conditions in which the system evolves (Figure 4).
Figure 4. Logical Framework Approach
Table 3. Example of LogFrame for training and exercises
|
Indicator |
Baseline and Targets |
Means of Verification |
External Factors |
|
Inputs indicators (e.g. number of teachers) |
National and international references (e.g. Sendai targets) |
Data sources, methods and models for calculating indicators (e.g. Transport System Model-TSM) |
Elements out of control by decision makers (e.g. panic behaviours or policy decisions) |
|
Exogenous Activities indicators (e.g. number of performed exercises) |
|||
|
Outputs indicators (e.g. unit of emergency operators trained) as capacity |
|||
|
Endogenous activities indicators (e.g. evaluation of adopted functions) |
|||
|
Outcomes indicators (e.g. capability level to reduce total evacuation times) |
|||
|
Endogenous activities indicators (e.g. evaluation of adopted functions) |
|||
|
Goals indicators (e.g. number of death) |
Note: LogFrame = Logical Framework Matrix.
The LFA is summarised in the Logical Framework Matrix (or LogFrame), translating into quantity and formal relationships the framework in the LogFrame matrix, consisting of (Table 3):
•Seven rows, one for each component (input, exogenous activities, output, endogenous activities, outcomes, endogenous activities and goals);
•Four columns corresponding to:
◦indicators, i.e. measures associated with each component;
◦baseline and targets;
◦means of verification, including models and methods for calculating indicators;
◦external factors, including elements that cannot be controlled by the planner.
Further investigation is required to determine the potential benefits that result from the implementation of one or more training and exercise actions [16]. It is necessary to distinguish between the organisational phases and the related resources (input), activities (activity) and products (output) from the immediate results (outcome) and long-term results (goal). An example of estimating the risk occurrence in the case of transporting dangerous goods is presented in the studies of Russo and Rindone [15, 17], which adapts Transport Risk Analysis (TRA) and estimates indices based on the type and quantity of hazardous substances transported.
2.2 Transport Risk Analysis
TRA provides a systematic framework for quantitatively estimating the risks associated with transport systems through the analysis of both the likelihood of catastrophic events and the consequences arising from their occurrence. TRA is applied across numerous transport sectors, contributing to the quantification of the achievements of the 2030 Agenda in various ways [18].
In the specific context of this paper, TRA enables us to assess how the proper management of transport infrastructure and services can reduce exposure, as outlined in the introduction. Quantitative models need to be developed to simulate transport demand and supply and their mutual interactions, in order to represent the progression of disaster scenarios and identify risk mitigation measures through transport planning. As highlighted [5], transport networks, interactions between users, infrastructure and regulations can either amplify or mitigate risk. The ultimate aim of TRA is to support public decision-makers in defining effective mitigation strategies, through physical and non-physical infrastructure interventions, mobility management policies and safety measures, adopting an integrated and preventive approach [19]. Recently, the integrated use of Emerging Information and Communication Technologies (e-ICT) tools alongside Transport System Models (TSMs) has made a significant contribution to TRA in the planning of transport systems under risk conditions [20], as well as to the preparedness phase through the design and implementation of emergency simulations and exercises [21]. It should be noted that TRA’s contribution to achieving the SDGs is evidenced by recent literature [22].
2.3 Transport System Models for evacuation planning
The study of risk exposure involves understanding transport systems and their components, i.e. mobility demand in terms of people's travel needs over a given period of time, transport supply, which includes the infrastructure and services that enable people to travel, and their interaction in terms of performance (e.g. flows and times) of individual elements and the entire system [23, 24]. Literature presents consolidated approaches for the modelling of transport systems and their individual components. TSMs are widely used to represent systems under normal conditions. TSMs are currently being developed to represent transport systems in emergency situations, particularly during evacuations [5].
TSMs can be employed to simulate the performance of transport systems under emergency conditions produced by a disaster. The main mathematical equations representing the TSM in a dynamic approach with ordinary conditions are presented in previous research [25, 26]. Advanced analyses regard the transport supply component aimed at quantifying the level of centrality of nodes and links in a general urban transport network. This is possible by adopting network analysis approaches [27]. In evacuation conditions, it is important to represent the temporal variations of the transport system in relation to dynamic evolutions. The entire system is represented by means of six equations that enable analysts to evaluate transport system performance during evacuation conditions. For improving these performance towards risk reduction goals and target, two methodological approaches can be adopted [28, 29]: (i) a “what-if” approach, which assesses the impacts of planned interventions aimed at modifying transport services and infrastructure to manage emergencies; and (ii) a “what-to” approach, which seeks to design an optimal transport system configuration that minimizes exposure to risk. Some comprehensive reviews of evacuation transportation modelling are provided by different authors [30]. TSM applications allow analysts to calculate outcome indicators in relation to the ex-ante evaluation of evacuation plans and experiment with these plans in a stress-free environment.
Emerging information and communication technologies (e-ICTs) can enhance TSM's ability to represent real emergency conditions. Information and data collected by e-ICT can be used to integrate the TSM building process (specification, calibration and validation). E-ICT tools can be employed to update travel utility functions [31], thereby enabling dynamic modelling of travel choices under emergency conditions [20]. ICT solutions and TSMs can be integrated within a spatial Decision Support System (DSS), which is configured as a digital twin (DT) [32], which provides emergency managers with preventive insights regarding the potential impacts of their decisions. The most advanced approach regards the construction of a serious game for representing user behaviours in an evacuation procedure [21] that, from a general point of view, converges to a DT.
Inside the general problem of evaluating goal indicators from outcomes, there is a recent problem that emerges (RISK 2022 [20, 33, 34]) concerning the method, for instance the specification of the model, as a result of the definition of the problem, and the identification of the relevant parameters and any coefficients for experimentation with the definition of the tests to be carried out in reality and any emerging ICTs to be used [35, 36]. This involves creating specific exercises [37] which are supported by the use of e-ICTs such as Digital Twins, that reproduce an emergency scenario in a virtual environment [32]. Further experimentation may be useful to explore the contribution of other e-ICTs, such as blockchain [35]. It is necessary to verify which parameters are present in the international literature to reduce the risk component related to exposure in order to plan the safe destination to be reached and the route to be followed in the urban network by the various population groups after the risk of a disastrous event that could affect the city has been communicated (or is approaching). The challenge is to assess the level of user perception of the evacuation plan instructions [20, 31, 34, 38, 39].
Table 4 summarises the literature referenced and produced as part of the PRIN RISK 2022 research project. The table classifies each reference according to:
•Research topic;
•Exercise class;
•Typology of e-ICT;
•Presence of indicators to measure some LFA component.
Table 4. Summary of scientific literature about Transport Risk Analysis (TRA) and Transport System Models (TSMs)
|
Reference |
Research Topic |
Indicators |
LFA Component |
|
[31] |
Exercises evaluation |
Exposure reduction by exercise |
Outcome |
|
[37] |
Exercises classification |
Exposure reduction by exercise |
Outcome |
|
[34] |
TSM |
Users’ utility |
Outcome |
|
[32] |
Literature review |
- |
Generic activity |
|
[40] |
Risk reduction by seminar |
Seminar evaluation |
Outcome |
|
[20] |
TSM |
User’s utility |
Outcome |
|
[35] |
Literature review |
- |
Endogenous activity |
|
[36] |
Literature review |
- |
Endogenous activity |
|
[21] |
Risk reduction by serious games |
Orientation time |
Goal |
|
[20] |
TSM |
Users’ utility |
Outcome |
|
[38] |
User Behaviour in emergency conditions |
Measures of risk factors |
Goal |
|
[39] |
User Behaviour in emergency conditions |
Measure of e-ICT perception |
Outcome |
Note: LFA = Logical Framework Approach.
2.4 Logical Framework Approach specification for exposure reduction in urban transportation networks
The proposed framework is based on the LFA approach [12, 15]. It is necessary to specify:
•Inputs, in terms of human, financial and technical resources to perform an evacuation; it is possible to evaluate their effectiveness, cost-effectiveness and appropriateness;
•Exogenous activities and processes, related to the execution of tasks to perform an evacuation, including influencing factors;
•Outputs or immediate products and services provided by the evacuation plan;
•Endogenous activities related to travel user behaviour during an evacuation and the factors that influence travel choices;
•Outcomes in terms of impacts or transport network performances (e.g. link times, flows and evacuation times);
•Endogenous activities related to the transformation from transport performances to risk reduction;
•Goals measured as exposure reduction and therefore risk reduction.
Actions in terms of inputs and exercises, through exogenous activities, produce outputs in terms of capabilities (Figure 5) that must be measured.
The problem then becomes predicting the introduction of analytical formulations that allow the effect of the exercises on changes in the behaviour of decision-makers and end users to be estimated in advance. A concrete example concerns evacuation routes. The set of exercises has effects on two sub-processes:
•Awareness of the routes to follow in an emergency to reach a safe destination;
•Learning process on the optimal route indicated in the evacuation plan, which allows the minimum level of exposure (Emin) to be achieved.
A series of exercises helps to achieve the Emin exposure level, which corresponds to the reduction in disaster risk estimated in the plan.
From the previous analyses, it is clear that specific indicators should be identified for each of the LFA phases in each class of exercise. The different types of indicators make it possible to identify the achievement of the targets for the four components: input, output, outcome and goals.
The proposed specification, therefore, allows the entire process to be monitored, not just the achievement of the final goals. Monitoring the process allows shortcomings and deficiencies to be identified and any necessary changes to be made along the way, rather than only finding out the results by evaluating the indicators relating to the goals.
Figure 5. Proposed framework: from prescriptive to performance-based approach
From the results of the previous sections, it emerges the necessity to identify indicators that are specific to each component of LFA adapted for evacuation planning.
In this section, the macro-phases into which time can be divided are analysed with respect to a potential disaster event, highlighting those relating to planning and those relating to training and exercises. Where available, the indicators proposed in the technical literature are examined in the second part of the section with respect to the LFA components.
3.1 Time frames for risk reduction
One of the essential elements for risk reduction is institutional capacity for resilience, with reference to the capabilities needed to perform one's role in all five key areas of the United Nations strategy called Disaster Risk Reduction.
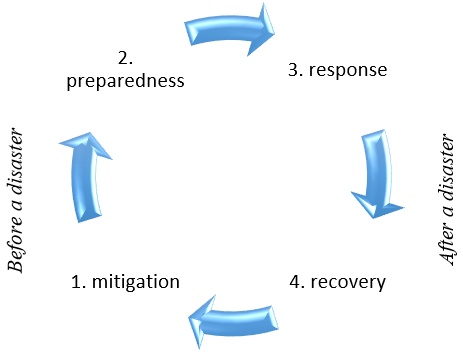
At the international level, the integrated disaster risk management cycle is generally organised into four main phases, which represent a circular and continuous process identified with the following keywords (Figure 6) [41]:
1. mitigation or prevention, aimed at reducing risks before the disaster occurrence through planning and procedures (e.g., adopting an emergency plan, defining evacuation procedures, etc.);
2. preparedness, aimed at increasing the capacity of organisations and the population to put the emergency plan into practice before a disaster occurs (e.g., exercise, training, awareness raising, etc.);
3. response, aimed at ensuring an immediate response after the verification of an event to save lives and reduce damages (e.g., rescue operations, healthcare, distribution of basic necessities);
4. recovery, aimed at restoring normal conditions and reducing future risks (e.g., infrastructure reconstruction, economic and social support, etc.).
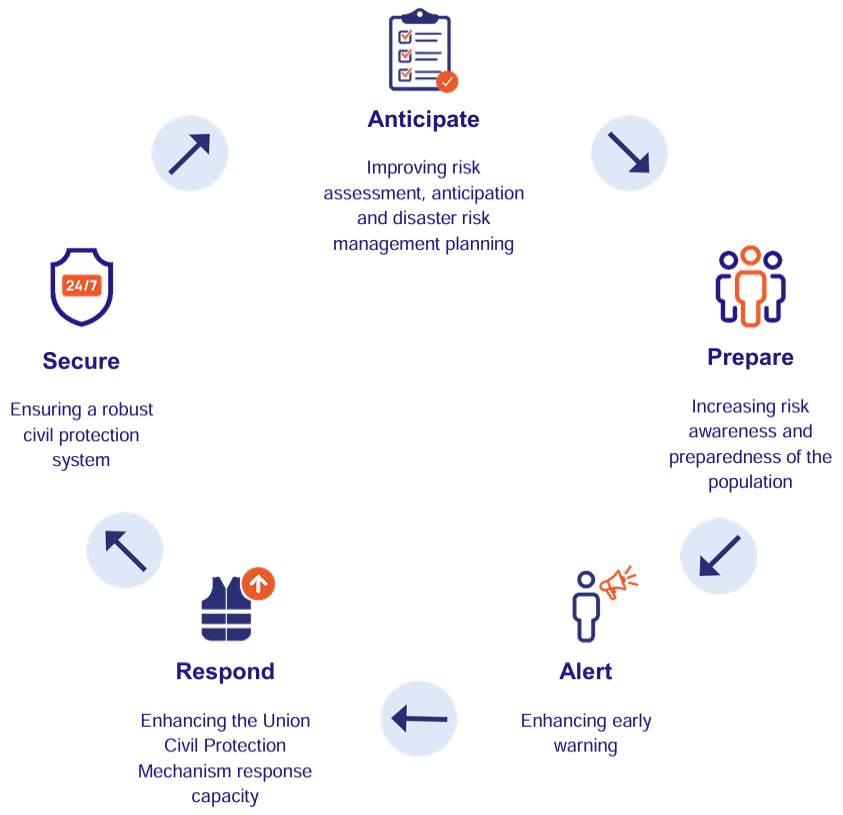
To address the challenges associated with DRR, the European Commission has published a recommendation and a communication aimed at establishing common objectives and related strategies. These objectives, known as the European Disaster Resilience Goals [42], are divided into five key areas identified as follows (Figure 7):
1. anticipate or enhancing risk assessment;
2. prepare, through the improvement of public awareness;
3. alert, by strengthening early warning systems;
4. respond, strengthening early warning systems;
5. secure in order to ensure continuous service during and after disasters through coordination and information exchange.
The goals are aimed at strengthening the EU's collective capacity to deal with disasters and improving the EU's and Member States' ability to respond to future crises, such as the impacts of climate change and pandemics, by promoting cross-cutting, inclusive and evidence-based actions.
Table 5 shows a comparison between the two approaches to defining the risk management cycle.
Table 5. Comparison between United Nations (UN) and European Union (EU) risk management cycles
|
Disaster Phase |
United Nations |
European Commission |
|
Before |
Mitigation |
Anticipate |
|
Preparedness |
Prepare |
|
|
EVENT |
|
Alert |
|
After |
Response |
Respond |
|
Recovery |
Secure |
The table shows that, while the ‘before’ phases are identical, the ‘after’ phases in fact are different in that the European Commission alert appears independently of the response phase.
3.2 Training and exercises for reducing risk with preparedness
The central element of the assessment is the ability to regularly develop training and exercises that include community members and volunteers. It is necessary to integrate risk reduction and response capabilities across multiple stakeholders, from top emergency managers to single citizen. The level of effectiveness and efficiency in preparedness, response and recovery operations must be increased.
Analysis of the SDGs, targets, and Sendai Framework highlights the role of understanding disaster risk, as emphasised in priority 1, “understanding disaster risk”. Knowledge supports the emergency planning process, including the identification of strategies and priorities for action. The relevance of this aspect is confirmed in the Sendai midterm review published in 2023 [43]. The launch of the framework has played a decisive role in improving knowledge and information on risks, providing a common language and a reference framework for national governments. However, further research is needed to better understand the phenomenon and improve disaster risk management capacity and capability. In accordance with the Sendai Framework, various United Nations agencies, as part of programmes aimed at risk reduction, have produced guidelines aimed at promoting preparedness actions, including training and exercises. The problem is therefore to identify output, outcome and goal indicators.
Following the publication of the Hyogo Framework [14], which, as introduced in Section 1, promotes the LFA approach and the consistent organisation of indicators, the subsequent Sendai guidelines refer to the components of the LFA. Some guidelines, in particular, indicate how many people should be involved in exercises and what type of people they should be [7, 44-46]. Most of the documents found illustrate and classify the types of exercises that can be implemented, in accordance with the classification introduced in Section 1 [44, 47-50]. A great part of the recurrent approach mainly follows a prescriptive approach as suggested by international standard norms, like ISO 22398:2013 [51], and core standards from disaster-prone countries like China and Japan. The standards suggest implementing an “exercise process to train for, assess, practice, and improve performance in an organisation”. However, there remains a lack of clarity regarding the various elements of the process to be assessed and the logical connections between them.
The World Health Organisation (WHO) proposes the characteristics of a generic emergency exercise or SIMEX [52]. Some types of exercises are included in annual or multi-annual national programmes [53]. The WHO guidelines are referred to in the guidelines [54] to provide guidance on the choice of exercise to be implemented based on the objectives to be achieved, particularly concerning increasing capability.
It is possible to extract potential output and outcome indicators from the cited sources.
The definitions found in the literature appear sometimes to be confusing and overlapping with the various indicators proposed. Initial confusion can be eliminated by defining output indicators solely in terms of capacity, i.e., numerical variables that can be objectively measured at the end of a training or exercise activity. Output variables are therefore variables such as number of participants, resources available, etc.
In this way, output variables and capacity variables are associated in a one-to-one way. These variables are the result of carrying out “exogenous activities” at the first level. The problem is therefore moving on to outcomes. The proposal is to move through “endogenous activities” such as assessment methods. This structure allows many guidelines to be read in an organic and easily decodable way. Outcome variables can be defined in terms of capability.
Most national guidelines outline the types of outcomes (following the introduced definitions) generated by the exercises. Reference is mainly made to the development of capabilities, in terms of certification of the skills acquired through the performance of the planned activities. UNESCO refers to tsunami preparedness [44, 48]. Other guidelines refer to different types of disasters, for example those in Australia [55], New Zealand [45], Sweden [49, 50], and Italy [46].
In accordance with the Sendai Framework, the United Nations has developed a ‘City Disaster Resilience Scorecard’ structured around ten essential elements for making cities resilient [56]. Disaster resilience refers to a city's ability to understand the disaster risks it may face, mitigate these risks, and respond to disasters. The guide indicates the need to develop “most likely” and “worst case” risk scenarios for each of the hazards identified for the city, or for a potential multi-hazard event. Two main levels are identified:
•Level 1 or preliminary level, which concerns the objectives and indicators of the Sendai Framework;
•Level 2 or detailed assessment, which involves different actors and forms the basis for developing a resilience action plan for the city; this includes 117 criteria measured with indicators based on a scale from 0 to 5.
In addition to capabilities, the American guidelines define tasks to be performed in various areas, such as planning, logistics, telecommunications, transport, etc., and establish a set of standards (core capability targets) with specific indicators and targets [7]. FEMA's Target Capabilities List (TCL) describes the capabilities associated with the four areas of homeland security (Prevention, Protection, Response and Recovery). The CDEM Capability Assessment Tool, referred to the New Zealand guidelines, allows capabilities to be assessed against national objectives. For this reason, aggregate measures of capabilities are used, classified according to a “maturity index” as “unsatisfactory”, “developing”, “progressing” or “mature”.
Table 6. Summary of investigated guidelines
|
Institution |
Ref. |
Agency |
Programme |
Indicators |
||||||
|
Year |
Input |
Activities |
Output |
Outcomes |
Goals |
LFA |
||||
|
United Nations |
[14] |
UNDRR |
Hyogo Framework for Action (HFA) |
2008 |
no |
no |
yes |
no |
no |
yes |
|
United Nations |
[54] |
UNDRR |
Words into Action Guideline |
2020 |
no |
no |
no |
no |
yes |
yes* |
|
United Nations |
[44] |
UNESCO –Intergovernmental Oceanographic Commission |
Multi-Annual Community Tsunami Exercise Programme |
2021 |
yes |
yes |
no |
yes |
yes |
no |
|
United Nations |
[47] |
UNDRR |
Sendai Framework for Disaster Risk Reduction 2015-2030. |
2022 |
no |
no |
no |
no |
yes |
no |
|
United Nations |
[48] |
UNESCO –Intergovernmental Oceanographic Commission |
Tsunami Ready Recognition Programme |
2022 |
no |
yes |
yes |
yes |
no |
no |
|
United Nations |
[52] |
WHO |
2025 |
no |
yes |
no |
no |
no |
yes** |
|
|
USA |
[7] |
FEMA |
National Preparedness System |
2020 |
yes |
yes |
yes |
no |
yes |
yes |
|
New Zealand |
[53] |
- |
National Science Challenge |
2020 |
no |
yes |
no |
no |
no |
no |
|
Australia |
[55] |
National Emergency Management Agency |
- |
2023 |
yes |
yes |
yes |
|
yes |
no |
|
Sweden |
[49] |
Swedish Civil Contingencies Agency. |
Evaluation of Exercises |
2011 |
no |
no |
yes |
no |
yes |
no |
|
New Zealand |
[45] |
National Emergency Management Agency |
National CDEM Exercise Programme |
2015 |
yes |
yes |
yes |
no |
yes |
yes** |
|
Sweden |
[50] |
Swedish Civil Contingencies Agency. |
Evaluation of Exercises |
2016 |
no |
yes |
yes |
no |
yes |
no |
|
Italian State |
[46] |
Protezione Civile |
Codice della protezione civile |
2018 |
yes |
yes |
yes |
no |
no |
no |
|
European Union |
[57] |
European Civil Protection and Humanitarian Aid Operations |
Union Civil Protection Mechanism (UCPM) |
2024 |
yes |
no |
no |
no |
no |
no |
Note: * reference to another guideline 33487_33487gessimulationguideenglish.pdf. ** partially. LFA = Logical Framework Approach; DRR = Disaster Risk Reduction; WHO = World Health Organisation.
The UNESCO guidelines refer to objectives, indicators and targets for measuring tsunami preparedness and related evacuation procedures. There are examples for testing the communication system against certain pre-set targets [44, 48]. Examples of outcome indicators are available for some American cities that apply the FEMA approach.
Table 6 provides a summary of the guidelines found. For each guideline, the presence or absence of indicators for the individual components of the LFA approach is highlighted:
•Input with reference to the available resources;
•Activities with reference to exercises;
•Output with reference to the products and services of the action plan, including the immediate results of exercises;
•Outcomes with reference to the performance of evacuation exercise;
•Goals-target with reference to those of 2030 Agenda and Sendai.
For each examined document, it is marked whether or not (yes/no) there is a formulation of a LFA indicator in relation to its components.
The picture that emerges is highly heterogeneous. Many guidelines refer only to the outputs to be achieved. A limited number of guidelines refer to outcomes. None of the documents consulted reports analytical functions that relate outputs to outcomes and goals. There is a need to further develop these analytical functions in order to support evacuation planning, with particular reference to exercises aimed at increasing preparedness and reducing the gaps between the mitigation and response phases in the event of a real-world emergency.
The technical literature highlights a limited exploration of the effectiveness of exercises in relation to individual and/or organisational preparedness for emergencies.
For example, exercises involving the healthcare community are considered an important and integral part of preparedness activities.
4.1 Immaterial actions of an emergency plan
The previous section highlighted some gaps in technical literature. It is therefore useful to refer to scientific literature to verify the existence of a scientific frame of reference for evacuation using transport network.
Specific attention is given to the field of research concerning training and exercises for evacuation using the transport system and the possibility of measuring the benefits in terms of risk reduction.
Training and exercises are among the immaterial measures of a plan aimed at reducing risk and, in particular, exposure.
The plan measures and planning methods are of interest to emergency managers (M) and public authorities (Pa).
The plan measures include training and exercises. Russo and Rindone [58] emphasised the role of emergency exercises and their potential contribution to emergency planning in a back path. The methodological framework for organising exercises is based on the American HSEEP Programme [7]. In particular, it is necessary to measure the potential benefits of exercises for citizens (C).
The actions in the plan concern civil protection by public authorities (Pa) and are managed by safety managers (M). There are various training courses on disaster management. One of these concerns the transport safety advisor, who is mandatory in the dangerous goods transport sector. However, emergency managers focus more on organisational aspects, the procedures to be implemented and the chain of command for managing an evacuation. Instead, the effects of a plan must be assessed both before and after implementation, and to this end, methods and models must be defined to assess the effects produced by the exercises [59]. In particular, in the past, several research projects have developed methods and models for simulating mobility in emergency conditions [19]. In more recent years, there has been a greater understanding that training and exercises are part of a broader cycle of emergency planning and management.
Table 7 summarises the reference literature developed by the authors, with all the literature cited therein, regarding methods and models for assessing risk reduction through training and exercises. The works cited emphasize the importance of training and emergency exercises, but above all, the need to adopt methods and models for simulating transport systems to assess in advance the travel choices of users in evacuation conditions using appropriate indicators.
To this end, it is necessary to have a structure in place to measure the reduction of exposure to disaster risk through training and exercises.
Table 7. Methods and models for risk reduction through training and exercises
|
References |
Main Topic |
Proposed Method |
Baseline Indicator |
Final Indicators |
Potential Beneficiaries |
|
[60] |
Evacuation plans comparison |
DEA |
•Up, Urban population •V, Vehicles to evacuate |
•te evacuation time |
M, Pa |
|
[58] |
Evaluation of Training measures |
HSEEP |
Exercise measures |
•te evacuation time •De = (D1+D2) total time |
C, M, Pa |
Note: C = citizen; M = manager; Pa = public authority.
The problem that arises, as mentioned above, is to define the organisational phases in two steps:
•Mitigation, with the preparation and model simulation of the plan in order to achieve optimal evacuation times
•Preparedness, with the preparation of the exercises and assessment of the effects produced by them in order to achieve the optimal evacuation times calculated in the plan.
As seen in Chapter 3, some of the guidelines analysed allow for the assessment of capabilities as well as capacities. However, there is no link between capacities/capabilities and final goals.
In order to overcome the limitations of the literature, it is necessary to develop a structure that allows for the definition of analytical functions that measure, using appropriate indicators, the level of exposure reduction based on acquired capacities and capabilities.
International guidelines emphasise the importance of pursuing SDGs with related indicators and targets to measure risk reduction, as seen above. However, while the analytical formulations of the plan indicators have been identified, there is a lack of analytical formulations that measure the effects of the training and exercises included in emergency planning. These actions include those related to community preparedness that improve awareness and knowledge of the behaviours to follow in an emergency.
The proposed structure requires the introduction of analytical formulations for the different indicators needed to measure risk reduction. For each indicator, it may be useful to refer to a target against which to make a quantitative comparison to determine whether the objective has been achieved or can be achieved.
4.2 Building a specific exercise
This section details the LFA components required to structure a specific exercise aimed at training managers who specialise in the management of evacuation procedures. Structuring the activity in accordance with LFA makes it possible to identify the main components and highlight the logical flow that links the activity’s objectives, the resources required to achieve them, and the effects it may produce in terms of capacity and capability.
The example referred to relates to a training activity aimed at training emergency managers who can apply the knowledge and skills required to manage an evacuation procedure using a transport network.
The individual components of the training activity are specified below in accordance with LFA.
Input.
The training program must ensure verifiable improvements in the knowledge and skills acquired by managers regarding TSM and TRA methods and models.
It is assumed that a public administration body intends to train at least 10 managers who can demonstrate that they have acquired the necessary knowledge and skills.
To this end, the organization is funding a training course aimed at a potential 20 participants (ninput); in funding the project and the delivery of the course, the organization requires that the following conditions be respected:
As regards the outputs:
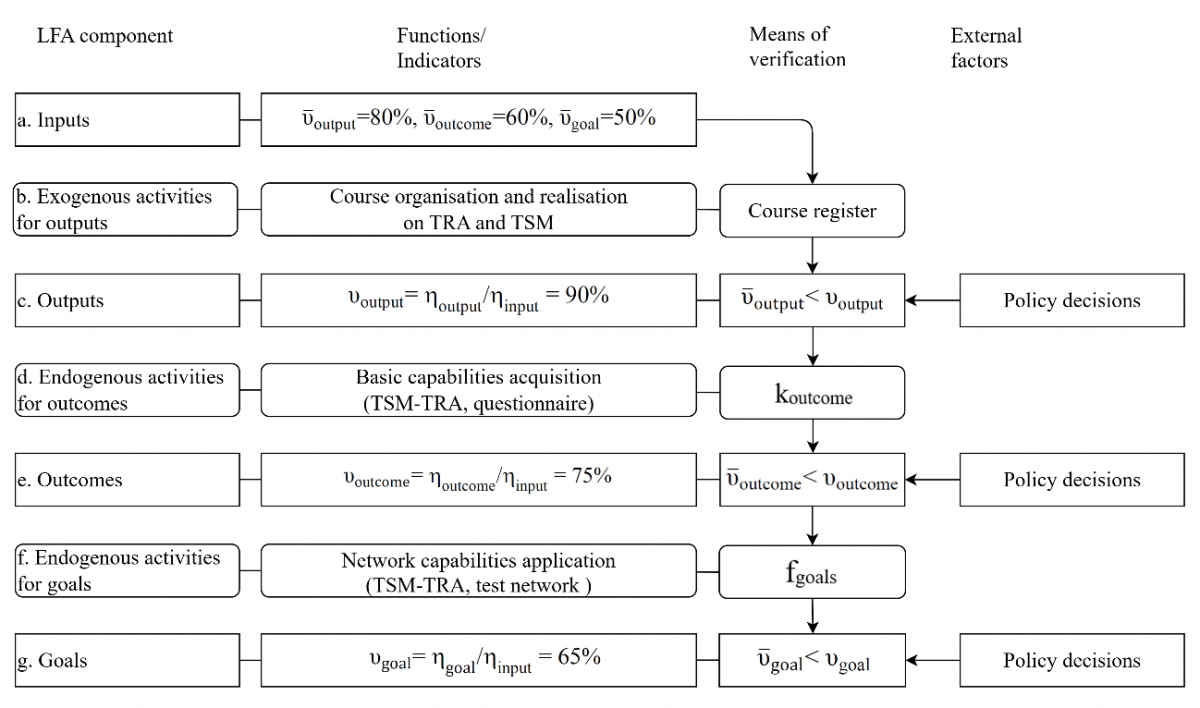
•A participation rate for the entire training programme ($\bar{\upsilon}_{\text {output}}$) of at least 80% of the total number of participants, expressed as:
$\bar{\upsilon}_{\text {output }}=80 \%$
As regards the outcomes:
• $\overline{\mathrm{k}}_{\text {outcome}}$: Minimum number of correct answers to acquire the capability.
•A success rate of 60% of participants in the basic interim tests on acquired knowledge and skills (TSM and TRA), expressed as:
$\bar{\upsilon}_{\text {outcomes}}=60 \%$
As regards the goals:
•f: Correct evacuation flows estimated by plan.
•A success rate of 50% in a final test on the application of the TSM, expressed as:
$\bar{\upsilon}_{\text {goals}}=50 \%$
Exogenous activities
Exogenous activities include discussion-based activities including the awarding of a certificate upon passing an exam.
The training activities are organised into modules which, in line with the objectives of the initiative, are designed to cover the following topics:
•TRA methods, with reference to the risk exposure component;
•TSM methods for estimating flows on a network under different supply and demand conditions.
Output.
Once the external activities have been completed, the main outcome is the participants’ capacity, which can generally be measured using a set of indicators. In the case of the test analysed, the number of participants who completed the planned sub-activities is quantified (noutput).
Output verification
The indicator $\upsilon_{\text {output}}$ is used to verify the outputs’ achievement; the values of $\upsilon_{\text {output}}$ must be greater than or equal to the threshold $\overline{\mathrm{\upsilon}}_{\text {output}}$ defined for the exogenous activities.
$\upsilon_{\text {output}}$ = noutput/ninput: Success rate of effectively trained managers.
The outputs’ achievement is verified if:
$\bar{\upsilon}_{\text {output }}<\upsilon_{\text {output }}$
It is assumed that 18 managers participated in the course, then:
$\upsilon_{\text {output}}$ = 18/20 = 90% > 80%
The output is verified.
Endogenous activities from outputs to outcomes.
Capacity is a necessary but not sufficient condition for achieving the expected outcomes of the activities. It is therefore essential to assess the current level of knowledge and skills acquired by participants after training and/or exercise activities. To this end, the participants must pass a test to measure their level of capability.
Capability reflects the actual level of learning of the concepts covered during the activity.
A multiple-choice questionnaire with closed-ended questions on the topics illustrated can be used [39, 61].
In the introduced example, the endogenous activities from outputs to outcomes are represented by a test consisting of a questionnaire composed of 20 multiple-choice questions to verify the acquisition of the capabilities by participants.
Participants must respond to a multiple-choice questionnaire to demonstrate their capability acquisition. The answers provided by each participant demonstrate their level of understanding of the course content.
Outcomes
Endogenous activities produce outcome indicators, which correspond to a predefined level of capability and a minimum number of correct answers to the questions.
Outcome verification
Outcome verification is performed by introducing a threshold value of correct answers to determine whether the outcome has been achieved:
Having the answers to the multiple-choice questionnaire, it is possible to calculate.
noutcome: Number of managers that acquired the capability, in relation to the threshold $\overline{\mathrm{k}}_{\text {outcome }}$.
It is possible to calculate an indicator to verify the level of achievement of the outcomes, which must be greater than or equal to $\bar{\upsilon}_{\text {outcome }}$.
$\upsilon_{\text {outcome}}=\mathrm{n}_{\text {outcome}} / \mathrm{n}_{\text {input}}$: Success rate of managers who have acquired the capability.
The outcomes’ achievement is verified if:
$\bar{\upsilon}_{\text {outcome}}<\upsilon_{\text {outcome}}$
It is assumed that 15 participants in the course passed the test, then:
noutcome = 15
$\upsilon_{\text {outcome}}=\mathrm{n}_{\text {outcome}} / \mathrm{n}_{\text {input}}$ = 15/20 = 75% > 60%
The outcome is verified.
Endogenous activities from outcomes to goals
The final level of LFA implies the knowledge of TSM and TRA for managing evacuation procedures. A test is useful to verify the knowledge level of each manager about TSM and TRA available in the literature and taught during the course.
Each manager must apply the TRA-TSM model to a test road network and must calculate the values of the performance indicators.
In the example, the 15 managers who have acquired the capability are asked to simulate the evacuation planning procedures for a city.
Figure 8 represents the road network used to conduct the test, with quantitative characteristics for each link. The objective of the test is to estimate the DRR by calculating evacuation times, or in other words, the total time taken by users to reach the safe areas (‘assembly points’).
The travel time over each road link is equal to the ratio of the distance to the speed.
Each origin zone is assigned to an 'assembly point', which is the destination of the evacuation trip.
Total evacuation times must be calculated for each pair of origins and destinations (o-d). The demand flow to evacuate for each o-d couple is known and constant. There are 2000 users, one for each car, in A and 1000 in B.
For each o-d pair, managers must select the evacuation route to be indicated to users to minimise travel times.
Two different routes are available for each pair.
The proposed approach is that of prescriptive assignment, in which managers must assess the user flows that will be present in the network as a result of their choices.
For each o-d pair, managers must choose the road route compatible with the available information regarding the network arcs. The available information is shown in the table in Figure 8.
Figure 8. Road network for test with quantitative characteristics
Goals
The exposure indicator measures the evacuation time produced by the managers’ decisions, with or without the knowledge of TSM – TRA methodologies.
For each o-d pair, it is assumed that managers select a single evacuation route for users to follow.
A lack of knowledge about TSM may lead to an underestimation of the capacity variable. Managers who lack this knowledge may underestimate capacity constraints, allocating the entire demand to the routes with the shortest travel times. Managers with this knowledge must assess the feasibility of the route to be selected, i.e., whether the demand for each route complies with the capacity constraint.
For the pair A–S1, if managers adopt the criterion of minimum travel time without taking the capacity constraint into account (unlimited capacity), they will select route I. However, when the capacity constraint on the 1–2 section is considered, the demand is not entirely compatible.
Therefore, up to 900 users can be assigned to Route I, whilst the remainder must be assigned to Route II.
For the origin-destination pair B–S1, the same capacity constraint issue arises on Route III (Table 8).
Table 8. Evacuation times in the three hypotheses
|
Origin-Assembly Point (o-d) |
|
Path |
|
|
Unlimited Capacity |
Limited Capacity |
|
Demand Flow (veh/h) |
Node Sequence |
Minimum Capacity Constraint (Link) |
Evacuation Time (h) |
Evacuation Time (h) |
||
|
A-S1 |
2000 |
I |
A-1-2-S1 |
300 (1-2)* |
0.075 |
- |
|
II |
A-1-3-2-S1 |
2200 (3-2) |
0.095 |
0.095 |
||
|
B-S2 |
1000 |
III |
B-4-5-S2 |
1500 (4-5) |
0.130 |
0.130 |
|
IV |
B-4-3-5-S2 |
800 (3-5)* |
0.140 |
- |
* Unfeasible path for the link capacity constraint
An understanding of TSM-TRA methods should guide managers in selecting evacuation routes on the road network.
Through the course content, managers should be able to apply the correct selection criteria.
This knowledge enables managers to undertake the final assessment, demonstrating that they have acquired the necessary skills and know how to apply them. The course therefore delivers a demonstrable benefit in the form of the ability to correctly select viable routes and the associated travel times.
Goal verification
The assessment of the objectives is carried out by considering one or more reference variables for TRA and TSM.
In this case, the variable is:
tgoals: Maximum time to evacuate a portion of a city.
Once the managers have completed their tasks, it is possible to calculate.
$\upsilon_{goal}$: Number of managers who calculated the correct time tgoals.
The goal’s achievement is verified if:
$\bar{\upsilon}_{\text {goal}}>\upsilon_{\text {goal}}$
In the example under consideration, it is assumed that 13 managers completed the exercise correctly. It is possible to calculate:
ngoal = 13
$\upsilon_{\text {goal}}=\mathrm{n}_{\text {goal}} / \mathrm{n}_{\text {outcome}}$ = 13/20 = 65% > 50%
The goal is verified.
A summary of the LFA components is shown in Figure 9.
Figure 9. Logical Framework Approach (LFA) for evaluating exercise results
DRR is a priority recognised by the international community. Work needs to be done in several areas to achieve the goals and targets set by the United Nations in Agenda 2030 and the Sendai Framework. One of the main challenges is to increase the preparedness of organisations and citizens to raise awareness of disaster risks and the behaviour to adopt in emergency situations or social knowledge.
In order to reduce risk exposure, preparedness for evacuation procedures must be improved, whilst at the same time clarifying what and how many potential benefits can be achieved. This implies the need to understand the phenomenon of mobility in emergencies in the mitigation phase. Although methods and models are available to support the planning of evacuation procedures in the mitigation phase, there is a gap in the guidelines for the structure and evaluation of training and exercises activities.
Emergency management organisations need guidance on how to assess exposure. In particular, the performance and potential effects of evacuation plans need to be assessed. Training and exercises make a significant contribution to increasing preparedness and reducing the existing gap in the implementation of plan procedures. For this reason, it is necessary to investigate the technical and scientific guidelines concerning training and exercises in the preparedness phase.
The methods for assessing and controlling the exposure component of risk are analysed based on two types of documents:
•Technical literature, including guidelines published by internationally recognised institutions promoting DRR objectives and strategies;
•Scientific literature, with reference to scientific papers studying exposure to disasters and actions to reduce their impact.
The synthetic literature review demonstrates the large adoption of a prescriptive approach and the limited guidelines for orienting a performance-based approach.
The available documents show a lack of analysis and assessment of the exposure component and, above all, of the effects produced by preparedness actions, with reference as performance-based approach. This paper focuses on training and exercise actions aimed at reducing the gap between emergency planning, developed in the mitigation phase, and the actual response to an event that occurs in reality in the response phase. Existing guidelines focus mainly on the tasks to be performed and the knowledge and skills to be acquired through exercises. Twigg [12] emphasized the importance of technical guidelines for organisations involved in DRR. There is a lack of methodologies for assessing the impact of risk reduction exercises activities.
One possible evaluation structure to adopt is the LFA, which allows the different components of a generic training and exercise action to be identified and classified. This is a performance-based approach to identify the causal chain that links:
•Outputs in terms of capacities of risk reduction;
•Outcomes in terms of increasing of capabilities;
•Goals in terms of obtained SDG targets.
In commonly adopted approaches, as shown in Table 6, inputs and outputs are mainly measured. This is in accordance with the effectiveness of these measures in relation to outcomes and goals with their respective targets, which is often overlooked.
While the presented case study is a “fictional simulation scenario”, it has main advantages:
1) It clarifies the LFA components and the possibility of measuring them; this supports the control of advancements and obtained results with respect to the invested resources;
2) It more clearly clarifies the transition from outputs (capacity) to outcomes (capability) and goals (risk reduction);
3) It demonstrates the feasibility of the proposed approach; the example can be useful to a potential reader to apply the proposed approach in other real contexts.
Although presented in simplified form, the example described can be extended and applied in other contexts.
There is therefore a need for guidance, especially with regard to appropriate indicators and assessment tools. The guidelines produced by international institutions often refer to output indicators, particularly quantitative ones, that often coincide with capacities. The guidelines set indicators and targets mainly related to the SDGs, but they do not clarify how to estimate measures and indicators of the potential impacts of plan actions and exercises in terms of outcomes and mainly to pursue goals. In most cases, they describe how to monitor exercises in terms of the number of personnel trained or hours of training provided. These indicators specify and quantify the measures adopted by a disaster preparedness project. They are therefore output indicators if the project is affected, and input indicators if it is planned. The most detailed guidelines for cities are those prepared by the United Nations [56].
Scientific literature offers some insights into exposure analysis and assessment, with reference to the analysis of transport systems in evacuation conditions [19, 62, 63]. It exists a low quantity of models for simulating mobility during evacuation and then for calculating indicators by plan; instead, the literature offers very limited insights into the potential contribution that emergency exercises can make to risk reduction, and the achievement plan’s targets.
In summary, the scientific literature shows a limited availability of quantitative indicators that measure the effects of preparedness in terms of DRR at the output and, mainly, outcome levels. Although simulation models for mobility during evacuation are available in scientific literature, applications that estimate the contribution of drills to risk reduction are limited. The results of the paper demonstrate the shortcomings of performance-based approaches in scientific literature and technical guidelines.
Most assessments of disaster preparedness focus on inputs and sometimes outputs rather than outcomes and goals. This problem is common in all cases in which a training or exercise action is taken, and the intention is to measure what effects will occur in the real world, with reference to the objectives set. Critical studies on impacts are lacking; the available case studies are based on preliminary results.
This work highlights the shortcomings of current guidelines, with various overlaps in definition and the lack of a general framework. The prescriptive approach is generally adopted. The work, following a performance-based approach, proposes a structure derived from LFA to classify the indicators available in the literature.
These crucial elements highlight the lack of studies that allow training and exercise activities to be analytically linked to the pursuit of the objectives identified in evacuation plans.
This gap is the element on which scientific research and technical structures can work.
In relation to the limitations mentioned above, this research may develop in different directions in the future. One possible direction is to analyse the experiences of national and local administrations in implementing training and exercise actions in a real context, verifying the results obtained against the plan targets. Further advances concern the in-depth study of advanced TSM methods and possible interactions with the potential offered by e-ICT technologies.
Conceptualization, F.R. and C.R.; validation, F.R.; investigation, C.R.; data curation, C.R.; writing—original draft preparation, F.R.; writing—review and editing, C.R.; visualization, C.R.; supervision, F.R.; funding acquisition, F.R. All authors have read and agreed to the published version of the manuscript.
This study was carried out within the research project “RISK: Recovery Increasing by Social Knowledge”-2022B4TT2M (CUP C53D23004800006), PIANO NAZIONALE DI RIPRESA E RESILIENZA (PNRR) Missione 4 “Istruzione e Ricerca”—Componente C2, Investimento 1.1 “Fondo per il Programma Nazionale di Ricerca e Progetti di Rilevante Interesse Nazionale (PRIN)”, D.D. n. 104 del 2 febbraio 2022, ERC SH7 “Human Mobility, Environment, and Space”. This paper reflects only the authors’ views and opinions, neither the European Union nor the European Commission nor the Italian Ministry for Universities and Research can be considered responsible for them.
[1] CRED. (2024). 2023 Disasters in number. https://reliefweb.int/report/world/2023-disasters-numbers.
[2] UNDRR. (2025). Global Assessment Report on Disaster Risk Reduction. https://www.undrr.org/gar/gar2025.
[3] United Nations. (2023). Sustainable Development Goals (SDG). https://sdgs.un.org/goals.
[4] UNDRR. (2022). Sendai framework targets and monitoring: Generating official statistics for disaster risk reduction. https://unfccc.int/sites/default/files/resource/UNDRR%20Presentation_Sendai%20Framework.pdf.
[5] Russo, F., Vitetta, A. (2006). Risk evaluation in a transportation system. International Journal of Sustainable Development and Planning, 1(2): 170-191. https://doi.org/10.2495/SDP-V1-N2-170-191
[6] Sun, L., Wang, Y.Q., Yang, Y.B., Xiong, Y.X. (2025). The volatility in shipping market: Relationship between container freight rates and inflation. Research in Transportation Economics, 114: 101674. https://doi.org/10.1016/j.retrec.2025.101674
[7] US FEMA. (2020). Homeland Security Exercise and Evaluation Program (HSEEP). https://preptoolkit.fema.gov/documents/1269813/1269861/HSEEP_Revision_Jan20_Final.pdf/65bc7843-1d10-47b7-bc0d-45118a4d21da?t=1580851559070.
[8] US FEMA. (2007). Homeland Security Exercise and Evaluation Program. Volume I: HSEEP overview and exercise program management. https://www.ojp.gov/pdffiles1/Archive/205244NCJRS.pdf.
[9] Sawadogo, J.B., Dunlop, K. (1997). Managing for results with a dynamic logical framework approach: From project design to impact measurement. Canadian Journal of Development Studies/Revue Canadienne d'études Du Développement, 18(sup1): 597-612. https://doi.org/10.1080/02255189.1997.9669720
[10] Breuer, E., Lee, L., De Silva, M., Lund, C. (2015). Using theory of change to design and evaluate public health interventions: A systematic review. Implementation Science, 11: 63. https://doi.org/10.1186/s13012-016-0422-6
[11] European Commission. (2004). Logical Framework Approach. https://international-partnerships.ec.europa.eu/document/download/f7ed20c4-5fc2-4ed7-b54c-0805e4ed952d_en?filename=methodology-aid-delivery-methods-project-cycle-management-200403_en.pdf, accessed on Aug. 8, 2026.
[12] Twigg, J. (2004). Disaster Risk Reduction: Mitigation and Preparedness in Development and Emergency Programming. Overseas Development Institute, London. https://www.preventionweb.net/publication/disaster-risk-reduction-mitigation-and-preparedness-development-and-emergency.
[13] United Nations. (2007). Hyogo framework for action 2005-2015: Building the resilience of nations and communities to disasters. https://www.unisdr.org/files/1037_hyogoframeworkforactionenglish.pdf.
[14] UN. (2008). Guidance and indicator package for implementing priority five of the Hyogo framework. Hyogo framework for action 2005-2015: Building the resilience of nations and communities to disasters. https://www.preventionweb.net/files/2909_Disasterpreparednessforeffectiveresponse.pdf?startDownload=true.
[15] Russo, F., Rindone, C. (2011). The planning process and logical framework approach in road evacuation: A coherent vision. WIT Transactions on the Built Environment, 117: 415-425. https://doi.org/10.2495/SAFE110361
[16] Russo, F., Rindone, C. (2013). Civil risk manager at European level. WIT Transactions on Ecology and the Environment, 173: 765-778. https://doi.org/10.2495/SDP130641
[17] Russo, F., Rindone, C. (2014). Risk occurrence measures for dangerous goods transport on a road network. WIT Transactions on the Built Environment, 134: 529-539. https://doi.org/10.2495/SAFE130471
[18] Sun, L., He, W., Lu, Y.S., Zhang, W.J., Ning, Z. (2025). Assessing the impact of European Union Emissions Trading System on crude oil, maritime transportation, and EU's carbon markets: A spillover analysis. Environment, Development and Sustainability. https://doi.org/10.1007/s10668-025-06259-4
[19] Chilà, G., Musolino, G., Polimeni, A., Rindone, C., Russo, F., Vitetta, A. (2016). Transport models and intelligent transportation system to support urban evacuation planning process. IET Intelligent Transport Systems, 10(4): 279-286. https://doi.org/10.1049/iet-its.2015.0127
[20] Russo, F., Comi, A., Rindone, C. (2025). The emerging ICT for exposure reduction in urban mobility: Transport models for risk cycle. In Communications in Computer and Information Science, pp. 173-187. Springer, Cham. https://doi.org/10.1007/978-3-031-84148-4_14
[21] Rindone, C., Russo, A. (2025). Disaster risk reduction in a Manhattan-type road network: A framework for serious game activities for evacuation. Sustainability, 17(14): 6326. https://doi.org/10.3390/su17146326
[22] Russo, F., Rindone, C. (2026). Reducing the occurrence of risk in the urban transport of dangerous goods to achieve the Sustainable Development Goals. Safety, 12(2): 43. https://doi.org/10.3390/safety12020043
[23] Cascetta, E. (2013). Transportation Systems Engineering: Theory and Methods. Springer New York, NY. https://doi.org/10.1007/978-1-4757-6873-2
[24] de Dios Ortúzar, J., Willumsen, L.G. (2024). Modelling Transport, Fifth Edition. Hoboken, NJ: Wiley. https://www.amazon.com/Modelling-Transport-Juan-Dios-Ort%C3%BAzar/dp/1119282357.
[25] Cantarella, G.E., Watling, D., de Luca, S., Di Pace, R. (2019). Dynamics and Stochasticity in Transportation Systems: Tools for Transportation Network Modelling. Elsevier. https://doi.org/10.1016/C2017-0-01089-3
[26] Cantarella, G.E., Fiori, C., Mussone, L. (2024). Dynamics and Stochasticity in Transportation Systems Part II: Equations and Examples. Elsevier. https://doi.org/10.1016/C2023-0-00085-1
[27] Rindone, C., Russo, A. (2025). Intermediate results for railway capacity evaluation: A network analysis for HSR services in Italy. Transportation Research Procedia, 90: 718-725. https://doi.org/10.1016/j.trpro.2025.06.087
[28] Vitetta, A. (2022). Network design problem for risk reduction in transport system: A models specification. International Journal of Transport Development and Integration, 6(3): 283-297. https://doi.org/10.2495/TDI-V6-N3-283-297
[29] Feng, K.R., Lin, N. (2022). Modeling and analyzing the traffic flow during evacuation in Hurricane Irma (2017). Transportation Research Part D: Transport and Environment, 110: 103412. https://doi.org/10.1016/j.trd.2022.103412
[30] Aldahlawi, R.Y., Akbari, V., Lawson, G. (2024). A systematic review of methodologies for human behaviour modeling and routing optimization in large-scale evacuation planning. International Journal of Disaster Risk Reduction, 110: 104638. https://doi.org/10.1016/j.ijdrr.2024.104638
[31] Russo, F., Comi, A., Chilà, G. (2024). Dynamic approach to update utility and choice by emerging technologies to reduce risk in urban road transportation systems. Future Transportation, 4(3): 1078-1099. https://doi.org/10.3390/futuretransp4030052
[32] Astarita, V., Guido, G., Haghshenas, S.S., Haghshenas, S.S. (2024). Risk reduction in transportation systems: The role of digital twins according to a bibliometric-based literature review. Sustainability, 16(8): 3212. https://doi.org/10.3390/su16083212
[33] Russo, F., Rindone, C. (2024). Methods for risk reduction: Training and exercises to pursue the planned evacuation. Sustainability, 16(4): 1474. https://doi.org/10.3390/su16041474
[34] Musolino, G. (2024). Methods for risk reduction: Modelling users' updating utilities in urban transport networks. Sustainability, 16(6): 2468. https://doi.org/10.3390/su16062468
[35] Astarita, V., Martino, G., Guido, G., Haghshenas, S.S., Shaffiee Haghshenas, S. (2025). Risk management in transportation systems: The use of Blockchain for risk reduction in disaster's occurrence. Procedia Computer Science, 257: 428-435. https://doi.org/10.1016/j.procs.2025.03.056
[36] Martino, G., Astarita, V., Guido, G., Haghshenas, S.S., Shaffiee Haghshenas, S. (2025). Risk management in transportation systems: How big data can help predict behaviors and events. Procedia Computer Science, 257: 39-46. https://doi.org/10.1016/j.procs.2025.03.008
[37] Russo, F., Rindone, C. (2024). Planned and implemented actions by exercises. In Lecture Notes in Computer Science, pp. 28-40. Springer, Cham. https://doi.org/10.1007/978-3-031-65308-7_3
[38] Jafarzadeh Ghoushchi, S., Shaffiee Haghshenas, S., Vahabzadeh, S., Shaffiee Haghshenas, S., Astarita, V., Guido, G. (2025). Risk assessment of young driver behavior using an extended decision-making approach based on FMEA in uncertain environments. Neural Computing and Applications, 37: 9565-9602. https://doi.org/10.1007/s00521-025-11087-8
[39] Russo, F., Musolino, G., Moschella, M. (2025). Risk reduction in urban areas by means of evacuation: Survey design on use of emerging information and communication technologies. In Lecture Notes in Computer Science, pp. 113-127. Springer, Cham. https://doi.org/10.1007/978-3-031-97638-4_8
[40] Rindone, C., Moschella, M. (2024). Experimentation on risk reduction by training: A framework for seminar activity. In Lecture Notes in Computer Science, pp. 129-143. Springer, Cham. https://doi.org/10.1007/978-3-031-65308-7_10
[41] UNDP. (2013). Disaster Risk Management. https://www.undp.org/tag/disaster-risk-management, accessed on Aug. 20, 2026.
[42] European Commission. (2021). European disaster resilience goals. European Civil Protection and Humanitarian Aid Operations. https://civil-protection-humanitarian-aid.ec.europa.eu/what/civil-protection/european-disaster-risk-management/european-disaster-resilience-goals_en.
[43] UNDRR. (2023). The report of the midterm review of the implementation of the Sendai framework for disaster risk reduction 2015-2030. https://www.undrr.org/publication/report-midterm-review-implementation-sendai-framework-disaster-risk-reduction-2015-2030.
[44] UNESCO. (2021). Multi-annual community tsunami exercise programme: Guidelines for the tsunami and other coastal hazards warning system for the Caribbean and Adjacent Regions. UNESCO Digital Library. https://unesdoc.unesco.org/ark:/48223/pf0000380540.
[45] New Zealand Government. (2015). The guide to the national civil defence emergency management plan 2015. https://www.civildefence.govt.nz/assets/Uploads/documents/publications/guide-to-the-national-cdem-plan/Guide-to-the-National-CDEM-Plan-2015.pdf.
[46] Italian Government. (2018). Legislative Decree No. 1 of January 2, 2018: Civil protection code. https://www.protezionecivile.gov.it/en/normativa/legislative-decree-no--1-of-january-2--2018--civil-protection-code/.
[47] UNDRR. (2022). Sendai framework for disaster risk reduction 2015 – 2030. https://www.undrr.org/media/16176/download?startDownload=20251106.
[48] UNESCO. (2022). Standard guidelines for the tsunami ready recognition programme. Tsunami Day. https://tsunamiday.undrr.org/publication/standard-guidelines-tsunami-ready-recognition-programme.
[49] MSB. (2011). Evaluation of Exercises: Handbook. https://www.mcf.se/siteassets/dokument/publikationer/english-publications/evaluation-of-exercises.pdf.
[50] MSB. (2016). Exercise Guidance Method Booklet – Exercise. https://www.mcf.se/siteassets/dokument/publikationer/english-publications/exercise-guidance-method-booklet--exercise-evaluation.pdf.
[51] ISO. (2013). Societal security — Guidelines for exercises. ISO 22398. https://cdn.standards.iteh.ai/samples/50294/873f6bf46b274316949986e0992bc5c0/ISO-22398-2013.pdf.
[52] WHO. (2019). Simulation exercises. https://www.who.int/emergencies/operations/simulation-exercises.
[53] Doyle, E.E.H., Lambie, E., Orchiston, C., et al. (2020). Citizen science as a catalyst for community resilience building: A two-phase tsunami case study. Australasian Journal of Disaster and Trauma Studies, 24(1): 23-49. https://resiliencechallenge.nz/outputs/citizen-science-as-a-catalyst-for-community-resilience-building-two-tsunami-case-studies/.
[54] UNDRR. Enhancing disaster preparedness for effective response. Words into Actions. https://www.undrr.org/media/43008/download?startDownload=true, accessed on Dec. 06, 2023.
[55] Australian Government (2023). Managing exercises. https://knowledge.aidr.org.au/media/10506/handbook_managing_exercises_web_2023.pdf.
[56] UNDRR. (2017). Disaster resilience scorecard for cities. https://mcr2030.undrr.org/disaster-resilience-scorecard-cities.
[57] European Commission. (2026). Technical guide for UCPM full-scale exercises. https://ec.europa.eu/info/funding-tenders/opportunities/docs/2021-2027/ucpm/guidance/technical-guide-full-scale-exercises_ucpm_en.pdf.
[58] Russo, F., Rindone, C., Trecozzi, M.R. (2012). The role of training in evacuation. WIT Transactions on Information and Communication Technologies, 44: 491-502. https://doi.org/10.2495/RISK120411
[59] Russo, F., Rindone, C. (2014). Urban exposure: Training activities and risk reduction. WIT Transactions on Ecology and the Environment, 191: 991-1001. https://doi.org/10.2495/SC140842
[60] Russo, F., Rindone, C. (2012). Data envelopment analysis for planning emergency. WIT Transactions on Ecology and the Environment, 155: 1091-1101. https://doi.org/10.2495/SC120912
[61] Rindone, C., Sgro, D., Vitetta, A. (2025). Risk reduction by evacuation in transportation system: Pilot survey with technology acceptance model. In Lecture Notes in Computer Science, pp. 128-139. Springer, Cham. https://doi.org/10.1007/978-3-031-97638-4_9
[62] Murray-Tuite, P., Wolshon, B. (2013). Evacuation transportation modeling: An overview of research, development, and practice. Transportation Research Part C: Emerging Technologies, 27: 25-45. https://doi.org/10.1016/j.trc.2012.11.005
[63] Alam, M.J., Habib, M.A. (2024). A mass evacuation modeling framework to account for vulnerabilities in staged evacuation. Transportation Research Part A: Policy and Practice, 190: 104245. https://doi.org/10.1016/j.tra.2024.104245