Jakfat Haekal* | Rizaldi Mu’min | Arief Suwandi | Paduloh | Muhammad Kholil | Muhammad Isa Lufti | Ibrahim Masood | Reazul Haq Abdul Haq
© 2026 The authors. This article is published by IIETA and is licensed under the CC BY 4.0 license (http://creativecommons.org/licenses/by/4.0/).
OPEN ACCESS
Supply chain sustainability relies on the effective interpretation of operational, environmental, logistics, energy, and cost indicators that jointly shape resource efficiency, emissions performance, and managerial decision-making. Traditional sustainability monitoring is often fragmented, descriptive, and dependent on periodic manual review, whereas many predictive analytics studies focus only on estimation accuracy and fail to link prediction outputs to operational execution. This study addresses this analytics-to-action gap. In the Collect phase, multi-source green supply chain records are acquired from raw material usage, energy consumption, manufacturing energy, renewable energy share, waste generation, transport distance, CO₂ emissions, carbon footprint, cost, and delivery time. In the Organize phase, heterogeneous records are consolidated, harmonized, validated, and structured into an analysis-ready dataset consisting of 1,029 observations across electronics, pharmaceutical, food, apparel, and automotive product categories. In the Analyze phase, Univariate Regression, RReliefF, correlation analysis, and Random Forest (RF) regression are applied to predict Sustainability Score from structured supply chain indicators. Renewable energy share, CO₂ emissions, and waste generation emerge as the most influential predictors, and the RF model achieves stable predictive performance under 10-fold cross-validation, with mean squared error (MSE) = 22.439 ± 0.948, root mean squared error (RMSE) = 4.737 ± 0.178, mean absolute error (MAE) = 3.711 ± 0.125, mean absolute percentage error (MAPE) = 8.588% ± 0.365%, and coefficient of determination (R²) = 0.889 ± 0.007. In the Infuse phase, the predicted Sustainability Score is embedded into an energy management system (EMS) to support dashboard visualization, risk-level indicators, automated alerts, recommendation panels, reporting, and audit logs. The AI Ladder-guided machine learning (ML)–EMS pipeline demonstrates a practical pathway from fragmented supply chain evidence to actionable sustainability management, aligning with Sustainable Development Goals (SDGs) 7, 9, 12, and 13. By directly embedding Sustainability Score prediction into EMS workflows, managers can transition from periodic, descriptive monitoring to continuous, predictive, energy-aware, and sustainability-oriented supply chain decision-making.
AI Ladder, machine learning, Energy Management System, Random Forest regression, Sustainability Score, green supply chain, predictive sustainability
Managers seeking to evaluate sustainability performance in supply chains rarely confront a single operational issue in isolation. Instead, they must interpret simultaneous variation in raw material usage, energy consumption, manufacturing energy, renewable energy share, waste generation, transport distance, carbon footprint, CO2 emissions, delivery time, and cost, all of which influence how environmentally and operationally efficient a supply chain is [1, 2]. These indicators do not operate independently. A general structure of sustainable supply chains founded by Becerra et al. [3], likewise treats location, inventory, and transportation decisions as interdependent sources of cost, distance, fuel use, emissions, and service outcomes rather than as separable managerial issues. A reduction in delivery time may require longer transport routes or higher energy use, lower costs may coexist with higher emissions, higher waste, or weaker energy performance, and improved output efficiency may still be accompanied by elevated waste or carbon intensity. In this sense, supply chain sustainability is not simply a matter of monitoring one environmental metric, but of understanding how multiple operational and environmental signals interact in ways that create trade-offs for managers. The practical problem, therefore, is not a lack of data, but the difficulty of converting structured operational evidence into a coherent basis for sustainability-oriented judgment and intervention [4, 5]. This study also aligns with several SDGs, particularly SDG 7 (Affordable and Clean Energy), SDG 9 (Industry, Innovation and Infrastructure), SDG 12 (Responsible Consumption and Production), and SDG 13 (Climate Action), because it integrates energy-aware management, predictive analytics, and sustainable supply chain evaluation into a single decision-support framework for greener operational planning and intervention [1, 6, 7].
These variables matter because they capture the underlying conditions through which supply chains consume resources, generate environmental burdens, and reveal process efficiency. In the context of this study, energy consumption and manufacturing energy reflect the intensity of production and logistics operations, while renewable energy share indicates the extent to which those operations are aligned with cleaner energy sourcing. Waste generation, carbon footprint, and CO2 emissions make visible the environmental consequences of operational design, whereas raw material usage, transport distance, delivery time, and cost reflect the resource, logistics, and managerial constraints under which sustainability performance must be achieved.
When interpreted jointly, these indicators provide a more realistic picture of supply chain sustainability than any single measure can offer, because they reveal not only environmental outcomes but also the operational structure from which those outcomes emerge [8, 9]. For that reason, Sustainability Score is useful as a managerial proxy: it synthesizes multiple signals into one interpretable indicator that can support comparison, prioritization, and decision-making across supply chain activities [10, 11].
Sustainability Score is useful precisely because it can function as such a construct. Rather than standing as a substitute for detailed operational data, it serves as a managerial proxy that condenses multiple resource, logistics, and environmental signals into one interpretable indicator of sustainability performance. Rohde et al. [10] argue that sustainability-oriented assessment becomes more actionable when complex conditions are translated into criteria that support comparison and judgment, while Toderas [11] emphasizes that AI-enabled sustainability analysis is most valuable when it helps organizations connect multidimensional evidence to concrete decisions. In the present context, Sustainability Score is not simply a reporting output; it is a synthesized decision-support device that links raw supply chain data to managerial interpretation. It allows organizations to move from scattered observations of energy use, emissions, cost, and material efficiency toward a more integrated understanding of whether current operational conditions are broadly aligned with sustainability objectives. As a result, the score can help bridge the gap between descriptive measurement and practical intervention across supply chain activities. That bridge becomes more important when organizations require not only retrospective interpretation but anticipatory insight. Descriptive indicators can reveal whether waste is high, renewable energy use is low, or transport distance is excessive, but they do not by themselves show how the observed combination of variables is likely to translate into overall sustainability performance. Prediction addresses this limitation by estimating probable sustainability conditions from structured operational evidence before all consequences fully materialize in supply chain outcomes. According to the study [9], structured operational indicators can reveal sustainability-relevant patterns when analyzed through predictive approaches, especially in contexts where energy efficiency and process performance are interdependent. Prediction therefore improves interpretability by clarifying how variables work together, strengthens prioritization by highlighting influential conditions, and supports earlier intervention in cases where managerial adjustments may still be feasible. In this study, AI is introduced only in that instrumental sense: as a predictive modelling method, an analytical engine for detecting patterns among structured variables, and a mechanism for supporting managerial interpretation. It is not treated as an explanatory driver of Sustainability Score, but as the means through which the score can be estimated from the supply chain conditions already present in the dataset [2].
The usefulness of that predictive output depends on where it is applied. If Sustainability Score remains an isolated analytical result, its function is largely interpretive. If it is embedded in an energy management system (EMS), however, it becomes part of a broader decision-support environment through which organizations can coordinate energy-related and sustainability-oriented action. EMS, as Javed et al. [6] suggested, can be understood not merely as a platform for monitoring energy use but as a governance architecture capable of informing adjustment, prioritization, and control. This interpretation is especially relevant when sustainability performance is tightly connected to variables such as energy consumption, renewable energy share, manufacturing energy, and carbon intensity. In such a setting, predicted Sustainability Score can help translate observed operational conditions into signals for intervention, enabling managers to identify where energy-aware adjustment, process redesign, or sustainability-oriented prioritization may be needed. Jasiunas et al. [12] likewise showed that resilient energy management requires integrative decision structures rather than narrow reporting mechanisms. The present study extends that idea by treating EMS as the managerial destination of the predictive output rather than as a parallel monitoring tool detached from sustainability scoring.
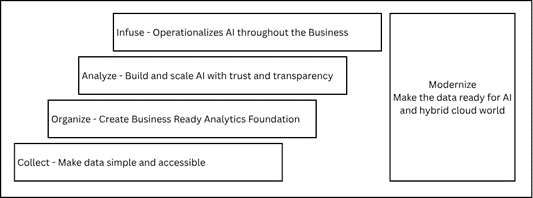
This article uses AI Ladder as its implementation logic, as shown in Figure 1. In this study, the ladder consists of four connected stages: collect, organize, analyze, and infuse [13, 14]. The collect stage refers to gathering structured supply chain and environmental indicators such as raw material usage, energy consumption, emissions, waste, cost, and logistics measures. The organize stage concerns preparing these variables so that they are analytically coherent and decision-relevant rather than fragmented observations. The analyze stage involves applying predictive modelling to estimate Sustainability Score from the observed structure of operational and environmental conditions. The infuse stage then embeds the prediction output into EMS-based managerial processes so that the score informs operational prioritization, energy-related adjustment, and sustainability-oriented decision-making.
In Analyze phase, RF regression model is particularly suitable in this study because supply chain sustainability indicators interact in nonlinear and complex ways that cannot be adequately captured by conventional linear models. By combining multiple decision trees, RF can model these interactions while maintaining robustness and predictive accuracy on structured tabular data [15, 16]. In addition, its ability to reveal variable importance enhances interpretability, making it especially valuable for managerial decision support in sustainability contexts. AI Ladder is not the theoretical driver of sustainability performance; it is the integration pathway that connects structured data, predictive analysis, and practical use inside EMS.
Figure 1. The Framework of AI Ladder
Despite substantial work on sustainable supply chains, predictive analytics, and energy management, these domains are still frequently addressed in parallel rather than as one coherent framework. Prior studies have often stopped at analytics rather than integration into managerial systems [4, 7]. Some contributions focus on digitalization and operational efficiency, others on sustainability scoring or Environmental, Social, and Governance (ESG) related interpretation, and others on energy management as a separate organizational capability. Yet the literature offers relatively limited treatment of a framework that explicitly combines structured supply chain variables, Sustainability Score prediction, and EMS deployment through AI Ladder logic. This omission is nontrivial because the value of prediction depends not only on whether a score can be estimated, but also on whether that score can be operationalized in a governance setting where managers make energy-sensitive supply chain decisions. The research gap addressed here therefore lies in the absence of an integrated design that connects observable supply chain conditions, predictive sustainability scoring, and EMS-based managerial application within one decision-support structure [6, 9].
The novelty of this study lies in addressing that integration problem directly. Conceptually, it links supply chain variables, sustainability scoring, EMS, and AI Ladder within one framework instead of treating them as separate analytical concerns. Methodologically, it uses structured operational, environmental, and energy-related variables to predict Sustainability Score rather than relying on a single sustainability metric or a purely descriptive assessment. At the system-design level, it embeds prediction outputs into EMS so that the result of modeling becomes part of a decision-support architecture rather than an isolated analytical product. Practically, it turns predicted Sustainability Score into actionable support for energy-aware and sustainability-oriented supply chain decisions. The contribution of the article is therefore not that AI changes sustainability by itself, but that predictive modeling is used to operationalize sustainability intelligence inside an EMS context. This distinction is important because it grounds the study in the variables that actually describe supply chain conditions while preserving AI’s role as an enabling tool rather than a theoretical determinant [7, 11].
This study is guided by three closely connected questions. It first seeks to determine the extent to which structured supply chain indicators can predict Sustainability Score from the observed configuration of operational, environmental, and energy-related variables. It then examines which of those variables most strongly shape the predicted score, with particular attention to the relative importance of energy intensity, emissions, waste, logistics conditions, and material usage. Finally, it explores how the predicted Sustainability Score can be embedded in an AI Ladder-based EMS so that the output of prediction becomes actionable support for greener and more coherent supply chain decision-making. Meanwhile the aim of this article is to develop a predictive framework for estimating Sustainability Score from structured supply chain indicators and to examine how that output can be embedded in an AI Ladder-based EMS. The article contributes in three ways. Theoretically, it connects supply chain sustainability measurement with EMS-oriented decision support by showing how a synthesized score can serve as an interface between operational variables and managerial action. Methodologically, it builds a predictive framework from structured supply chain indicators that reflect resource intensity, environmental burden, logistics performance, and operational trade-offs. Practically, it helps firms use the predicted Sustainability Score to support more informed decisions related to prioritization, energy adjustment, and sustainability-oriented intervention.
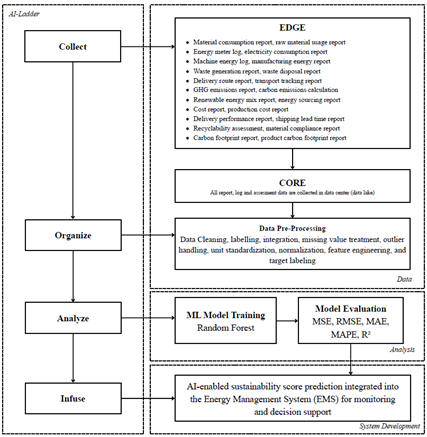
The proposed framework adopts IBM’s AI Ladder methodology as the organizing logic for constructing an end-to-end pipeline that predicts Sustainability Scores from multi-source supply chain data and positions the resulting analytics within a deployable energy management context [6, 7]. As shown in Figure 2, the framework is structured around four sequential yet interdependent stages (collect, organize, analyze, and infuse) which together connect fragmented operational evidence to decision-oriented sustainability assessment [4, 11]. This staged design is appropriate for the present study because supply chain sustainability depends on the joint interpretation of environmental, operational, logistics, and energy-related indicators rather than on a single isolated measure [1, 8].
The framework is structured to convert fragmented supply chain evidence into deployable sustainability intelligence: in the Collect stage, edge-level data are gathered from material usage, energy consumption, manufacturing energy, waste, transport, emissions, cost, and delivery, because supply chain sustainability depends on the interaction of operational, environmental, and logistics variables rather than on a single metric [1, 8]. In the Organize stage, these heterogeneous inputs are consolidated in the core layer and pre-processed so that fragmented reports become analytically coherent and decision-ready, consistent with the role of AI Ladder in connecting raw evidence to usable assessment [4, 11]. In the Analyze stage, predictive modeling is applied to estimate the Sustainability Score from the observed configuration of energy, emissions, waste, logistics, and material variables, since prediction helps reveal how these indicators jointly shape sustainability performance and supports more objective prioritization [9]. In the Infuse stage, the predicted score is embedded into the EMS so that the output functions as operational decision support rather than as an isolated analytical result, which aligns with the view that EMS should serve as a governance architecture for adjustment, prioritization, and energy-aware intervention [6, 12]. This is why the framework is meaningful: AI Ladder is not treated as the driver of sustainability itself, but as the integration pathway that connects structured data, predictive analysis, and practical use inside EMS [7, 17].
Figure 2. AI Ladder-based energy management system (EMS) framework for Sustainability Score prediction
2.1 Phase 1: Collect
The Collect phase constitutes the first operational rung of the IBM AI Ladder and is defined in this study as the systematic acquisition of structured, traceable, and decision-relevant supply chain records from distributed edge-level sources before central consolidation [4]. Such a design is methodologically necessary because the Sustainability Score targeted in this study is not determined by a single environmental indicator, but by the interaction of material, energy, emissions, logistics, cost conditions that emerge across different operational sites and reporting boundaries [1, 8]. Thus, the Collect stage is framed as the deliberate construction of an auditable evidence base capable of preserving operational granularity while making heterogeneous records sufficiently accessible for downstream integration in an EMS-oriented architecture [6, 14, 18].
2.1.1 Multi-source supply chain data acquisition model
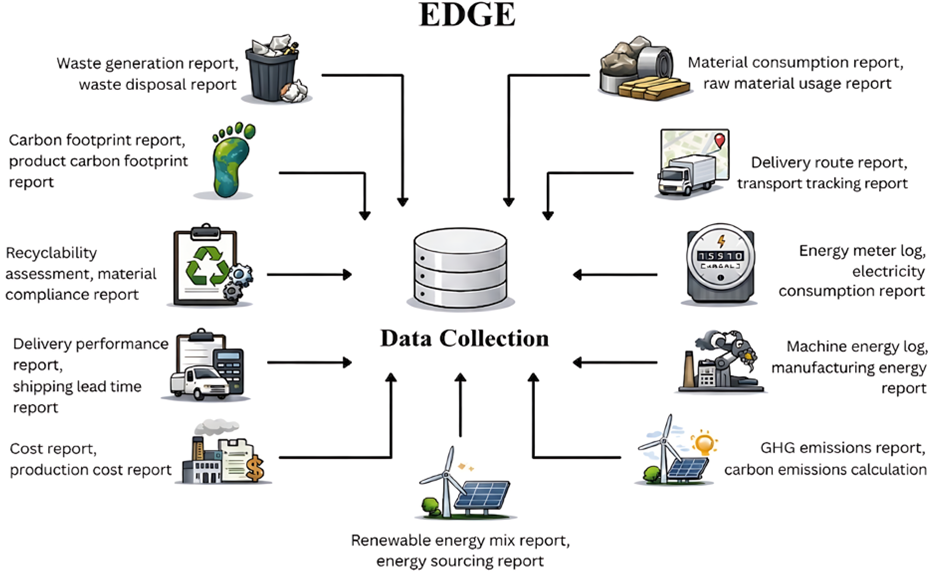
The proposed acquisition model, illustrated in Figure 3, collects raw material usage and material consumption from material consumption reports and raw material usage reports because materials data are necessary to represent the physical input structure from which waste intensity and resource efficiency can be assessed [1, 19]. Energy consumption, electricity consumption, machine-level energy, and manufacturing energy are acquired from energy meter logs, electricity consumption reports, machine energy logs, and production records because energy-related variables are central to both EMS logic and the environmental interpretation of production performance [20]. Renewable energy share is collected from renewable energy records and utility-related documentation because the study requires not only total energy use, but also the extent to which operational energy demand is met through cleaner energy sources that alter the sustainability meaning of otherwise similar production profiles [6, 20]. Waste generation is captured from waste management reports because contemporary reporting standards explicitly link waste-related practices to materials use and value-chain impacts, making waste a necessary operational rather than merely descriptive variable in sustainability assessment [8, 21]. Carbon footprint and CO2 emissions are obtained from carbon accounting records and emissions reports because corporate sustainability measurement requires activity data that can support organization-level and value-chain Greenhouse Gases (GHG) inventories in a standardized and comparable manner [22, 23].
Figure 3. Edge-level data acquisition model
Transport distance, logistics activity, delivery time, and cost are collected from transport records, shipment logs, delivery performance records, and cost records because upstream and intra-chain sustainability conditions are materially shaped by freight distance, transport mode, delivery performance, and service expenditure rather than by production data alone [4, 24].
2.1.2 Edge-level data capture and source coverage
Data are captured as close as possible to their point of origin at the edge level, including production units, metering points, warehouses, transport interfaces, emissions-accounting points, waste handling functions, and supplier-facing reporting channels, because proximity to the source preserves operational specificity and reduces the loss of contextual information that often occurs when sustainability data are reconstructed only after aggregation [18]. This edge-level orientation is particularly important for logistics and transport variables, transport-related emissions assessment depends on shipment-level information such as distance, mode, fuel, mass, storage conditions, and provider activity rather than on generalized annual summaries alone [22]. For that reason, the study treats source heterogeneity, because the Sustainability Score is intended to reflect interactions among purchasing, production, energy use, transport, emissions, and waste generation, all of which are recorded in different operational systems and organizational documents [1, 8].
2.1.3 Data transmission and consolidation to the core layer
After acquisition, as depicted in Figure 4, the collected and aggregated records are transmitted from distributed edge sources to a centralized core data environment through digital extraction and synchronized reporting interfaces, because the methodological purpose of the Collect stage is not only to gather records, but also to make them uniformly accessible across source boundaries in accordance with the AI Ladder logic [18].
Figure 4. AI Ladder-based supply chain data acquisition model
This transmission step is necessary because raw supply chain evidence is ordinarily fragmented across operational reports, metering logs, transport documents, environmental inventories, and supplier disclosures, and therefore cannot support coherent sustainability scoring unless it is first assembled into a common evidence base with preserved provenance [4]. The design also aligns with EMS principles, since energy-related decision support depends on the regular availability of measured consumption data and associated operational context rather than on isolated or ad hoc reporting snapshots [6]. By treating collection, access, and traceable transfer as one integrated methodological activity, the study ensures that the raw records entering the analytical pipeline remain closely tied to the operational conditions from which they were generated [19-21, 23]. These collected multi-source records are then consolidated into the core data environment, specifically a data lake, for the subsequent Organize stage [4].
2.1.4 Dataset source, scope, and reproducibility
The dataset used in this study was derived from real enterprise records related to green supply chain operations. The dataset was structured to represent product-level supply chain observations across five product categories, namely electronics, pharmaceutical, food, apparel, and automotive. Each observation represents one supply chain record containing operational, environmental, logistics, energy, cost, and LCA-derived sustainability information.
The dataset consists of 1,029 product-level supply chain observations across five product categories, namely electronics, pharmaceutical, food, apparel, and automotive. Each observation represents one supply chain record containing operational, environmental, logistics, energy, cost, and LCA-derived sustainability information. The records were collected from enterprise operations located in the Greater Jakarta metropolitan area (Jabodetabek), including Jakarta, Bogor, Depok, Tangerang, and Bekasi, Indonesia. Since the dataset was constructed from real enterprise records, the terms “reports” and “logs” in this study refer to actual enterprise documentation and system-generated records rather than conceptual or simulated source categories.
To support reproducibility while maintaining confidentiality, the study provides the variable dictionary, data structure, target-variable definition, LCA-based Sustainability_Score scoring logic, data preprocessing procedure, Random Forest (RF) configuration, fixed random seed, 10-fold cross-validation scheme, and evaluation metrics reported as mean ± standard deviation. Although the raw enterprise records cannot be fully disclosed due to confidentiality restrictions, the analytical pipeline can be reproduced using the same variable structure, scoring procedure, preprocessing steps, and modelling configuration.
2.2 Phase 2: Organize
The Organize phase constitutes the second stage of the IBM AI Ladder and, in the context of this study, refers to the consolidation, harmonization, validation, and structuring of the records acquired during the Collect phase so that they become analytically coherent and decision-ready within a centralized core environment [18]. In methodological terms, this stage is necessary because the Sustainability Score investigated in this study is inferred from the interaction of material, energy, emissions, logistics, and cost variables. The Organize stage is therefore designed as a governed transformation process through which distributed reports and logs are converted into a traceable, interoperable, and analysis-ready dataset [25].
2.2.1 Data consolidation and schema harmonization
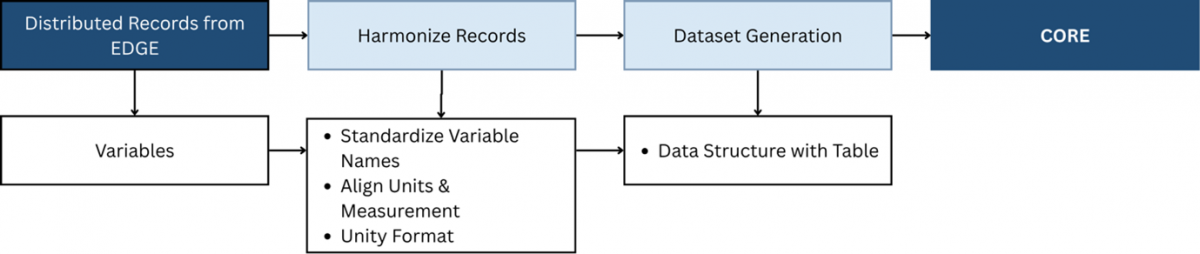
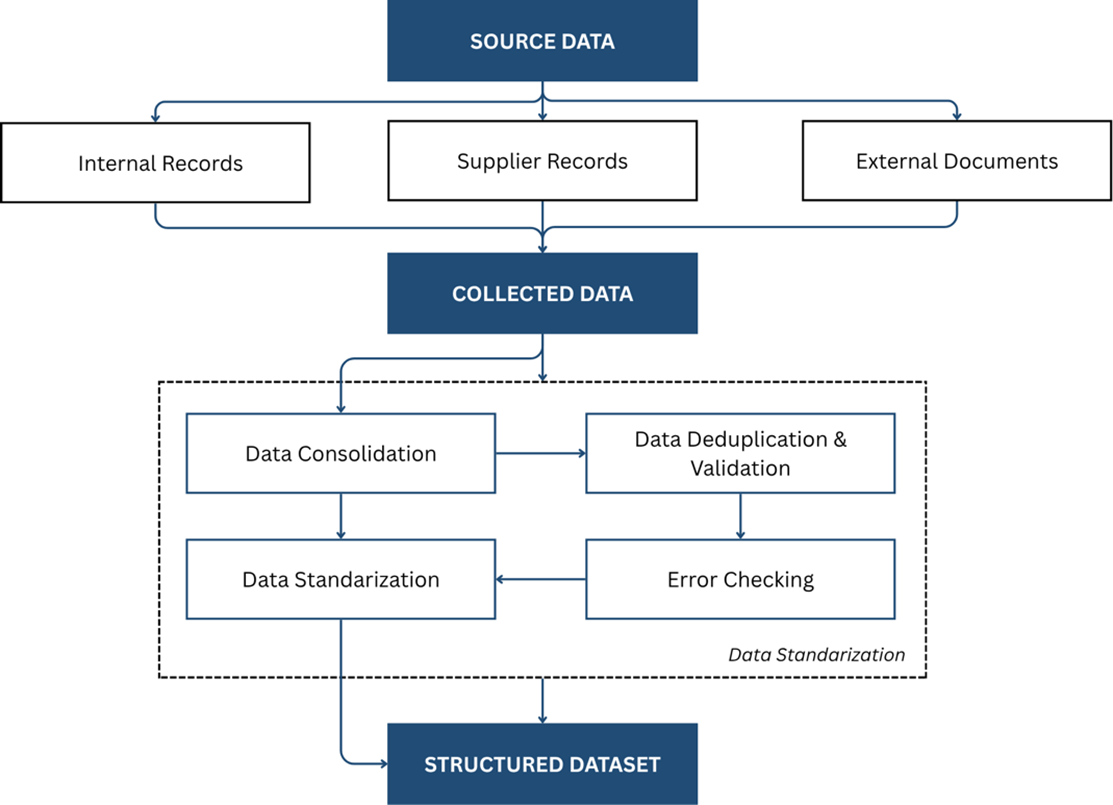
The first organizing activity, shown in Figure 5, is the consolidation of distributed edge-level records into the core layer, where material consumption reports, raw material usage reports, energy meter logs, electricity records, machine energy logs, production records, renewable energy records, waste reports, emissions inventories, transport documents, delivery records, cost records, and supplier disclosures are brought into a unified tabular environment with consistent schema definitions.
Figure 5. Data transmission and consolidation to the core layer
This step is methodologically necessary because heterogeneous operational sources frequently encode similar phenomena under different field names, units, reporting intervals, and reference identifiers, which would otherwise distort downstream interpretation by making semantically related variables appear incomparable or duplicative [25]. Accordingly, the Organize stage harmonizes variable naming conventions across sources, aligns equivalent fields under common attribute labels, and standardizes units of measurement so that variables are represented in a common analytical vocabulary rather than in source-specific formats [21].
Timestamp fields and reporting-period boundaries are likewise aligned to a common temporal structure because a predictive framework cannot infer valid relationships among operational and environmental variables if those variables refer to inconsistent observation windows across facilities, processes, or shipments [24]. The same logic applies to identifiers: company, facility, process, product, batch, and shipment references are normalized so that records from internal operations and external supplier disclosures can be joined without weakening provenance or creating ambiguous links between operational events and sustainability attributes.
2.2.2 Operational definition of Sustainability Score
In this study, Sustainability_Score is defined as a continuous target variable representing the overall sustainability performance of each supply chain record. The score was derived from a Life Cycle Assessment (LCA)-based evaluation of each record and was prepared prior to the machine learning (ML) modelling stage. Therefore, Sustainability_Score served as the dependent variable to be predicted from structured supply chain indicators.
The LCA-based scoring procedure followed the general principles of ISO 14040 [26] and ISO 14044 [27], which frame LCA through goal and scope definition, life cycle inventory analysis, life cycle impact assessment, and interpretation. The scoring process used the available life cycle inventory and sustainability-related records. These indicators were transformed into normalized impact values and then aggregated into a 0-100 sustainability scale. Lower environmental burden indicators were reverse-coded so that lower impact contributed to a higher Sustainability Score, while beneficial indicators such as renewable energy share contributed positively.
The theoretical scale ranges from 0 to 100, where higher values indicate stronger sustainability performance and lower values indicate weaker sustainability performance. In the organized dataset used in this study, the observed Sustainability_Score ranged from 12.80 to 91.53. Scores between 80 and 100 indicate very strong sustainability performance, 60-79 indicate good sustainability performance, 40-59 indicate moderate sustainability performance requiring managerial review, 20-39 indicate weak sustainability performance, and scores below 20 indicate critical sustainability performance requiring urgent intervention.
The scoring was conducted as a structured LCA-based assessment by the research team before predictive modelling. To improve consistency, the same scoring rule, normalization procedure, and weighting logic were applied to all 1,029 observations. The reliability of the scoring process was checked through source-record verification, range plausibility checks, missing-value inspection, duplicate-record screening, consistency checks between LCA indicators and source variables, and sensitivity testing of the scoring weights. These procedures were intended to ensure that Sustainability_Score represented a consistent and auditable sustainability assessment rather than an arbitrary or manually assigned label.
2.2.3 Data quality assurance with preliminary exploratory
The second organizing activity is quality assurance, which is performed to ensure that the unified dataset preserves both internal consistency and source traceability before any analytical use is considered [25]. Thus, a preliminary exploratory profiling step was conducted following the data consolidation and schema harmonization process shown in Figure 6.
Figure 6. Data consolidation and schema harmonization process
This is essential because fragmented sustainability records often contain duplicate entries, missing values, incompatible reporting scopes, and inconsistent units or category definitions, all of which can bias later estimation of Sustainability Score by altering the apparent relationship between resource use, emissions, logistics performance [22]. For this reason, overlapping records are deduplicated by checking shared identifiers and reporting periods, incomplete entries are evaluated against source context, and inconsistent values are reconciled through source-priority rules that privilege primary operational logs over derivative summaries where both exist. Provenance metadata are preserved throughout this process by retaining source tags, timestamps, facility identifiers, reporting boundaries, and document lineage, because data quality in a sustainability-oriented EMS context depends not only on numerical correctness but also on the ability to audit how each variable entered the analytical pipeline [22].
In this study, normalization of structured tabular formats, alignment of data types, and preservation of variable definitions are treated as prerequisites for valid downstream analytics, since predictive modelling on incoherent enterprise data would risk learning reporting artifacts rather than sustainability-relevant relationships [14, 25].
2.3 Phase 3: Analyze
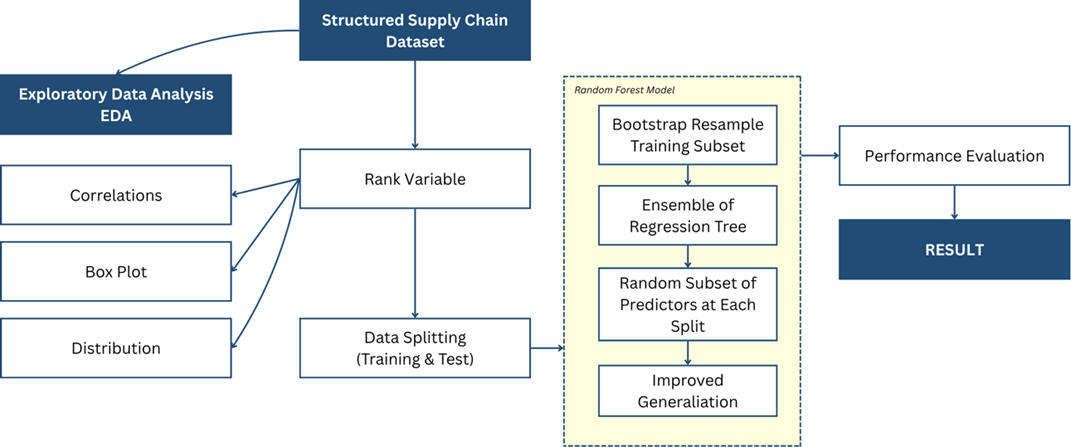
Since Sustainability Score has been defined as an existing continuous numerical target in the organized dataset, the Analyze phase formulates the task as a regression problem rather than a classification problem. The Analyze phase applies RF regression to estimate Sustainability Score from the structured supply chain dataset. Since Sustainability Score is a continuous numerical target, the task is formulated as a regression problem rather than a classification problem [16]. In this phase, the organized dataset is transformed into predictive sustainability intelligence by identifying relevant predictors, examining data patterns, and evaluating model performance. Before model fitting, Exploratory Data Analysis (EDA) was conducted through correlation analysis, box plots, and distribution analysis. Correlation analysis examined the direction and strength of relationships between predictors and Sustainability Score, box plots helped identify unusual observations, and distribution analysis showed the spread of each variable. These steps provided an initial understanding of the dataset before predictive modelling was performed [16].
Following EDA, variable ranking was performed using Univariate Regression and RReliefF. Univariate Regression identified predictors with strong individual relationships to Sustainability Score, while RReliefF complemented this by assessing predictor relevance through local differences among neighboring observations. This made RReliefF suitable for the regression setting because it can capture local dependencies and potential interaction effects before RF modelling [28]. After variable ranking, the dataset was evaluated using cross-validation. The training data were used to build the RF regression model, while the testing data were used to evaluate performance on unseen observations. This separation helped reduce overfitting and avoid overly optimistic results caused by data leakage [16, 29].
2.3.1 Random Forest model configuration
RF regression was applied because Sustainability_Score is a continuous target variable and the relationships among supply chain indicators may be nonlinear or interaction-based. Model evaluation was conducted using 10-fold cross-validation. In this procedure, the dataset was divided into 10 folds. In each iteration, nine folds were used for model training and the remaining fold was used for testing. This process was repeated until each fold had served once as the testing subset.
The RF model was implemented as a baseline regression model with bootstrap sampling, squared error as the splitting criterion, 100 regression trees, and a fixed random seed to support reproducibility. Model performance was evaluated using mean squared error (MSE), root mean squared error (RMSE), mean absolute error (MAE), mean absolute percentage error (MAPE), and coefficient of determination (R²). The final performance values were reported as mean ± standard deviation across the 10 validation folds. This evaluation strategy provides a more stable estimate of the model’s generalization performance. The RF configuration is summarized in Table 1, and the Analyze phase workflow is shown in Figure 7.
Table 1. Random Forest (RF) model configuration
|
Parameter |
Configuration |
|
Model type |
RF Regressor |
|
Target variable |
Sustainability_Score |
|
Number of trees |
100 |
|
Splitting criterion |
Squared error |
|
Bootstrap sampling |
Enabled |
|
Random seed |
Fixed |
|
Evaluation scheme |
10-fold cross-validation |
|
Evaluation metrics |
MSE, RMSE, MAE, MAPE, R² |
|
Reporting format |
Mean ± standard deviation |
Figure 7. Analyze phase workflow
RF is selected because it is suitable for structured tabular data and can model nonlinear relationships and interaction effects without requiring restrictive linear assumptions. In the RF procedure, multiple bootstrap-resampled training subsets are generated from the original training data. Each subset is used to train a separate regression tree, and the collection of these trees forms an ensemble of regression trees. At each split within a tree, only a random subset of predictors is considered, which reduces correlation among trees and improves the generalization ability of the model [15, 30]. Once the ensemble model has been developed, the framework proceeds to performance evaluation. Within each cross-validation fold, the RF model was trained on nine folds and evaluated on the remaining fold. The final performance was obtained by averaging the evaluation metrics across all 10 folds and reporting their standard deviations. The evaluation metrics should correspond to the regression nature of the target variable, meaning that model performance is assessed based on the difference between predicted and actual Sustainability Score values [16]. This ensures that the evaluation process reflects the predictive objective of the study rather than relying on classification-based measures that are not appropriate for a continuous outcome.
The final output of the Analyze phase is the result of the RF regression analysis. This result includes the estimated Sustainability Score, the ranked importance of predictors, and the model performance findings. Together, these outputs provide evidence-based sustainability intelligence for the AI Ladder-based EMS framework. The result is not limited to prediction accuracy alone; it also supports interpretation by identifying which supply chain variables contribute most strongly to sustainability performance. This makes the Analyze phase useful for both predictive assessment and managerial decision-making within a sustainability-oriented supply chain context [1, 15].
2.4 Phase 4: Infuse
This section illustrates the development of an AI Ladder-based EMS that embeds Sustainability Score prediction into green supply chain processes. The approach follows the Infuse phase of the IBM AI Ladder, which focuses on embedding AI into workflows to enable smarter operations and enhanced decision-making [17]. Infusing AI into the core EMS workflows enables the system to transform structured supply chain data into predictive sustainability insights, supporting better prioritization, intervention, and greener managerial decisions [6, 7].
2.4.1 Energy Management System process re-engineering and integration design
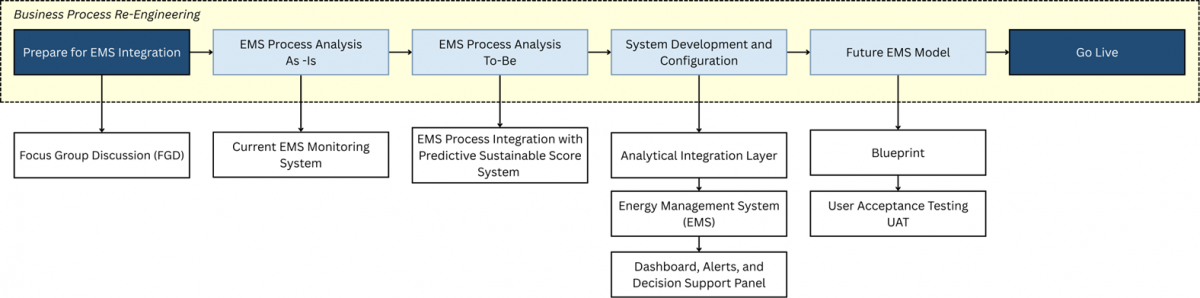
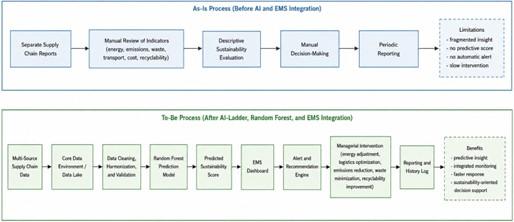
As illustrated in Figure 8, the process starts with EMS process re-engineering activities, including the review of the current state (As-Is) and the design of the desired future state (To-Be). These steps are crucial to ensure that the existing EMS process is clearly mapped and improved before introducing predictive intelligence [31].
Figure 8. Energy management system (EMS) process re-engineering and integration design
A Focus Group Discussion (FGD) is used to gather expert input on how managers currently monitor separate indicators such as energy consumption, renewable energy share, emissions, waste generation, transport distance, cost, and delivery time. This input informs the design of a new EMS process in which the predicted Sustainability Score is integrated into the decision flow as a synthesized indicator for greener supply chain management [1, 6].
The redesigned EMS process allows the system to move beyond descriptive monitoring. Instead of displaying isolated indicators only, the infused process places the predicted Sustainability Score alongside the underlying operational and environmental variables, enabling managers to interpret sustainability performance in a more coordinated and decision-oriented manner [17]. In this way, the prediction output is not treated as a substitute for detailed indicators, but as an additional interpretive layer that supports monitoring, review, and action planning within the EMS environment [6, 12].
2.4.2 System embedding, configuration, and validation
In practical terms, integration between the RF model and the EMS is carried out through an analytical integration layer. This layer receives prediction outputs from the model and forwards them to EMS modules for visualization and decision support. This pattern ensures that the prediction result is connected to the relevant unit of analysis, such as facility, process, supplier, shipment, or reporting period, while preserving access to the underlying sustainability-related variables [1, 15].
The EMS is configured to display the predicted Sustainability Score together with the operational indicators from which it is inferred. In this way, managers can understand not only the predicted condition, but also the operational pattern behind it. Once embedded into the system, the score can support decisions related to energy-efficiency adjustment, process redesign, logistics optimization, emissions reduction, waste minimization, and renewable-energy prioritization [6].
To ensure that the developed EMS workflow functions properly, the infused system is subsequently validated through functional verification, consistency checks between displayed scores and source records, scenario-based review of alert logic, and managerial usability assessment of dashboards and reporting outputs. This validation confirms that the prediction output is correctly rendered, interpretable, and usable within the EMS environment [31]. As a result, the Infuse phase completes the AI Ladder cycle by turning Sustainability Score prediction into a reusable decision-support capability for greener and more coherent supply chain management [6, 17].
This section presents the results generated across each stage of the AI Ladder framework, namely collect, organize, analyze, and infuse, as applied to the prediction of Sustainability Score from supply chain data within an AI Ladder-based EMS. Each stage represents a critical component of the proposed framework, showing how multi-source operational, environmental, logistics, and energy-related data are acquired, structured, modeled, and embedded into managerial workflows. By examining the outcomes of each phase, this section demonstrates how fragmented supply chain data are transformed into predictive sustainability intelligence and subsequently integrated into the EMS to support more informed, energy-aware, and sustainability-oriented decision-making.
3.1 Collect
Based on the implemented data collection process, the study obtained a structured green supply chain dataset containing 1,029 observations across five product categories, namely electronics, pharmaceutical, food, apparel, and automotive. The substantive collection output consisted of a contextual product category field and 10 operational and environmental predictor variables. This result is important because the collected dataset does not merely describe isolated business activities, rather, it captures the multidimensional conditions from which sustainability performance can be inferred. In line with the study design, the collected evidence reflects the interaction of material use, energy intensity, emissions burden, logistics performance, and economic trade-offs, all of which are necessary to construct an interpretable sustainability-oriented assessment rather than a single-metric environmental snapshot.
First variable collected is product type, it was retained because sustainability conditions differ across industrial contexts, as sectoral production logic influences resource demand, energy profiles, logistics structure, and waste characteristics; therefore, product category provides contextual variation that helps explain why similar operational values may imply different sustainability implications across supply chains [1, 8]. Raw material usage was collected from the material consumption report and raw material usage report, this variable is theoretically important because it represents material intensity at the input stage and therefore indicates how heavily a supply chain depends on physical resources, which in turn affects depletion pressure, downstream waste generation, and the broader efficiency of resource transformation. Energy consumption (obtained from the energy meter log and electricity consumption report) and manufacturing energy (obtained from the machine energy log and manufacturing energy report) are likewise central because they reflect the operational energy intensity of production and processing activities; higher energy demand generally signals greater resource use and lower eco-efficiency unless compensated by cleaner sourcing or superior process performance [6, 9]. By contrast, renewable energy, which collected from renewable energy mix report and energy sourcing report, share captures the quality rather than merely the quantity of energy use, because two operations with similar total energy demand may have very different sustainability implications depending on whether that demand is supplied by fossil-intensive or low-carbon energy sources [6, 7].
The environmental burden dimension is further represented by waste generated, CO2 emissions, and carbon footprint. Waste generated (collected from the waste generation report and waste disposal report) matters because it reflects process inefficiency, material loss, and disposal burden, making it a direct indicator of how far production remains dependent on linear throughput rather than on efficient and circular resource use [1, 8]. CO2 Emissions, collected from GHG emissions report are critical because they operationalize one of the most direct climate-related consequences of supply chain activity, especially where production, transport, and energy use remain carbon-intensive [5, 7]. Closely related to this, carbon footprint (obtained from the report) provides a broader representation of climate burden by expressing the aggregated greenhouse impact associated with operations, thereby helping translate fragmented activity data into a more policy-relevant sustainability signal [7, 8].
In the logistics and performance dimension, transport distance, delivery time, and cost were collected because sustainability in supply chains is shaped not only by production efficiency but also by how goods move through the network. Transport distance (obtained from delivery route report and transport tracking report) is a meaningful predictor because longer movement typically implies greater fuel demand, higher handling requirements, and larger logistics-related environmental exposure [4]. Delivery time that obtained from the report is also relevant because it reflects service-performance pressure and operational trade-offs, since faster fulfilment may require more energy-intensive transport modes, tighter scheduling, or less efficient routing, while longer delivery may indicate coordination inefficiencies that also affect sustainability performance [4, 32]. Cost is retained not simply as a financial variable, but as an indicator of operational trade-off, because sustainability in supply chains must remain interpretable in relation to economic feasibility, process configuration, and managerial decision constraints rather than being evaluated as a purely environmental abstraction [1].
3.2 Organize
3.2.1 Data consolidation and schema harmonization result
The Organize phase began with the integration of collected data originating from three source groups, namely internal records, supplier records, and external documents. Internal records provided operational and production-related evidence, supplier records supported supply chain and product-level information, while external documents complemented the dataset with sustainability-related disclosures and supporting environmental records. These heterogeneous inputs were first treated as collected data before being consolidated into a unified tabular structure. This step ensured that the dataset entering the Organize phase reflected the multi-source logic of the framework rather than a single isolated data source. Following data consolidation and schema harmonization, the collected supply chain records were transformed into an analysis-ready tabular dataset. Initial inspection of the imported file showed 1,029 observations and 16 columns. However, two fields found to be entirely irrelevant across all records and were therefore treated as non-substantive artifact fields rather than valid analytical variables, to maintain methodological consistency with the regression objective and to focus on continuously measured operational, environmental, logistics, energy, and cost indicators. After removing non-substantive artifact fields from the analytical predictor set, the organized dataset consisted of 1,029 observations and 13 structurally relevant columns, comprising one identifier field (ID), one contextual categorical variable (Product_Type), 10 operational and environmental predictor variables, and one continuous target variable (Sustainability_Score).
Schema harmonization was then completed by aligning variable names, analytical roles, and data formats into a consistent structure. Source-specific labels were converted into standardized variable names. This harmonization process reduced ambiguity across variables and ensured that each column represented a clearly defined analytical attribute. In addition, data standardization was reflected in the use of consistent units of measurement, categorical coding, and numeric formats, allowing the organized dataset to be directly used for downstream exploratory analysis and predictive modelling.
Table 2 presents a sample of the collected supply chain dataset, where each row represents one product record identified by ID and product type, and each column captures a key operational or sustainability-related variable. The variables shown include raw material usage, energy consumption, waste generated, transport distance, CO2 emissions, manufacturing energy, renewable energy share, cost, delivery time, and carbon footprint.
3.2.2 Data quality assurance and preliminary exploratory
The second result of the organize stage was the establishment of internal data consistency through quality assurance and preliminary exploratory profiling. The unified dataset was profiled for structural completeness, data type consistency, duplicate records, missing-value patterns, and basic range plausibility before entering the Analyze phase. The screening showed no duplicated rows and no duplicated identifiers.
Data deduplication and validation were carried out by checking whether repeated records appeared at either the row level or identifier level. The absence of duplicated rows indicates that the dataset did not contain repeated product records, while the absence of duplicated identifiers confirms that each observation could be treated as a unique analytical unit. Validation also involved checking whether each retained field had a meaningful analytical role, so that non-substantive artifact columns were excluded from the final dataset before modelling. The resulting data dictionary of the organized variables is presented in Table 3.
Table 2. Sample of the collected supply chain dataset
|
ID |
Product Type |
Raw Material Usage (kg) |
Energy Consumption (kWh) |
Waste Generated (kg) |
Transport Distance (km) |
CO₂ Emissions (kg) |
Manufacturing Energy (kWh) |
Renewable Energy (%) |
Cost ($) |
Delivery Time (days) |
Carbon Footprint (kg CO₂) |
Sustainability Score |
|
1 |
Pharmaceutical |
187.10 |
372.35 |
4.58 |
2706.23 |
206.07 |
195.02 |
77.31 |
4696.90 |
2 |
319 |
81.25 |
|
2 |
Food |
117.38 |
82.44 |
31.49 |
606.00 |
794.00 |
784.21 |
31.90 |
989.72 |
4 |
628 |
37.55 |
|
3 |
Automotive |
142.36 |
82.07 |
49.08 |
945.94 |
166.37 |
775.05 |
16.86 |
1321.19 |
2 |
905 |
41.77 |
|
4 |
Food |
185.28 |
55.45 |
10.32 |
2383.07 |
653.16 |
214.61 |
46.98 |
1464.67 |
1 |
47 |
56.79 |
|
5 |
Food |
144.38 |
480.43 |
39.84 |
1562.15 |
167.65 |
309.60 |
14.00 |
381.54 |
10 |
822 |
45.27 |
Table 3. Data dictionary of organized variables
|
Variable |
Type |
Role |
Description |
|
ID |
Text |
Identifier |
Unique record identifier |
|
Product_Type |
Categorical |
Feature |
Product category, such as apparel, automotive, electronics, food, and pharmaceutical |
|
Raw_Material_Usage_kg |
Numeric |
Feature |
Amount of raw material used in kilograms |
|
Energy_Consumption_kWh |
Numeric |
Feature |
Total energy consumption in kWh |
|
Waste_Generated_kg |
Numeric |
Feature |
Total waste generated in kilograms |
|
Transport_Distance_km |
Numeric |
Feature |
Transport distance in kilometres |
|
CO2_Emissions_kg |
Numeric |
Feature |
Carbon dioxide emissions in kilograms |
|
Manufacturing_Energy_kWh |
Numeric |
Feature |
Energy used during manufacturing |
|
Renewable_Energy_% |
Numeric |
Feature |
Share of renewable energy used |
|
Cost_$ |
Numeric |
Feature |
Operational or production cost |
|
Delivery_Time_days |
Numeric |
Feature |
Delivery time in days |
|
Carbon_Footprint_kg_CO2 |
Numeric |
Feature |
Carbon footprint in kg CO₂ |
|
Sustainability_Score |
Numeric |
Target |
Continuous target variable for prediction |
Datatype inspection confirmed that the organized dataset preserved an appropriate analytical structure: Product_Type remained categorical, and the remaining sustainability-related attributes were numeric and directly usable for downstream modeling.
Error checking further confirmed that the retained variables did not contain structurally invalid values. Numeric variables were screened for negative values, implausible ranges, and inconsistent formats, while categorical variables were checked for valid category representation. The results showed that the retained numeric attributes remained within plausible analytical ranges, Product_Type contained valid product categories. These checks indicate that the organized dataset was not only complete in structure, but also sufficiently clean and coherent for the subsequent Analyze phase.
Basic diagnostic profiling further indicated no negative values in the retained numeric variables and no immediately implausible structural ranges; for example, Renewable_Energy_% ranged from 10.02 to 79.92, Delivery_Time_days ranged from 1 to 14, and Sustainability_Score ranged from 12.80 to 91.53. Category coverage was also relatively balanced across Electronics (216 records), Pharmaceutical (213), Food (208), Apparel (198), and Automotive (194), suggesting that the organized dataset preserved cross-sector variation without severe category concentration. Overall, the Organize phase produced a structured dataset that was ready for the Analyze phase. The transformation pathway shown in the framework was completed by consolidating multi-source collected data, harmonizing the schema, removing non-substantive artifact fields, validating uniqueness, checking structural and numerical errors, standardizing variable formats, and preserving the analytical roles of each variable. As a result, the final dataset provided a coherent empirical basis for RF regression, with Sustainability_Score positioned as the continuous target variable and the remaining operational, environmental, logistics, and cost indicators positioned as predictors.
Table 4 summarizes the mean, standard deviation, minimum, and maximum values of the main numerical variables used in the analysis. The results show that the dataset contains sufficient variation across material usage, energy consumption, waste generation, transport distance, CO₂ emissions, manufacturing energy, renewable energy share, cost, delivery time, carbon footprint, and Sustainability_Score. In addition, Table 5 presents product-category comparisons for selected sustainability-related indicators. These comparisons show that the dataset is not concentrated in a single product category and that each category contains variation in Sustainability Score, renewable energy share, emissions, and waste generation.
The descriptive results show that Sustainability_Score had a mean of 51.154 with a standard deviation of 14.728, indicating moderate variation in sustainability performance across the 1,029 enterprise records. Renewable_Energy_% ranged from 10.017 to 79.923, while CO₂ emissions ranged from 50.896 kg to 999.383 kg, showing substantial variation in both cleaner energy use and emissions burden. Across product categories, Food recorded the highest average Sustainability_Score (52.787 ± 14.387), while Apparel recorded the lowest average Sustainability_Score (50.032 ± 14.803). These descriptive results provide empirical context for the subsequent variable ranking, correlation analysis, and RF regression.
3.3 Analyze
The Analyze phase began with variable ranking and correlation analysis to identify the preliminary relevance of each predictor to the Sustainability Score before RF regression was applied. Variable ranking was conducted using Univariate Regression and RReliefF, while Pearson correlation was used to examine the direction and strength of linear association between each predictor and the target variable.
Table 4. Descriptive statistics of organized numerical variables
|
Variable |
Distribution |
Mean |
Std. Dev. |
Min |
Max |
|
Raw_Material_Usage_kg |
105.396 |
55.526 |
10.880 |
199.889 |
|
|
Energy_Consumption_kWh |
274.301 |
129.784 |
50.061 |
499.256 |
|
|
Waste_Generated_kg |
25.482 |
14.068 |
1.001 |
49.978 |
|
|
Transport_Distance_km |
2504.796 |
1405.318 |
100.151 |
4988.972 |
|
|
CO2_Emissions_kg |
523.085 |
275.053 |
50.896 |
999.383 |
|
|
Manufacturing_Energy_kWh |
447.143 |
202.092 |
101.000 |
799.622 |
|
|
Renewable_Energy_% |
44.062 |
20.005 |
10.017 |
79.923 |
|
|
Cost_$ |
2495.966 |
1365.805 |
201.166 |
4980.861 |
|
|
Delivery_Time_days |
7.637 |
4.023 |
1.000 |
14.000 |
|
|
Carbon_Footprint_kg_CO2 |
501.458 |
284.585 |
0.000 |
1000.000 |
|
|
Sustainability_Score |
51.154 |
14.728 |
12.800 |
91.530 |
Table 5. Product-category comparison of selected sustainability indicators
|
Product Category |
N |
Sustainability Score Mean ± SD |
Renewable Energy Mean ± SD |
CO2 Emissions Mean ± SD |
Waste Generated Mean ± SD |
|
Electronics |
216 |
50.363 ± 14.853 |
44.869 ± 19.747 |
539.018 ± 289.467 |
26.769 ± 13.908 |
|
Pharmaceutical |
213 |
52.195 ± 14.993 |
44.843 ± 20.028 |
528.031 ± 271.918 |
23.614 ± 13.999 |
|
Food |
208 |
52.787 ± 14.387 |
45.986 ± 19.451 |
512.695 ± 273.493 |
25.018 ± 14.321 |
|
Apparel |
198 |
50.032 ± 14.803 |
43.061 ± 20.674 |
537.255 ± 269.300 |
26.645 ± 13.957 |
|
Automotive |
194 |
50.284 ± 14.498 |
41.265 ± 20.009 |
496.589 ± 269.844 |
25.410 ± 14.043 |
3.3.1 Variable ranking result
The first analytical result in the Analyze phase was obtained through variable ranking using two scoring methods, namely Univariate Regression and RReliefF. This step was conducted to identify which predictors showed the strongest relevance to the Sustainability Score before the RF regression model was fitted. The ranking result indicates that Renewable_Energy_% was the most influential variable, with the highest Univariate Regression score of 1012.034 and the highest RReliefF score of 0.223. This result suggests that the proportion of renewable energy used in supply chain operations has the strongest predictive relationship with the Sustainability Score. The second most important variable was CO2_Emissions_kg, with a Univariate Regression score of 468.784 and an RReliefF score of 0.208. This indicates that emissions burden is a major determinant of sustainability performance. The third ranked variable was Waste_Generated_kg, with a Univariate Regression score of 274.333 and an RReliefF score of 0.179, showing that waste generation also contributes substantially to explaining variation in the Sustainability Score. Together, these three variables demonstrate that the Sustainability Score is primarily shaped by energy sourcing, emissions intensity, and waste burden. The complete ranking results are reported in Table 6.
Table 6. Variable ranking results
|
Rank |
Variable |
Univariate Regression Score |
RReliefF Score |
Interpretation |
|
1 |
Renewable_Energy_% |
1012.034 |
0.223 |
Strongest predictor; positively related to sustainability performance |
|
2 |
CO2_Emissions_kg |
468.784 |
0.208 |
Major environmental burden predictor |
|
3 |
Waste_Generated_kg |
274.333 |
0.179 |
Important waste-related sustainability predictor |
|
4 |
Cost_$ |
32.443 |
0.152 |
Lower individual contribution, but still relevant |
|
5 |
Transport_Distance_km |
1.046 |
0.153 |
Weak individual effect; may contribute through interactions |
|
6 |
Energy_Consumption_kWh |
0.594 |
0.148 |
Weak individual effect |
|
7 |
Manufacturing_Energy_kWh |
0.212 |
0.152 |
Weak individual effect; possible interaction contribution |
|
8 |
Raw_Material_Usage_kg |
0.185 |
0.151 |
Weak individual effect |
|
9 |
Delivery_Time_days |
0.127 |
0.152 |
Weak individual effect |
|
10 |
Carbon_Footprint_kg_CO2 |
0.070 |
0.142 |
Weak individual effect in this ranking result |
Table 7. Correlation analysis results
|
Rank |
Relationship Pair |
Pearson Correlation (r) |
Direction |
Strength |
Interpretation |
|
1 |
Renewable_Energy_%↔ Sustainability_Score |
+0.705 |
Positive |
Strong |
Higher renewable energy share is associated with higher Sustainability Score |
|
2 |
CO2_Emissions_kg↔ Sustainability_Score |
-0.560 |
Negative |
Moderate to strong |
Higher CO₂ emissions are associated with lower Sustainability Score |
|
3 |
Waste_Generated_kg↔ Sustainability_Score |
-0.459 |
Negative |
Moderate |
Higher waste generation is associated with lower Sustainability Score |
|
4 |
Cost_$ ↔ Sustainability_Score |
-0.175 |
Negative |
Weak |
Higher cost tends to be associated with slightly lower Sustainability Score |
|
5 |
Transport_Distance_km ↔ Sustainability_Score |
+0.032 |
Positive |
Very weak |
Transport distance shows almost no direct linear relationship with Sustainability Score |
|
6 |
Energy_Consumption_kWh ↔ Sustainability_Score |
+0.024 |
Positive |
Very weak |
Energy consumption shows a minimal positive linear relationship with Sustainability Score |
|
7 |
Manufacturing_Energy_kWh ↔ Sustainability_Score |
-0.014 |
Negative |
Very weak |
Manufacturing energy shows almost no direct linear relationship with Sustainability Score |
|
8 |
Raw_Material_Usage_kg ↔ Sustainability_Score |
+0.013 |
Positive |
Very weak |
Raw material usage shows a negligible positive linear relationship with Sustainability Score |
|
9 |
Delivery_Time_days ↔ Sustainability_Score |
+0.011 |
Positive |
Very weak |
Delivery time shows almost no direct linear relationship with Sustainability Score |
|
10 |
Carbon_Footprint_kg_CO2 ↔ Sustainability_Score |
+0.008 |
Positive |
Very weak |
Carbon footprint shows a negligible direct linear relationship with Sustainability Score |
Other variables showed lower but still relevant scores. Cost_$ recorded a Univariate Regression score of 32.443 and an RReliefF score of 0.152, indicating that economic factors may contribute to sustainability performance, although less strongly than renewable energy, emissions, and waste. Variables such as Transport_Distance_km, Energy_Consumption_kWh, Manufacturing_Energy_kWh, Raw_Material_Usage_kg, Delivery_Time_days, and Carbon Footprint (kg CO2) showed comparatively smaller Univariate Regression scores. However, their RReliefF values remained within a relatively close range, suggesting that these variables may still contribute to prediction through interaction effects rather than through strong individual linear influence. This ranking result supports the use of RF regression because the predictors do not appear to contribute equally or only in a simple linear manner. While Univariate Regression highlights variables with strong individual associations, RReliefF provides additional insight into predictor relevance by considering local patterns in the data. Therefore, the variable ranking stage helps justify the subsequent use of an ensemble-based predictive model capable of capturing both dominant predictors and weaker variables that may become important through nonlinear interactions.
3.3.2 Correlation analysis result
The correlation analysis was conducted to examine the direction and strength of the linear relationship between each predictor and the Sustainability Score. The results are summarized in Table 7. The results show that renewable energy share had the strongest positive correlation with the score (r = +0.705), indicating that higher use of renewable energy was strongly associated with better sustainability performance. In contrast, carbon dioxide emissions (r = −0.560) and waste generation (r = −0.459) showed negative correlations, suggesting that higher environmental burdens were associated with lower sustainability performance. Other variables showed weaker relationships. Cost had a weak negative correlation (r = −0.175), while transport distance, energy consumption, raw material usage, delivery time, and carbon footprint showed very weak positive correlations, with values ranging from r=+0.008 to r=+0.032. Manufacturing energy showed a very weak negative correlation (r = −0.014). These results indicate that the direct linear relationships between these variables and the Sustainability Score were minimal.
Overall, the strongest linear relationships were found in renewable energy share, carbon dioxide emissions, and waste generation. However, weak individual correlations do not necessarily mean that the other predictors are irrelevant, because RF regression can capture nonlinear patterns and interaction effects among variables. Therefore, the correlation analysis served as a preliminary diagnostic step before the full predictive modelling stage.
3.3.3 Data distribution
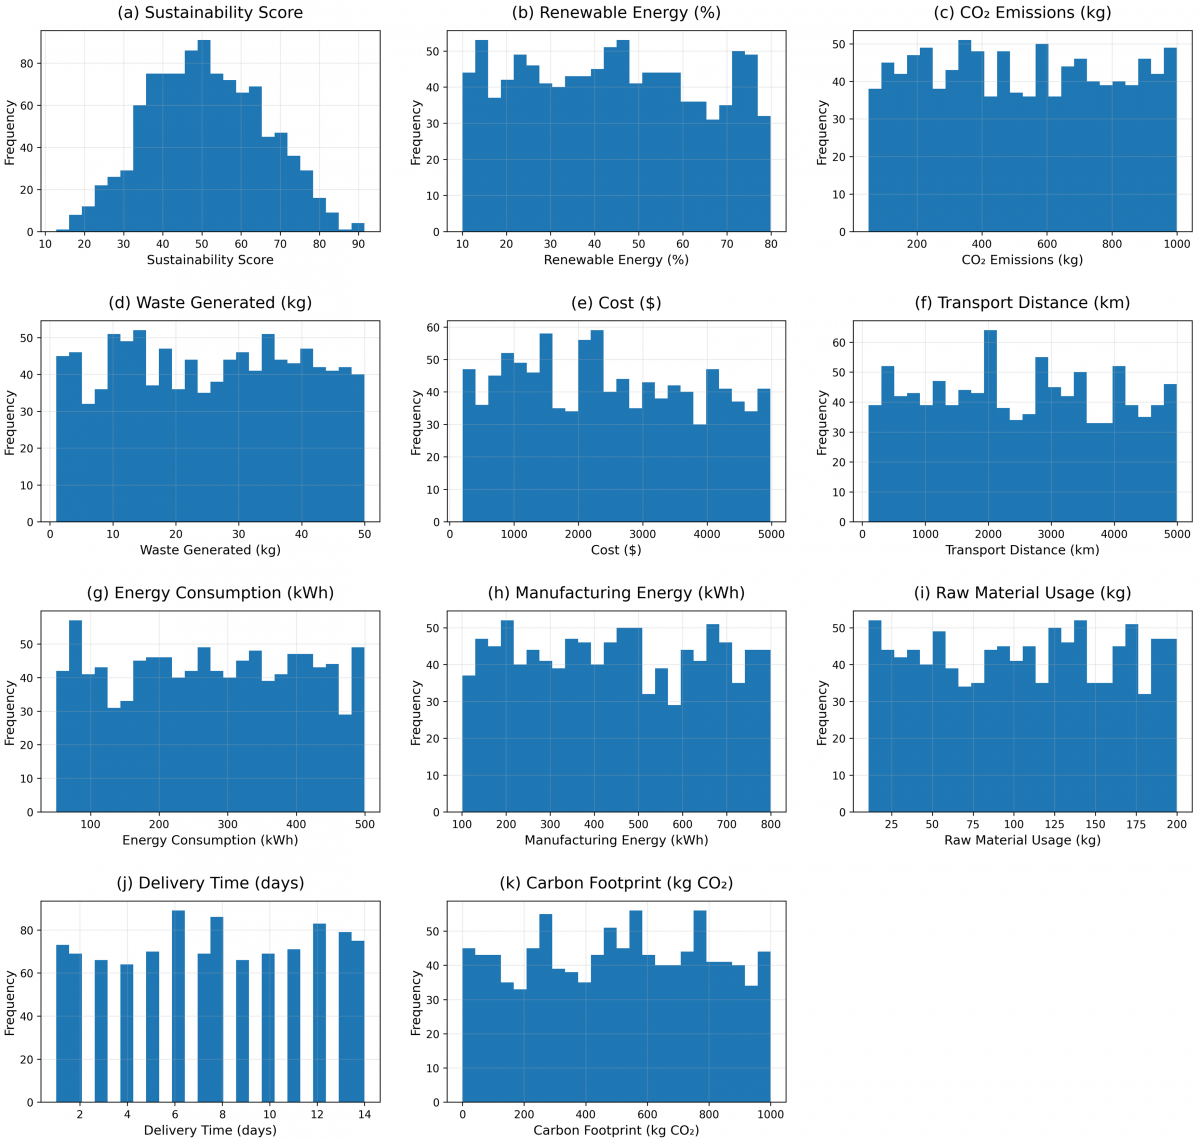
The distribution analysis was conducted to examine the spread and variability of the target and predictor variables before RF regression was applied. As shown in Figure 9, the numbered histograms represent the analytical variables used in the model: (1) Sustainability Score, (2) Renewable Energy (%), (3) CO₂ Emissions (kg), (4) Waste Generated (kg), (5) Cost ($), (6) Transport Distance (km), (7) Energy Consumption (kWh), (8) Manufacturing Energy (kWh), (9) Raw Material Usage (kg), (10) Delivery Time (days), and (11) Carbon Footprint (kg CO₂).
Figure 9. Distribution of target and predictor variables used in the Analyze phase
The target variable, shown in Figure 9 (a), indicates that Sustainability Score was approximately bell-shaped, with most observations concentrated around the middle score range. This pattern suggests that the target variable had sufficient variation and was suitable to be treated as a continuous regression outcome. The key predictors in panels (2)-(4) also showed broad variation. Renewable Energy was distributed across low to high renewable energy shares, while CO₂ Emissions and Waste Generated varied across different levels of environmental burden. These patterns support the earlier ranking and correlation results, where renewable energy, emissions, and waste appeared as the most influential variables.
The remaining predictors, presented in Figures 9 (b-k), also showed sufficient dispersion across their observed ranges. Cost and Transport Distance reflect variation in economic and logistics conditions, while Energy Consumption and Manufacturing Energy capture differences in operational and production energy use. Raw Material Usage, Delivery Time, and Carbon Footprint further indicate variation in material intensity, delivery performance, and carbon burden. Although several of these variables showed weak individual correlations with Sustainability Score, their distributions confirm that they still contain useful variation for RF regression, particularly because the model can capture nonlinear and interaction effects among predictors.
Overall, the distribution results indicate that the dataset was appropriate for the subsequent predictive modelling stage. The target variable was adequately dispersed, and the predictors collectively represented variation across environmental, energy, logistics, cost, material, and operational dimensions of supply chain sustainability.
3.3.4 Cross-validation procedure
After the preliminary analysis was completed, model evaluation was conducted using 10-fold cross-validation. The dataset was divided into 10 subsets or folds. In each validation round, nine folds were used to train the RF regression model, while the remaining fold was used to test model performance. The process was repeated 10 times so that each fold was used once as the testing subset. The final model performance was then summarized using the mean and standard deviation of the evaluation metrics across all folds.
This procedure was used to ensure that the reported model performance reflects the model’s ability to generalize across different subsets of the structured green supply chain dataset.
3.3.5 Random Forest and performance evaluation
The RF regression model was then applied to predict Sustainability Score using the selected operational, environmental, logistics, cost, and energy-related predictors. The model was constructed as an ensemble of regression trees. In this process, multiple bootstrap-resampled subsets were generated from the training data, and each subset was used to build a separate regression tree. At each split within a tree, only a random subset of predictors was considered, allowing the model to reduce tree correlation and capture nonlinear relationships as well as interaction effects among variables.
The final prediction was obtained by aggregating the outputs of all regression trees in the ensemble. This process made RF suitable for the present study because Sustainability Score was not expected to be shaped by one variable alone, but by the combined effects of renewable energy share, emissions, waste, cost, logistics distance, energy use, manufacturing energy, raw material usage, delivery time, and carbon footprint. Therefore, the model was able to evaluate both strong individual predictors and weaker variables that may contribute through interaction effects.
Model performance was assessed using regression evaluation metrics, including MSE, RMSE, MAE, MAPE, and R². The evaluation was conducted using 10-fold cross-validation, and the reported values represent the mean and standard deviation across the 10 validation folds. The results are presented in Table 8.
Table 8. Random Forest (RF) model performance evaluation
|
Model |
MSE |
RMSE |
MAE |
MAPE |
R² |
|
RF |
22.439 ± 0.948 |
4.737 ± 0.178 |
3.711 ± 0.125 |
8.588% ± 0.365% |
0.889 ± 0.007 |
The RF model achieved an MSE of 22.439 ± 0.948, RMSE of 4.737 ± 0.178, MAE of 3.711 ± 0.125, MAPE of 8.588% ± 0.365%, and R² of 0.889 ± 0.007. These results indicate that the model produced relatively low prediction error and stable predictive performance across validation folds. The R² value shows that approximately 88.9% of the variation in Sustainability_Score could be explained by the predictors included in the model, while the small standard deviation of R² indicates that the model performance was consistent across folds.
3.4 Infuse
The Infuse phase represents the final stage of the AI Ladder implementation, where the predictive output generated in the Analyze phase is embedded into the EMS to support sustainability-oriented supply chain decision-making. In this study, the RF regression model produces a predicted Sustainability Score based on structured operational, environmental, logistics, energy, and cost variables. The predicted score is not treated as an isolated analytical result, but as an actionable decision-support signal that can be used by managers to monitor sustainability performance, identify risk patterns, prioritize interventions, and coordinate greener supply chain actions.
The Infuse phase is particularly important because the value of predictive analytics depends not only on model performance, but also on how the prediction is operationalized inside managerial workflows. Therefore, this section explains the design of the EMS dashboard, required integration components, business process re-engineering, system blueprint, and User Acceptance Testing (UAT) for validating the developed AI Ladder-based EMS.
3.4.1 Focus group discussion results
Recommended energy management system dashboard features. The design discussion emphasized that the EMS dashboard should prioritize interpretability, traceability, and actionability. Since the prediction target is a continuous Sustainability Score, the dashboard should not only display the predicted score but also provide access to the underlying indicators that shape the score. These indicators include raw material usage, energy consumption, manufacturing energy, renewable energy share, waste generation, transport distance, CO2 emissions, carbon footprint, delivery time, and cost.
Experts agreed that the dashboard should remain simple enough for managerial use, while still being sufficiently informative to support sustainability-oriented analysis. The recommended EMS dashboard elements are shown in Table 9.
The discussion concluded that the EMS dashboard should function as a decision-oriented visual layer. Rather than presenting fragmented indicators separately, the dashboard should synthesize them through the predicted Sustainability Score while preserving access to the original variables. This design ensures that managers can understand not only the sustainability condition of a supply chain activity, but also the operational pattern that explains it.
Required energy management system integration components. The integration discussion emphasized that the RF prediction model must be connected to EMS workflows through an analytical integration layer. This layer receives model outputs, links each prediction to the relevant unit of analysis, and forwards the results to EMS modules for visualization, alerting, reporting, and decision support. The required EMS integration components and their functions are summarized in Table 10.
Table 9. Recommended Energy Management System (EMS) dashboard elements
|
Dashboard Element |
Description |
Purpose |
|
Sustainability Score Overview |
Displays the predicted Sustainability Score for each product, facility, supplier, shipment, or reporting period |
Provides a synthesized indicator of supply chain sustainability performance |
|
Risk Level Indicator |
Converts the predicted score into configurable risk categories such as low, medium, or high sustainability risk |
Helps managers prioritize records that require intervention |
|
Indicator Contribution Panel |
Shows key operational and environmental indicators behind the predicted score |
Improves interpretability and prevents the score from being treated as a black-box output |
|
Energy Performance Visualization |
Displays energy consumption, manufacturing energy, and renewable energy share |
Supports energy-efficiency monitoring and cleaner energy prioritization |
|
Emission and Waste Panel |
Shows CO2 emissions, carbon footprint, and waste generation |
Helps managers identify environmental burden and process inefficiency |
|
Logistics and Cost Panel |
Displays transport distance, delivery time, and cost |
Supports interpretation of operational trade-offs in sustainability performance |
|
Alert and Recommendation Panel |
Generates alerts when the predicted score falls below a predefined threshold or when high-risk indicators are detected |
Enables faster managerial response and targeted intervention |
|
Sustainability History Log |
Records score changes, alert history, managerial actions, and timestamps |
Supports traceability, audit, and continuous improvement |
|
Reporting Export |
Generates sustainability performance reports in Portable Document Format (PDF) or Excel format |
Supports documentation, managerial review, and performance tracking |
Table 10. Required Energy Management System (EMS) integration components
|
EMS Component |
Integration Function |
Explanation |
|
Core Data Environment / Data Lake |
Stores organized supply chain data |
Provides a centralized repository for structured operational, environmental, energy, logistics, and cost variables |
|
Data Pre-processing Layer |
Cleans, validates, harmonizes, and prepares data for modeling |
Ensures that fragmented records are transformed into analysis-ready inputs |
|
RF Prediction Engine |
Predicts Sustainability Score from structured indicators |
Converts supply chain data into predictive sustainability intelligence |
|
Analytical Integration Layer |
Transfers prediction outputs into EMS modules |
Connects the ML output with dashboard, alert, reporting, and decision-support functions |
|
Sustainability Monitoring Module |
Displays predicted score and supporting indicators |
Enables continuous monitoring of sustainability performance |
|
Energy Management Module |
Links the score with energy consumption, manufacturing energy, and renewable energy share |
Supports energy-efficiency improvement and renewable energy prioritization |
|
Emission and Waste Monitoring Module |
Tracks CO2 emissions, carbon footprint, and waste generation |
Supports emissions reduction and waste minimization |
|
Logistics Performance Module |
Connects the score with transport distance, delivery time, and cost |
Supports logistics optimization and operational trade-off analysis |
|
Alert and Notification Module |
Sends notifications when score or indicators exceed risk thresholds |
Reduces delay in managerial response |
|
Reporting and Audit Module |
Generates sustainability reports and stores historical logs |
Supports documentation, accountability, and continuous improvement |
|
Decision Support Module |
Provides recommended intervention areas based on score and indicator patterns |
Helps managers prioritize sustainability-oriented actions |
The discussion confirmed that the EMS should not be limited to passive monitoring. Instead, it should operate as a sustainability governance architecture where predictive analytics, energy management, environmental monitoring, logistics assessment, and managerial action are connected within one integrated workflow.
In implementation terms, the proposed EMS was operationalized as a prototype decision-support workflow using the organized enterprise dataset. The workflow was designed as a batch-based analytical process rather than a fully real-time enterprise deployment. The organized dataset was first stored in a structured tabular format containing the record ID, Product_Type, operational indicators, environmental indicators, logistics indicators, energy indicators, cost indicator, and the LCA-derived Sustainability_Score. Before prediction, the pre-processing layer checked data type consistency, missing values, duplicate identifiers, numerical range plausibility, and alignment between source records and analytical variables. The cleaned dataset was then passed into the RF prediction engine to generate predicted Sustainability_Score values for each supply chain record.
Each prediction output was stored together with the record ID, product category, prediction timestamp, predicted score, supporting indicators, and risk status. The analytical integration layer then transferred this output to the EMS dashboard and reporting modules. In this prototype, the analytical integration layer functioned as a connector between the prediction output table and the EMS interface, allowing the dashboard to display the predicted Sustainability_Score, supporting variables, risk level, alert status, and recommended intervention area for each record. Score-based thresholds were used to convert predicted Sustainability_Score into managerial signals, where lower predicted scores were flagged for review or intervention. These thresholds were configured as adjustable parameters so that they could be aligned with organizational policy, historical performance baselines, or regulatory requirements.
Business process re-engineering flow. This section presents the re-engineering of the green supply chain sustainability monitoring process. The transformation moves from a conventional descriptive monitoring approach to a predictive, AI-enabled, and EMS-integrated workflow. The As-Is and To-Be process flows are illustrated in Figure 10.
Before integration, the EMS process relied on fragmented reports and descriptive review of separate indicators. After reengineering, the process integrates structured supply chain data, RF prediction, Sustainability Score output, EMS dashboard monitoring, alert generation, and historical reporting.
Figure 10. Process re-engineering flow: As-Is and To-Be
As-Is process before AI and Energy Management System integration. Before the integration of RF prediction into EMS, sustainability monitoring relied mainly on separate reports and historical indicators. Managers reviewed energy consumption, emissions, waste, logistics, and cost data independently. Although these indicators were useful, the existing process did not provide an integrated prediction of sustainability performance. The As-Is process steps are listed in Table 11.
Table 11. As-Is process
|
Step |
Description |
|
1 |
Supply chain data are collected from separate material, energy, production, emissions, waste, logistics, and cost reports. |
|
2 |
Managers review each indicator individually without a synthesized Sustainability Score. |
|
3 |
Sustainability evaluation is performed descriptively using historical data and periodic reporting. |
|
4 |
Energy adjustment, emissions reduction, waste minimization, and logistics improvement depend heavily on manual interpretation. |
|
5 |
There is limited integration between predictive analytics and EMS-based managerial workflows. |
|
6 |
Alerts, prioritization, and intervention planning are not automatically triggered by predicted sustainability risk. |
This conventional workflow limits proactive decision-making. Although data are available, the absence of predictive integration makes it difficult to identify which supply chain activities require urgent sustainability-oriented intervention.
Table 12. To-Be process
|
Step |
Description |
|
1 |
Multi-source supply chain data are collected from material, energy, manufacturing, emissions, waste, transport, delivery, and cost records. |
|
2 |
The collected data are consolidated into the core data environment or data lake. |
|
3 |
Data are cleaned, harmonized, validated, and transformed into an analysis-ready dataset. |
|
4 |
The RF regression model predicts Sustainability Score from structured supply chain indicators. |
|
5 |
Prediction results are transferred into EMS through the analytical integration layer. |
|
6 |
EMS displays the predicted score, supporting indicators, risk level, and historical trends through the dashboard. |
|
7 |
Alerts are triggered when the predicted score falls below a predefined threshold or when high-risk indicator patterns are detected. |
|
8 |
Managers use the EMS output to prioritize energy-efficiency adjustment, process redesign, logistics optimization, emissions reduction, waste minimization. |
|
9 |
Reports and action logs are updated to support audit, traceability, and continuous improvement. |
To-Be process after AI Ladder, Random Forest, and Energy Management System integration. After re-engineering, the process integrates structured supply chain data, RF regression, and EMS-based decision support. The system predicts Sustainability Score from organized supply chain indicators and embeds the prediction output into EMS dashboards, alerts, reports, and managerial workflows. The To-Be process steps are listed in Table 12.
In the To-Be model, AI does not replace managerial judgment. Instead, RF regression functions as an analytical engine that transforms structured supply chain data into predictive sustainability intelligence. EMS then operationalizes this intelligence by making it visible, interpretable, and actionable for managerial decision-making.
3.4.2 Energy Management System blueprint
The EMS system blueprint defines how supply chain data flow from source records into prediction outputs and then into EMS modules. The blueprint consists of three main layers: input pipeline, EMS modules, and dashboard interface.
Input pipeline. The input pipeline begins with multi-source supply chain records. These records are collected from operational, environmental, energy, logistics, and cost sources. After collection, the data are consolidated in the core data environment, organized into structured variables, processed by the RF model, and transferred into EMS as predicted Sustainability Score. The input pipeline components are detailed in Table 13.
Table 13. Input pipeline
|
Source |
Type |
Processing |
|
Material Consumption Report / Raw Material Usage Report |
Structured operational data |
Captures raw material usage and material intensity |
|
Energy Meter Log / Electricity Consumption Report |
Structured energy data |
Captures energy consumption and electricity use |
|
Machine Energy Log / Manufacturing Energy Report |
Structured production-energy data |
Captures manufacturing energy intensity |
|
Renewable Energy Mix Report / Energy Sourcing Report |
Structured energy sourcing data |
Captures renewable energy share |
|
Waste Generation Report / Waste Disposal Report |
Structured environmental data |
Captures waste generation and disposal burden |
|
GHG Emissions Report / Carbon Accounting Record |
Structured environmental data |
Captures CO2 emissions and carbon footprint |
|
Delivery Route Report / Transport Tracking Report |
Structured logistics data |
Captures transport distance and logistics movement |
|
Delivery Performance Report |
Structured service-performance data |
Captures delivery time and fulfillment performance |
|
Cost Report |
Structured financial-operational data |
Captures operational cost and economic trade-off |
|
Organized Supply Chain Dataset |
Analysis-ready tabular data |
Provides validated input for RF regression |
|
RF Output |
Prediction result |
Produces predicted Sustainability Score |
|
Analytical Integration Layer |
Application Programming Interface (API) / middleware / system connector |
Sends prediction output and supporting indicators to EMS modules |
This pipeline ensures that the EMS receives not only descriptive monitoring data, but also processed predictive output. Therefore, the Sustainability Score becomes a managerial signal that can be connected to specific products, facilities, suppliers, shipments, or reporting periods.
Energy Management System modules used. The developed EMS consists of interconnected modules that transform Sustainability Score prediction into operational decision support. Each module performs a specific role in monitoring, interpreting, alerting, reporting, and supporting sustainability-oriented action. These modules are summarized in Table 14.
Together, these modules create a closed-loop EMS workflow. The RF model predicts Sustainability Score, the integration layer sends the output to EMS, the dashboard visualizes the condition, and EMS modules support monitoring, alerting, reporting, and intervention planning
Table 14. Energy Management System (EMS) modules used
|
Module |
Function |
Purpose |
|
Data Management Module |
Stores organized supply chain data and prediction outputs |
Maintains structured, traceable, and auditable sustainability data |
|
Sustainability Monitoring Module |
Receives and displays predicted Sustainability Score |
Tracks sustainability performance across products, facilities, suppliers, shipments, or reporting periods |
|
Energy Management Module |
Monitors energy consumption, manufacturing energy, and renewable energy share |
Supports energy-efficiency adjustment and renewable energy prioritization |
|
Emission and Waste Monitoring Module |
Tracks CO2 emissions, carbon footprint, and waste generation |
Supports emissions reduction, waste minimization, and environmental burden control |
|
Logistics Performance Module |
Tracks transport distance, delivery time, and cost |
Supports logistics optimization and operational trade-off analysis |
|
Alert and Notification Module |
Triggers warnings when score or indicators exceed risk thresholds |
Enables faster managerial response |
|
Decision Support Module |
Generates recommended intervention areas based on prediction and indicator patterns |
Helps managers prioritize corrective and improvement actions |
|
Reporting and Audit Module |
Produces sustainability, energy, emissions, and operational performance reports |
Supports documentation, audit, compliance, and continuous improvement |
Dashboard element. The dashboard functions as the visual and interpretive layer of the EMS. It allows managers to observe the predicted Sustainability Score, understand the supporting variables, receive alerts, review historical changes, and determine appropriate sustainability-oriented actions. The dashboard components are described in Table 15.
The dashboard is designed to support three managerial questions. First, what is the current predicted sustainability condition? Second, which operational and environmental indicators explain the condition? Third, what action should be prioritized to improve sustainability performance? By answering these questions, the dashboard helps shift EMS from passive monitoring toward predictive and proactive decision support.
Table 15. Dashboard Elements
|
Component |
Description |
Visual Type |
|
Sustainability Score Card |
Displays predicted Sustainability Score for selected product, facility, supplier, shipment, or reporting period |
Key performance indicator (KPI) card |
|
Risk Level Badge |
Shows configurable sustainability risk level based on predicted score |
Color-coded label |
|
Indicator Summary Panel |
Displays raw material usage, energy consumption, waste, emissions, transport distance, cost, and delivery time |
KPI panel |
|
Energy and Emission Trend Graph |
Visualizes energy use, renewable energy share, CO2 emissions, and carbon footprint over time |
Line chart / bar chart |
|
Product Category Filter |
Allows users to filter results by electronics, pharmaceutical, food, apparel, or automotive category |
Dropdown filter |
|
Logistics and Cost Panel |
Shows transport distance, delivery time, and cost trade-offs |
Table / chart |
|
Alert Panel |
Displays warnings for low predicted score or high-risk indicator patterns |
Notification cards |
|
Recommendation Panel |
Suggests intervention areas such as energy adjustment, waste reduction, emissions control, or logistics optimization |
Action list |
|
History Log |
Records score changes, alerts, timestamps, and managerial actions |
Timeline / log table |
|
Reporting Export |
Enables export of dashboard summaries into PDF or Excel format |
Export button |
3.4.3 User Acceptance Testing (UAT) results
Prototype-based functional UAT was conducted to evaluate whether the developed AI Ladder-based EMS workflow functioned according to its intended design and whether the system output could be understood and used by managerial users. The UAT focused on functional readiness rather than long-term operational deployment. Therefore, the test examined whether the prototype could receive RF prediction outputs, display Sustainability_Score and supporting indicators, apply risk-level logic, trigger alerts, generate recommendations, store history logs, and export reports for managerial review.
The EMS module test verified whether prediction outputs were correctly integrated into monitoring, energy management, emission and waste tracking, logistics assessment, alerting, reporting, and decision-support workflows. The dashboard test verified whether users could access, filter, interpret, and respond to Sustainability Score predictions.
UAT result for energy management system modules. Each EMS module was tested to ensure that the predicted Sustainability Score could be integrated into operational workflows. The test focused on whether the EMS could receive prediction output, link it with the correct source record, display supporting indicators, trigger alerts, support decision-making, and generate reports. The UAT results for the EMS modules are presented in Table 16.
The UAT result confirms that the AI Ladder-based EMS can operationalize RF prediction output into a usable managerial workflow. The system does not only predict Sustainability Score, but also transforms the prediction into monitoring, alerting, reporting, and decision-support functions. Therefore, the Infuse phase successfully embeds AI into the EMS environment and supports greener, more coherent, and more proactive supply chain decision-making.
Table 16. User Acceptance Testing (UAT) result for Energy Management System (EMS) modules used
|
No. |
EMS Module |
Test Case |
Expected Result |
Status |
|
1 |
Data Management Module |
Store organized supply chain data and prediction output |
Data are stored with correct ID, product type, indicators, and Sustainability Score |
Passed |
|
2 |
Sustainability Monitoring Module |
Display Sustainability Score by record, category, or reporting period |
Score appears correctly and can be monitored by users |
Passed |
|
3 |
Energy Management Module |
Link score with energy consumption, manufacturing energy, and renewable energy share |
Energy-related indicators are displayed and connected to the predicted score |
Passed |
|
4 |
Emission and Waste Monitoring Module |
Display CO2 emissions, carbon footprint, and waste generation |
Environmental burden indicators are shown accurately |
Passed |
|
5 |
Logistics Performance Module |
Display transport distance, delivery time, and cost |
Logistics indicators are accessible, filterable, and linked to each record |
Passed |
|
6 |
Alert and Notification Module |
Trigger alert when score falls below threshold or indicator risk increases |
Notification is generated and delivered to relevant users |
Passed |
|
7 |
Decision Support Module |
Generate intervention recommendation based on prediction and indicator pattern |
System provides relevant action direction for managerial review |
Passed |
|
8 |
Reporting and Audit Module |
Export EMS sustainability report |
Report includes score, indicators, risk level, timestamp, and action log |
Passed |
UAT result for dashboard elements. All dashboard elements performed as expected during UAT. Users were able to view the predicted score, examine supporting variables, filter records, receive alerts, review recommended actions, track historical changes, and export reports. This confirms that the dashboard is functionally reliable and suitable for EMS-based sustainability decision support. The UAT result for dashboard elements is shown in Table 17.
Table 17. User Acceptance Testing (UAT) result for EMS dashboard elements
|
No. |
Component |
Test Case |
Expected Result |
Status |
|
1 |
Sustainability Score Card |
Display predicted score from RF output |
Correct Sustainability Score appears for the selected record |
Passed |
|
2 |
Risk Level Badge |
Convert predicted score into predefined risk level |
Risk category is displayed correctly based on configured threshold |
Passed |
|
3 |
Indicator Summary Panel |
Display supporting operational and environmental variables |
Variables are shown completely and match source data |
Passed |
|
4 |
Energy and Emission Trend Graph |
Visualize energy, renewable energy share, CO2 emissions, and carbon footprint |
Charts are generated accurately from EMS data |
Passed |
|
5 |
Product Category Filter |
Filter dashboard by product category |
Selected category returns correct records |
Passed |
|
6 |
Logistics and Cost Panel |
Display transport distance, delivery time, and cost |
Logistics and cost indicators are accessible and filterable |
Passed |
|
7 |
Alert Panel |
Trigger warning for low score or high-risk indicators |
Alert appears on dashboard and notification module |
Passed |
|
8 |
Recommendation Panel |
Display suggested intervention based on risk pattern |
Relevant action recommendation is shown |
Passed |
|
9 |
History Log |
Track score changes and alert history |
Logs show timestamp, record ID, score, and action status |
Passed |
|
10 |
Reporting Export |
Export dashboard summary into report format |
PDF or Excel report is generated successfully |
Passed |
The results of this study demonstrate that Sustainability Score can be effectively predicted from structured green supply chain indicators when operational, environmental, logistics, energy, and cost variables are organized into a coherent analytical framework. Based on 10-fold cross-validation, the RF regression model achieved an R² value of 0.889 ± 0.007, with an MSE of 22.439 ± 0.948, RMSE of 4.737 ± 0.178, MAE of 3.711 ± 0.125, and MAPE of 8.588% ± 0.365%. These values indicate that the selected predictors explain a substantial proportion of the variation in Sustainability_Score and produce relatively low prediction error across validation folds. The small standard deviations across folds further suggest that the model performance is stable [1, 4].
The strongest empirical finding concerns the dominant role of renewable energy share in shaping Sustainability Score. In the variable ranking result, Renewable_Energy_% obtained the highest Univariate Regression score and the highest RReliefF score, while the correlation analysis also showed the strongest positive relationship between renewable energy share and Sustainability Score. This indicates that the quality of energy sourcing is a central determinant of sustainability performance in the observed dataset. Energy management systems can function as structured mechanisms for improving energy performance [12], and the result of this study extends that logic by showing that renewable energy share can function as a key predictive signal in an EMS-oriented sustainability framework. In practical terms, two supply chain activities may consume similar amounts of energy, but their sustainability implications can differ substantially when one relies more heavily on renewable energy. This result also helps explain why renewable energy share appears more influential than total energy consumption in the observed findings. Total energy consumption captures the quantity of energy used, whereas renewable energy share captures the quality of energy sourcing. Therefore, sustainability-oriented EMS should not only monitor how much energy is consumed, but also whether the energy profile supports cleaner and lower-carbon operations. Recent studies on AI-enabled energy management also emphasize that digital and ML approaches become more valuable when they help organizations identify operational patterns that influence energy efficiency and sustainability outcomes [6, 9].
The second and third strongest predictors, CO₂ emissions and waste generation, further validate the environmental logic of the Sustainability Score. CO₂ emissions showed a moderate-to-strong negative relationship with the target variable, while waste generation also showed a negative relationship. These results indicate that higher environmental burden is associated with lower sustainability performance. This interpretation is consistent with the Greenhouse Gas Protocol, which treats emissions measurement as a foundation for organizational greenhouse gas accounting and reporting [22]. Similarly, Global Reporting Initiative (GRI) Standards recognize emissions, energy, materials, and waste as important environmental dimensions in sustainability disclosure. The negative association between waste generation and Sustainability Score is also theoretically coherent. Waste reflects material loss, process inefficiency, disposal burden. In GRI 306: Waste 2020, waste is treated as a material sustainability topic when it reflects significant organizational and value-chain impacts [21]. In the context of this study, the empirical result supports that logic: as waste generation increases, the predicted sustainability condition tends to decline. Waste should therefore be understood not merely as a reporting attribute, but as a core predictor of green supply chain performance.
Several other variables, including transport distance, energy consumption, manufacturing energy, raw material usage, delivery time, cost, and carbon footprint, showed weaker individual linear relationships with Sustainability Score. However, weak correlation does not necessarily imply irrelevance. In predictive modelling, relationships among variables may be nonlinear, indirect, or interaction-based, especially when the outcome is shaped by multiple operational dimensions [16]. For example, transport distance may not independently predict Sustainability Score strongly, but it can become meaningful when interpreted together with emissions, delivery time, logistics cost, and energy use. The same logic applies to manufacturing energy, which may have different sustainability implications depending on renewable energy share and process efficiency. This supports the selection of RF regression as the main predictive model. Breiman [15] introduced RF as an ensemble method that combines multiple decision trees and can capture nonlinear relationships and interaction effects. In this study, that capability is important because Sustainability Score is shaped by the combined influence of renewable energy share, emissions, waste, logistics conditions, material use, cost, delivery performance, and carbon-related indicators. A purely linear model may underrepresent these complex relationships, whereas RF can learn predictive patterns from multiple variables without assuming that each predictor contributes independently or linearly.
The methodological validity of RF is further strengthened by the structure of the prediction task. Since Sustainability Score is a continuous numerical target, the study appropriately formulates the task as a regression problem. The use of MSE, RMSE, MAE, MAPE, and R² is therefore suitable because these metrics evaluate the difference between predicted and actual numerical values [16]. The R² value of 0.889 ± 0.007 indicates strong predictive capacity, while the MAPE value of 8.588% ± 0.365% suggests an average prediction error of approximately 8.6% across validation folds. These results should be interpreted as evidence of predictive usefulness rather than causal proof. The model shows that observed supply chain indicators can estimate Sustainability Score with reasonable accuracy, but it does not prove that changing one predictor will automatically cause a proportional change in the score.
From a system perspective, the most important implication lies in the Infuse phase. Many AI and predictive analytics studies stop after model evaluation, leaving the prediction output as an isolated analytical result. This study extends the analytical output into an EMS workflow by embedding the predicted Sustainability Score into dashboard visualization, risk indicators, alert notifications, recommendation panels, reporting, and audit logs. This design is aligned with the role of EMS as a structured framework for managing and improving energy performance [33]. It also supports the argument that AI-based energy management becomes more valuable when prediction and optimization outputs are connected to operational decision-making [6]. The As-Is and To-Be process comparison strengthens the managerial contribution of the study. In the As-Is condition, managers review separate indicators manually and depend on descriptive monitoring. In the To-Be condition, the organized dataset is processed by RF regression, transferred into EMS through an analytical integration layer, displayed through dashboards, and connected to alerts, recommendations, and reports. This transformation is consistent with the direction of AI-based logistics optimization, where analytics becomes more useful when sustainability criteria are embedded into operational decision processes rather than treated as separate reports [4]. In this way, the proposed EMS does not replace managerial judgment, but strengthens it by providing a structured, predictive, and traceable decision-support signal.
The UAT results further support the practical feasibility of the proposed EMS integration. Dashboard elements and EMS modules were reported as passed, indicating that the system can display predicted Sustainability Score, show supporting variables, filter records, generate alerts, provide recommendations, track historical logs, and export reports. These results validate the functional readiness of the proposed EMS design. However, the UAT should be interpreted as functional validation rather than long-term operational validation. Further deployment testing would still be needed to examine whether the EMS improves sustainability outcomes over multiple reporting periods, across different organizations, and under real-time operational conditions.
Overall, the findings validate the central proposition of this study: the value of predictive analytics in green supply chain management depends not only on model accuracy, but also on whether prediction outputs are embedded into managerial systems. The AI Ladder provides a coherent implementation pathway by linking data collection, organization, analysis, and system infusion. By combining RF regression with EMS-based workflows, the proposed framework helps organizations convert fragmented supply chain data into predictive sustainability intelligence that is visible, interpretable, traceable, and actionable. This makes the study theoretically relevant for sustainability measurement, methodologically relevant for predictive modelling, and practically relevant for energy-aware supply chain decision support.
Ensuring sustainable supply chain performance demands not only accurate prediction but also a seamless bridge from structured sustainability evidence to managerial action, a gap that many analytics-only studies leave unaddressed. This study operationalizes the AI Ladder end-to-end through Collect, Organize, Analyze, and Infuse stages by acquiring multi-source green supply chain data; consolidating and validating operational, environmental, logistics, energy, and cost indicators; applying RF regression to predict Sustainability Score; and embedding the prediction output into an EMS.
Across 1,029 observations from five product categories, the RF model achieved stable predictive performance under 10-fold cross-validation, with MSE = 22.439 ± 0.948, RMSE = 4.737 ± 0.178, MAE = 3.711 ± 0.125, MAPE = 8.588% ± 0.365%, and R² = 0.889 ± 0.007. Renewable energy share emerges as the strongest predictor, followed by CO₂ emissions and waste generation, indicating that energy sourcing, emissions burden, and waste intensity are central signals of sustainability performance in the observed dataset. Crucially, this study translates model outputs into execution through EMS integration that provides dashboard visualization, risk indicators, alerts, recommendation panels, reporting, and audit logs. By embedding Sustainability Score prediction directly within EMS workflows, managers can shift from fragmented, periodic, and descriptive monitoring to continuous, predictive, energy-aware, and sustainability-oriented supply chain decision-making.
We note several scope qualifications. The model was developed and evaluated using real enterprise records within the scope of this study. Therefore, although the dataset reflects actual operational and sustainability-related records, its generalizability across broader supply chain settings still requires further validation. The raw enterprise records cannot be fully disclosed due to confidentiality restrictions; however, the study provides the variable dictionary, scoring logic, preprocessing procedure, modelling configuration, and cross-validation protocol to support methodological reproducibility. In addition, the EMS risk thresholds, alert rules, and intervention priorities remain configurable and should be calibrated according to organizational policy, regulatory requirements, industry context, and historical sustainability baselines. The EMS integration was also validated through functional UAT, but long-term operational deployment remains necessary to assess whether the system can consistently improve energy efficiency, emissions control, waste reduction, and logistics planning over time. The concrete directions are outlined as follows:
(i) validation of the RF model using real-time or periodically updated supply chain data;
(ii) testing of the AI Ladder-based EMS across multiple companies, product categories, and operational contexts;
(iii) calibration of EMS risk thresholds, and alert rules based on organizational sustainability targets and historical performance baselines;
(iv) deeper interpretation of RF predictor importance to clarify how renewable energy share, CO₂ emissions, waste generation, and other indicators shape Sustainability Score;
(v) extension of UAT into longer operational trials involving managerial users, dashboard monitoring, alert response, reporting, and intervention follow-up;
(vi) evaluation of long-term EMS deployment to assess whether predictive intervention improves energy efficiency, emissions reduction, waste minimization, and logistics performance;
(vii) development of auditable historical condition logs to support traceability, managerial accountability, and continuous improvement in sustainability-oriented supply chain management.
[1] Hmouda A.M.O., Orzes G., Sauer P.C. (2024). Sustainable supply chain management in energy production: A literature review. Renewable and Sustainable Energy Reviews, 191: 114085. https://doi.org/10.1016/j.rser.2023.114085
[2] Li J.Y. (2025). Research on energy efficiency optimization strategies for E-commerce platform product supply chain based on artificial intelligence. Sustainable Energy Research, 12: 63. https://doi.org/10.1186/s40807-025-00203-w
[3] Becerra P., Mula J., Sanchis R. (2025). A conceptual framework for sustainable location, inventory and transportation problems in a supply chain context. Annals of Operations Research, 364: 301-321. https://doi.org/10.1007/s10479-025-06498-8
[4] Chen W.W., Men Y., Fuster N., Osorio C., Juan A.A. (2024). Artificial intelligence in logistics optimization with sustainable criteria: A review. Sustainability, 16(21): 9145. https://doi.org/10.3390/su16219145
[5] Hussain J., Lee C.C., Lev B. (2025). Optimizing AI-based emission reduction efficiency and subsidies in supply chain management: A sensitivity-based approach with duopoly game dynamics. Journal of Cleaner Production, 494: 144991. https://doi.org/10.1016/j.jclepro.2025.144991
[6] Javed H., Eid F., El-Sappagh S., Abuhmed T. (2025). Sustainable energy management in the AI era: A comprehensive analysis of ML and DL approaches. Computing, 107: 132. https://doi.org/10.1007/s00607-025-01485-0
[7] Wang Q., Li Y.F., Li R.R. (2025). Integrating artificial intelligence in energy transition: A comprehensive review. Energy Strategy Reviews, 57: 101600. https://doi.org/10.1016/j.esr.2024.101600
[8] Raygoza-Limon M.E., Orduno-Osuna J.H., Trujillo-Hernandez G., et al. (2025). Supply chain management in renewable energy projects from a life cycle perspective: A review. Applied Sciences, 15(9): 5043. https://doi.org/10.3390/app15095043
[9] Fan J.J., Li W.Q., Chen L. (2025). How does artificial intelligence affect energy efficiency? Evidence from supply chain digitization pilot program. Energy Economics, 149: 108728. https://doi.org/10.1016/j.eneco.2025.108728
[10] Rohde F., Wagner J., Meyer A., Reinhard P., Voss M., Petschow U., Mollen, A. (2023). Broadening the perspective for sustainable AI: Comprehensive sustainability criteria and indicators for AI systems. arXiv preprint arXiv:2306.13686. https://doi.org/10.48550/arXiv.2306.13686
[11] Toderas M. (2025). Artificial intelligence for sustainability: A systematic review and critical analysis of AI applications, challenges, and future directions. Sustainability, 17(17): 8049. https://doi.org/10.3390/su17178049
[12] Jasiunas J., Lund P.D., Mikkola J. (2021). Energy system resilience – A review. Renewable and Sustainable Energy Reviews, 150: 111476. https://doi.org/10.1016/j.rser.2021.111476
[13] Ruppel R., Sanders R.E., Souissi K., Manna M. (2021). Demystifying Data with AI on IBM Z. IBM Redbooks, REDP-5633-00. http://redbooks.ibm.com/abstracts/redp5633.html.
[14] Haekal J., Mu’min R., Adriansyah A., et al. (2025). AI Ladder-based intelligent enterprise resource planning for predictive railway track maintenance from UAV imagery. Mathematical Modelling of Engineering Problems, 12(10): 3577-3592. https://doi.org/10.18280/mmep.121023
[15] Breiman L. (2001). Random forests. Machine Learning, 45: 5-32. https://doi.org/10.1023/A:1010933404324
[16] James G., Witten D., Hastie T., Tibshirani R., Taylor J. (2023). An Introduction to Statistical Learning: With Applications in Python. Springer Cham. https://doi.org/10.1007/978-3-031-38747-0
[17] Krishnamurthy S., Adewuyi O.B., Luwaca E., Ratshitanga M., Moodley P. (2024). Artificial intelligence-based forecasting models for integrated energy system management planning: An exploration of the prospects for South Africa. Energy Conversion and Management: X, 24: 100772. https://doi.org/10.1016/j.ecmx.2024.100772
[18] Thomas R., Zikopoulos P. (2020). The AI Ladder: Accelerate Your Journey to AI. O’Reilly Media.
[19] Global Reporting Initiative. (2016). GRI 301: Materials 2016. https://www.globalreporting.org/publications/documents/english/gri-301-materials-2016/.
[20] Global Reporting Initiative. (2016). GRI 302: Energy 2016. https://www.globalreporting.org/publications/documents/english/gri-302-energy-2016/.
[21] Global Reporting Initiative. (2020). GRI 306: Waste 2020. https://www.globalreporting.org/publications/documents/english/gri-306-waste-2020/.
[22] World Resources Institute, World Business Council for Sustainable Development. (2004). The greenhouse gas protocol: A corporate accounting and reporting standard. https://ghgprotocol.org/sites/default/files/standards/ghg-protocol-revised.pdf.
[23] Global Reporting Initiative. (2016). GRI 305: Emissions 2016. https://www.globalreporting.org/publications/documents/english/gri-305-emissions-2016/.
[24] World Resources Institute, World Business Council for Sustainable Department. (2011). Corporate value chain (scope 3) accounting and reporting standard. https://ghgprotocol.org/corporate-value-chain-scope-3-standard.
[25] Wilkinson M.D., Dumontier M., Aalbersberg I.J., et al. (2016). The FAIR Guiding Principles for scientific data management and stewardship. Scientific Data, 3: 160018. https://doi.org/10.1038/sdata.2016.18
[26] International Organization for Standardization. (2006). ISO 14040:2006 Environmental management (Life cycle assessment)-Principles and framework. https://www.iso.org/standard/37456.html.
[27] International Organization for Standardization. (2006). ISO 14044:2006 Environmental management (Life cycle assessment)-Requirements and guidelines. https://www.iso.org/standard/38498.html.
[28] Robnik-Sikonja M., Kononenko I. (2003). Theoretical and empirical analysis of ReliefF and RReliefF. Machine Learning, 53: 23-69. https://doi.org/10.1023/A:1025667309714
[29] Kaufman S., Rosset S., Perlich C., Stitelman O. (2012). Leakage in data mining: Formulation, detection, and avoidance. ACM Transactions on Knowledge Discovery from Data, 6(4): 1-21. https://doi.org/10.1145/2382577.2382579
[30] Hastie T., Tibshirani R., Friedman J. (2009). The Elements of Statistical Learning: Data Mining, Inference, and Prediction. 2nd ed. Springer New York, NY. https://doi.org/10.1007/978-0-387-84858-7
[31] Dumas M., La Rosa M., Mendling J., Reijers H.A. (2018). Fundamentals of Business Process Management. 2nd ed. Springer Berlin, Heidelberg. https://doi.org/10.1007/978-3-662-56509-4
[32] Tanjaya E.S., Retnowardhani A. (2025). Achieving on-Time IT project delivery in an Indonesian car manufacturer. Architecture Image Studies, 6(3): 1912-1923. https://doi.org/10.62754/ais.v6i3.540
[33] International Organization for Standardization. (2018). ISO 50001:2018 Energy management systems — Requirements with guidance for use. https://www.iso.org/standard/69426.html.