Hussain Ajeel* | Duaa Dookhi | Hala Kadhim
© 2026 The authors. This article is published by IIETA and is licensed under the CC BY 4.0 license (http://creativecommons.org/licenses/by/4.0/).
OPEN ACCESS
Traffic and transportation engineering plays a direct role in assessing the effectiveness of road networks in supporting rapid emergency response. Inadequate emergency planning and insufficient assessment of road network characteristics can lead to difficulty reaching vital locations, increased response times to hazards, and delays in the arrival of emergency services. This study aims to evaluate access to civil defense centers and hospitals, considered vital and effective locations for rescuing people. Network analysis within Geographic Information Systems (GIS) was used to evaluate the road network in Nasiriyah, relying on network data such as actual speeds, intersection delays, and traffic volumes. The analysis focused on the distance and time required to reach civil defense centers and hospitals under various conditions, including peak hours and normal commuting times. The service area for these locations was also assessed over specific time intervals (4, 8, and 10 minutes), and the optimal route to the nearest service location was analyzed. Applying the coverage distance criterion, it was found that the service area for civil defense centers was 19% of the populated area of Nasiriyah City and 17% for hospitals. Similarly, the service area according to the arrival time criterion was 7% for civil defense centers within four minutes and 63% within ten minutes; hospital coverage was 51% within ten minutes. Specific locations within and beyond the city boundaries were selected for analysis to determine the nearest service location based on arrival time. This analysis revealed that arrival times exceeded the standard, reaching 22 minutes for some areas within the city limits and 40 minutes for locations beyond the city boundaries. The research examined two proposals as alternative solutions to establishing new sites for civil defense centers and hospitals. The first proposal was to analyze the speed of vehicles, and the second was to eliminate stopping time at intersections. After applying the first scenario, it was found that the service area reached 88% in 10 minutes for civil defense centers and 72% in 10 minutes for hospitals. When applying the second scenario, the service area reached 94% in 10 minutes for civil defense centers and 87% in 10 minutes for hospitals. The time to reach the nearest civil defense center was 10 minutes from Nasiriyah Airport at a distance of 16 km, while the time to reach the nearest hospital was 16 minutes from Nasiriyah Airport at a distance of 20 km. These results can support emergency planning and help reduce response times in urban areas.
accessibility, emergency, Geographic Information Systems, network analysis, shortest path, service area, Nasiriyah
Cities face many crises resulting from natural and man-made incidents, fires, epidemics, and others, as the resilience and safety of cities depend on the rapid access to critical sites in such circumstances [1]. Rapid response helps prevent accidents and save lives, the longer the response time the greater the risk to lives and property of individuals [2]. One of the most important sites during crises are civil defense centers and hospitals [3]. Therefore, the optimal distribution of these paramount sites contributes to reducing response time and thus to effective response to incidents [4]. The occurrence of any incident affects decision-makers in taking appropriate actions, such as adopting alternative routes or redistributing critical locations during crises to suit rapid response and recovery [5]. Crisis preparedness is not limited to the fair distribution of influential sites; it also requires the preparation of specialized and trained personnel to respond to any emergency and handle critical situations decisively and swiftly [6]. Many studies have confirmed the importance of easy access to critical sites through various scenarios by altering routes or establishing new crossings, in addition to selecting the optimal location for these sites [7]. For example, in city centers, there are many alternative routes, and even with high population densities, they provide easier access due to the abundance of these alternative paths, unlike remote areas that lack this advantage [8]. Therefore, comprehensive strategies need to be implemented to ensure that urban infrastructure is prepared to face urgent urban challenges and crises, providing a safe and cohesive environment [9].
One of the most important technologies used in assessing accessibility is Geographic Information Systems (GIS), as they provide an effective solution for providing solutions, plans, and strategies to address emergencies and crises [10]. GIS maps also support selecting the optimal locations for distributing civil defense centers and health centers, regardless of growing population densities and urban challenges [11].
The concept of accessibility revolves around the principle of distance and time; the greater the distance, the greater obstacles there are. Accordingly, accessibility diminishes, especially in critical situations that require the shortest possible travel time [12]. Therefore, the main concern for urban planners has been the distribution of civil defense centers and health centers in a way that guarantees prompt access. This poses a significant challenge in overcoming obstacles on the roads, such as intersections and roundabouts that increase the distance traveled, in addition to the conditions of the transportation network during peak times and crisis situations [13]. From the above, the ease of access can be explained by relying on the factors of time and place. The place may be at a specific level in a definite location or at a comprehensive level, and it may cause a disruption in the road network that affects the rescuing individuals or their relocation to secure areas [14]. As for time, a quick response reduces the chances of danger spreading or of increasing confusion in the network, in addition to saving more people [15]. From the perspective of civil engineering, this type of study represents an advanced application of urban infrastructure management concepts, combining road planning, vehicle movement analysis, and performance evaluation of transport networks under normal and emergency conditions. This can contribute to supporting planning decisions related to the construction of new roads, improving intersections, or redistributing service centers, thereby enhancing response efficiency and reducing response time [16].
Many studies have addressed the importance of easy access, how to deal with crises, and methods for analyzing the distribution of critical sites during hazards. In 2013, Imani Alvecheh et al. [17] conducted a study analyzing the impact of earthquakes on District 10 of Tehran, located on the fault line, by examining various factors including spatial structure, building age, and population density using GIS, and the study highlighted the necessity of redistributing open areas and civil defense centers to ensure the highest level of access. Meanwhile, Nicoară and Haidu [18] presented an analysis of the shortest path from the accident site to the hospital and to the police stations, using network analysis technology in GIS. Alyasiri et al. [19] emphasized the importance of providing integrated data on roads and sensitive locations in accidents, such as hospitals and civil defense centers. The study used GIS to investigate the distribution of these sites based on each site's service area. Satchet et al. [20] also analyzed the efficiency of the distribution of civil defense centers in the city of Nasiriyah by studying the coverage area of each civil defense center and using calculations to assess access within 4 minutes, they confirmed the necessity of redistributing these centers in the city as they are randomly distributed. Other studies in this regard have also been reviewed as summarized in Table 1.
Table 1. Summary of studies addressing access assessment during crises
|
Study |
Year |
Study Area |
Type of Crisis |
The Technology Used |
Type of Analysis |
Outcomes |
|
Saindane [21] |
2019 |
PUNE – India |
Unspecified |
GIS |
The shortest path analysis |
Establish new fire stations in addition to deploying fire trucks more widely in the city surroundings. |
|
Bashir et al. [22] |
2021 |
Al-Riyadh - KSA |
Unspecified |
GIS |
Weighted Sum Model (WSM) and Analytic Hierarchy Process (AHP) |
Hierarchical Analysis Process (AHP) models are better than the Weighted Sum Model (WSM). The necessity of establishing additional civil defense centers. |
|
Zhang et al. [23] |
2022 |
Jiaozuo - China |
Floods |
GIS |
Arrival time every 5 – 10 – 15 minutes |
Repeated floods caused a weakness in the access of relief teams. Rescue teams were unable to reach within 15 minutes. |
|
Estelaji et al. [24] |
2022 |
A part of the city of Tehran |
Natural disasters |
GIS |
Arrival time every 5 – 10 – 15 minutes |
Adopting Dijkstra algorithm to find the best route. Establishing new service centers. |
|
Yunus et al. [25] |
2023 |
Kano - Nigeria |
Fire incidents |
GIS |
Service area for fire stations within 4 minutes |
Providing emergency response services takes more than 4-8 times the specified travel criteria. Establish additional fire stations. |
|
Liu et al. [26] |
2025 |
Beijing’s Old City |
Medical conditions of the elderly |
GIS |
Hospital coverage area within 15 minutes |
Peripheral areas are better in accessibility but suffer from a lack of services. Central areas have difficulty in accessibility but provide services more efficiently. |
|
Zhu et al. [27] |
2025 |
Xuhui - Shanghai |
Fire incidents |
GIS |
The shortest path using network analysis |
Spatial inequality and variations in the flexibility of road networks surrounding fire and rescue systems. Access efficiency is influenced by road network density and travel time reliability. |
|
Pratiwi and Noviani [28] |
2026 |
Surakarta City |
Fire incidents |
GIS |
Service area for fire stations within 2500 m |
The existence of spatial differences in the distribution of firefighting services. Redistributing these services accurately based on the necessary data. |
The studies that were investigated dealt with the importance of easy access to sites affected by crises through analyzing the travel time from the incident location to relief sites, whether hospitals or civil defense, as well as analyzing the shortest path between these sites. The availability of suitable traffic routes, short travel times, and easy mobility throughout the urban network are essential for the effectiveness of any emergency response. For this reason, the study of spatial and temporal accessibility is a fundamental tool for assessing the effectiveness of urban transport infrastructure. The current study aimed to assess both the coverage area and to analyze the shortest path. The evaluation was conducted in different scenarios based on road network data. Different factors were taken into consideration such as peak hours, normal traffic conditions, critical situations, and obstacles that may arise on the network during emergencies. In addition, improvements were made to network features to assess access to emergency services.
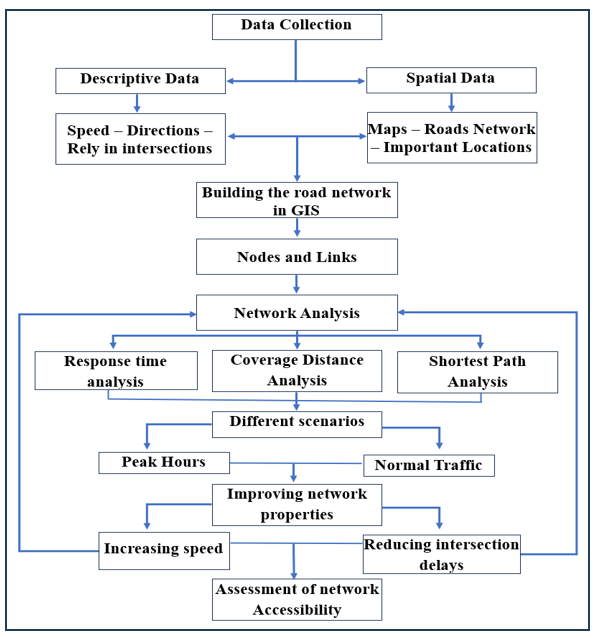
The study relied on the network analysis technique for roads in GIS, based on real data for the city of Nasiriyah in southern Iraq. It also simulated crisis scenarios at different times according to data from the road and street network. The research framework consists of the following stages: a) Collecting the data from the city maps using the information of the Municipality Directorate in the city; b) Inputting the information into the GIS program for analysis using ESRI maps; c) Collecting data on locations affected during times of danger, including civil defense centers and hospitals, by means of field visits and official departments; d) Collecting road network data such as traffic volume and vehicle speeds at different times, including peak hours on regular working days and holidays, through direct field surveys; e) Building the road network in GIS by defining nodes and links and entering actual data for each link, intersections, delay times, and turns; f) Adding influential locations as service sites, such as civil defense centers and hospitals; g) Conducting network analysis by defining service areas for different time intervals (4, 8 and 10 minutes), determining the shortest paths from influential locations and proposed accident sites, and reanalyzing under various scenarios [29] ; h) Analysis according to the proposal to increase speed and eliminate delay time at intersections.
The main analysis steps carried out in this study can be explained in the flow chart as shown in Figure 1.
Figure 1. Flowchart of the study methodology
2.1 Study area
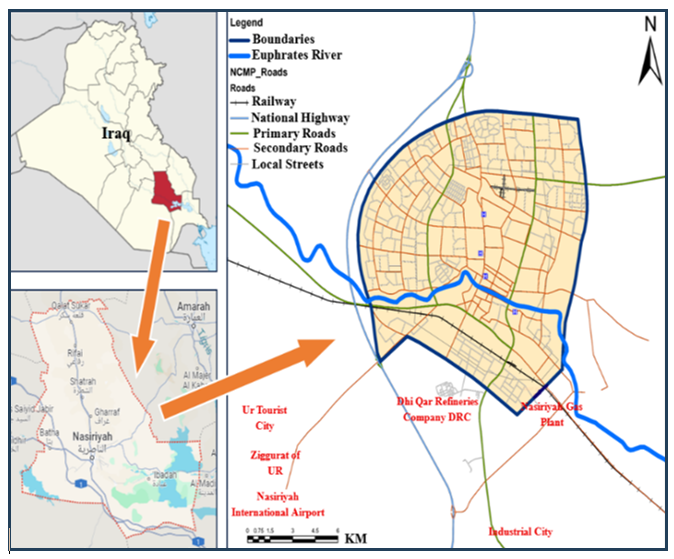
Nasiriyah City is regarded as one of the most important Iraqi cities. It is the fourth largest city in terms of population and it is located near the ruins of the ancient city of Ur, in addition to having important oil refineries. Nasiriyah City is the center of Thi-Qar Governorate and it is located 360 km south of the capital, Baghdad. Recently, the number of vehicles on the streets has grown, streets are increasingly affected by traffic congestion, especially during peak hours. Figure 2 shows the location of Nasiriyah City in relation to Iraq. The total master plan area of Nasiriyah City is 188 km², including the populated areas and future expansion areas. The populated area of this plan is 140 km², according to the data of the Municipality Directorate of Nasiriyah and the city maps in GIS. Therefore, the analysis will be conducted on the built-up area of the city.
Figure 2. The location of Nasiriyah City in relation to Iraq
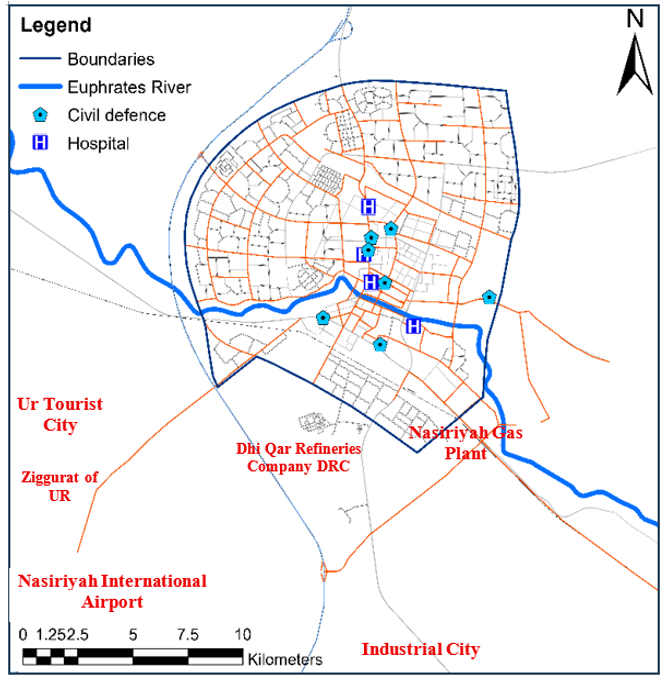
Figure 3 illustrates the road network in the city of Nasiriyah as well as important sites, such as civil defense centers and hospitals. The figure also shows the location of the archaeological area of the Ziggurat, the Tourist city, Nasiriyah International Airport, the Industrial city, and the Nasiriyah refinery. These areas are regarded as among of the most important sites in the city due to the historical, cultural, civilizational, and industrial aspects they reflect. Therefore, it is necessary to protect them and prevent any danger that may affect these sites, and to intervene quickly in case of any emergency.
Figure 3. The road and street network in the city of Nasiriyah and its most important sites
2.2 Data collection
The network analysis tool in GIS is among the most crucial tools for spatial analysis that deal with road network data in cities. Initially, the road and street network are drawn, which consists of roads and nodes; the previously mentioned descriptive data were entered to build the transportation network in an integrated manner [29]. The field survey started on 6/4/2026 and continued until 29/4/2026, covering 779 links, 598 nodes, 28 intersections, and 94 turning points. Regarding vehicle speed, the average speed of vehicles on a road connecting two nodes was recorded using the vehicle's speedometer. On some roads with high traffic volumes, traffic volume was observed by counting the number of vehicles passing a single point within 15 minutes, then converting it into traffic volume in units of (vehicles/hour) and inputting it into the network analysis as a road impedance. Additionally, stop time at intersections was calculated by observing how long vehicles stayed stopped in each direction and then entering the average stop time for each intersection as a time cost in the network analysis. The rest of the link details, such as link length and travel time based on vehicle speed and link length, were automatically calculated in the GIS software. Table 2 shows a sample of the nodes, links, and intersections in the city of Nasiriyah and the main quantitative characteristics that were measured.
Table 2. Sample of nodes and links with quantitative attributes measured in the field
|
Link |
Observed Speed (Km/H) |
Length (Km) |
Time (Min) |
Traffic Volume (Veh/h) |
Intersection (Node) |
Delay Time (Sec) |
|
L1 |
44 |
0.930 |
1.27 |
1962 |
I1 |
45 |
|
L2 |
50 |
1.680 |
2.02 |
1844 |
I2 |
74 |
|
L3 |
65 |
1.830 |
1.69 |
1493 |
I3 |
125 |
|
L4 |
70 |
2.450 |
2.1 |
1281 |
I4 |
173 |
|
L5 |
83 |
3.820 |
2.76 |
945 |
I5 |
92 |
There is a lack of recorded data regarding emergency responses to incidents in the city of Nasiriyah, as there are no dedicated crisis and critical incident management centers; instead, reliance is placed on urgent plans that often prove insufficient for effective response. Consequently, the network was evaluated using field-recorded data encompassing speeds, intersections, and turning points that collected under various conditions throughout the survey period.
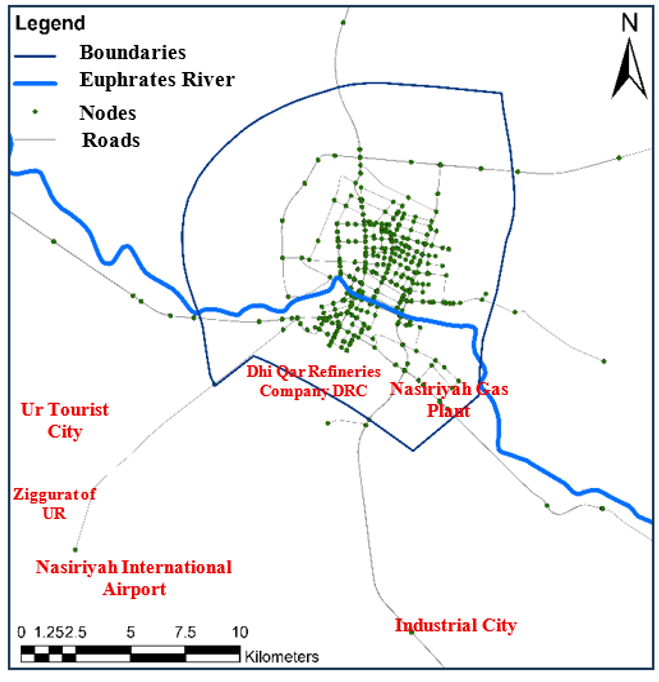
Figure 4. The roads and nodes within the road network in Nasiriyah City
The locations of civil defense centers and hospitals in the city were identified based on a data obtained from the respective departments. Accordingly, the transportation network was built in the GIS program using network analysis techniques based on the actual street data. Figure 4 shows the nodes and links in Nasiriyah City, which were created in the (GIS) using network analysis technology.
There are two major portions of the data analysis: the first portion is concerned with the civil defense centers, while the second one concerns the hospitals. In each section, both the coverage area and the nearest route are analyzed based on time and distance according to local and international standards adopted for each service site using network analysis in GIS version 10.7.1. A distance of 1200 meters was adopted as the reach distance for civil defense centers and 2000 meters as the reach distance for hospitals in accordance with the accepted local requirements in Iraq [30, 31]. Time intervals for access have been approved, consisting of 4, 8 and 10 minutes for the service area of both civil defense centers and hospitals. These periods were chosen for this study because the 4-minute time is the ideal response time used in most countries, the 8-minute time is considered appropriate and is also practiced in many countries, and the 10-minute time was examined for comparison with locations outside of the city boundaries [32, 33].
3.1 Analysis of service area according to the coverage distance standard
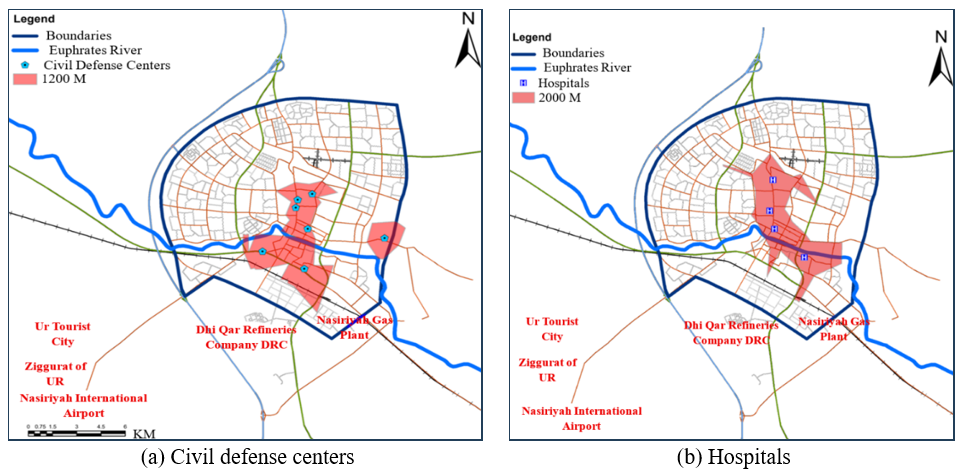
It is known that the distribution of land uses is done according to the radius of the coverage area, which is drawn as a circle with a radius equal to half the distribution standard of that use. However. The distance a vehicle travels from the location of the use is what was adopted in this study based on the specified distance in the approved urban planning standards. Accordingly, Figure 5 shows the coverage area of the four hospitals in the city according to the 2000-meter distance standard, as well as the civil defense centers for a coverage distance of 1200 meters using network analysis techniques in GIS. In Figure 5(a), the civil defense centers cover 19% of the city's built-up area, while the hospitals cover 17% of the city's built-up area, as shown in Figure 5(b). This service area for all sites clearly indicates limited access to most of the city locations.
Figure 5. Service area according to the coverage distance standard. (a) Civil defense (b) Hospitals
3.2 Service area analysis according to the response time standard
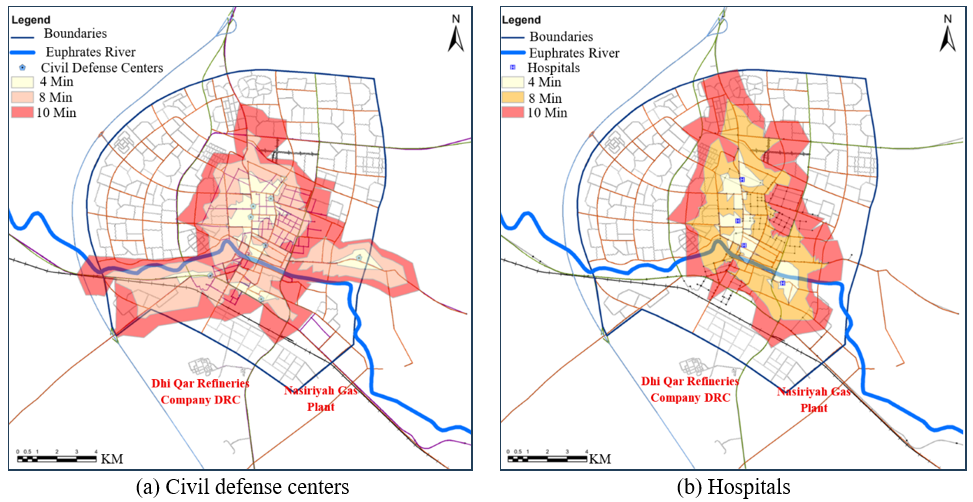
In this section, the analysis was conducted according to the response time. It is the specific time period within which the service or emergency entity must arrive at the scene of the incident after receiving the report. In the context of civil defense or ambulance services, it usually refers to the time between receiving the call and the team's arrival at the site, and it is used to measure service efficiency and the level of spatial coverage. It is often expressed in minutes, such as 6 minutes or 8 minutes, depending on the agency or the adopted standard [33]. The road network data were analyzed in two cases: the first case was under normal traffic, and the second case was during peak hours on the road network. In each case, three response time ranges were analyzed: 4, 8, and 10 minutes.
3.2.1 Analysis in normal traffic
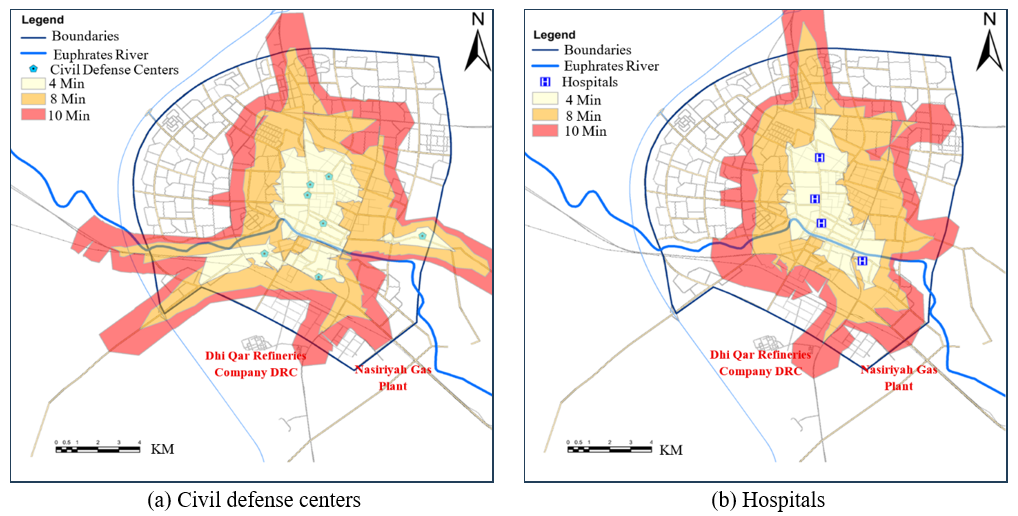
Traffic volume, which is typically stated as vehicles per hour or vehicles per day, is the number of vehicles that pass a specific point or section of roadway over a specific period. Figure 6 displays the response ranges within the investigated periods under normal traffic conditions. As shown in Figure 6(a), the civil defense centers cover 7%, 34% and 63% of the built-up city area within 4,8 and 10 minutes, respectively. Meanwhile, the coverage area of hospitals was reached 5%, 26% and 51% of the built-up city area within 4, 8 and 10 minutes, as shown in Figure 6(b). This indicates that approximately half of the studied area is located in underserved areas, which results in a longer response time and consequently exposes people's lives to greater danger.
Figure 6. Service area analysis for 4-8-10 minute periods in normal traffic. (a) Civil defense (b) Hospitals
3.2.2 Analysis during peak hours
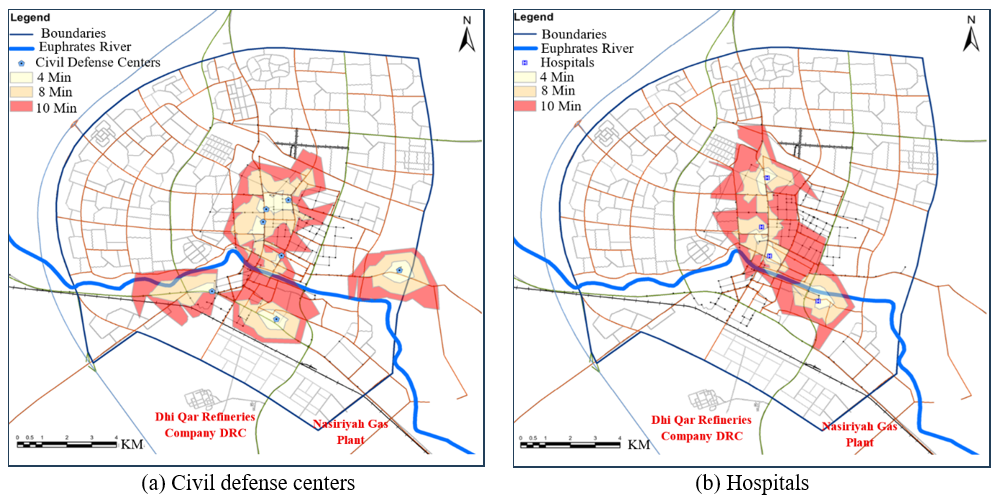
The analysis was carried out according to the response time during peak hours. The service areas were smaller than in normal traffic, as shown in Figure 7. Civil defense centers cover 4%, 19%, and 39% of the built-up city area in 4, 8, and 10 minutes respectively as seen in Figure 7(a). Meanwhile, the service area of hospitals reached 2%, 12%, and 26% of the built-up area in 4, 8, and 10 minutes respectively as shown in Figure 7(b). It is obvious that underserved areas during peak hours are larger than they are in normal traffic conditions, resulting in increased response times to accidents, fires, and injuries, which may increase human losses.
Figure 7. Service area analysis for 4-8-10 minute periods in peak hours. (a) Civil defense (b) Hospitals
3.3 Shortest path analysis
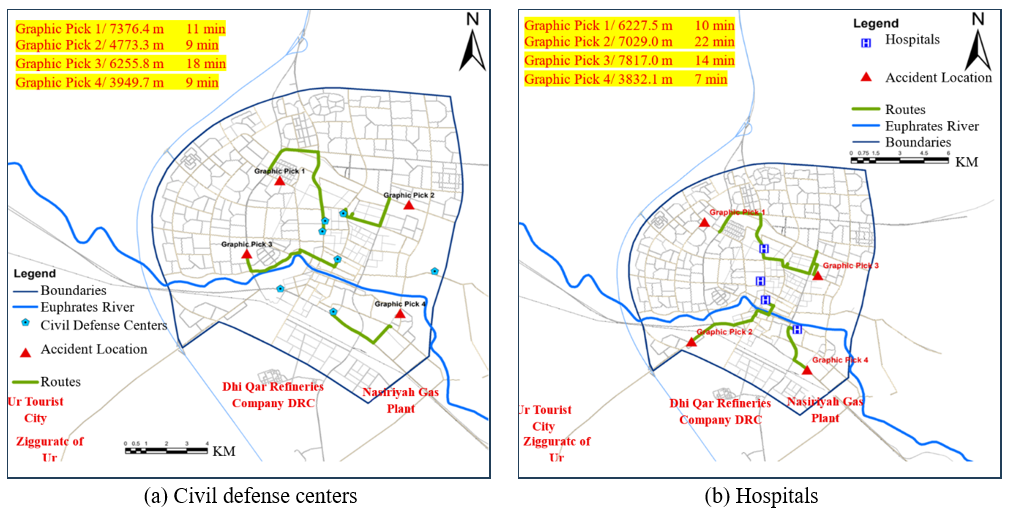
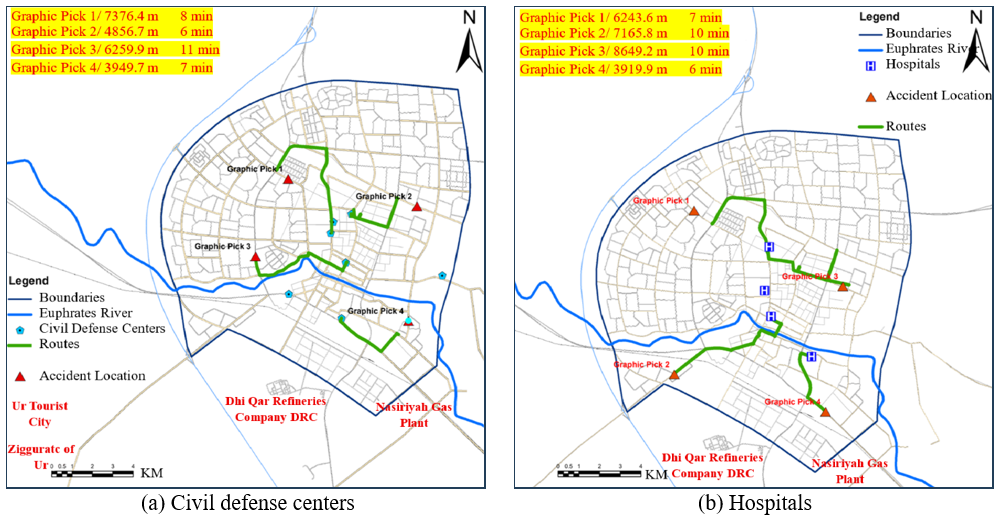
In the previous analysis, the principle of coverage and access from the desired service location to what is to be covered was adopted according to the coverage distance and access time criteria. However, in the shortest path analysis, access from the incident site to the service location was adopted. Several scenarios will be proposed to choose important locations in the city, such as the industrial city or the historical city. The shortest path was analyzed according to road network data under normal conditions. Figure 8 shows the determination of routes from the proposed locations within the boundaries of Nasiriyah City with the analysis of the optimal route for civil defense centers and hospitals under road network conditions. As shown in Figure 8(a) the average distance traveled was between 4-7 km with an arrival time between 9-18 minutes. Figure 8(b) displays the average distance traveled that was between 4-8 km. The arrival time ranging from 7 to 22 minutes, is considered relatively long when compared with the standard time adopted in most countries, which is about 4 minutes.
Figure 8. Analysis of the shortest path for proposed locations within the city. (a) Civil defense (b) Hospitals
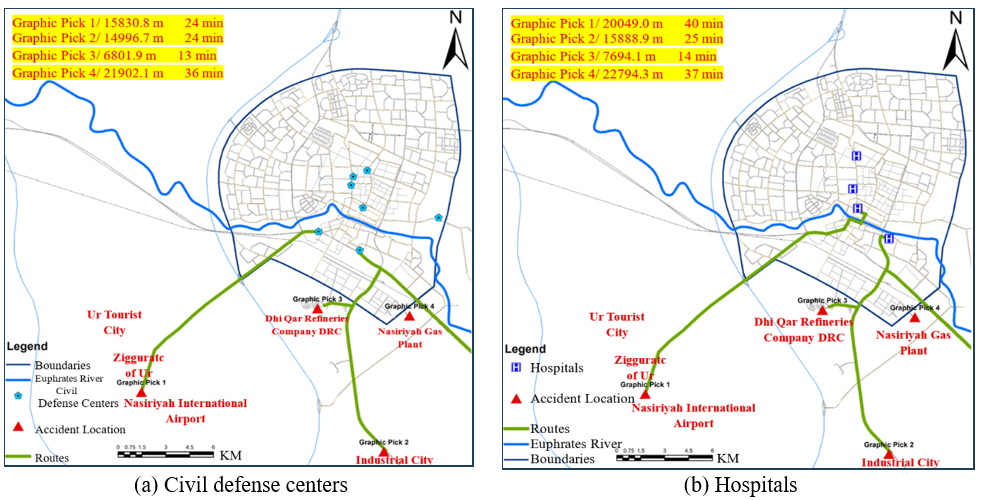
Figure 9. Analysis of the shortest path for proposed locations outside the city boundaries. (a) Civil defense (b) Hospitals
Figure 9 depicts the selection of routes from the important locations outside of the city limits, such as Nasiriyah International Airport, the archaeological city, the industrial city, Nasiriyah Refineries Company, and the Nasiriyah Gas Plant, as well as the analysis of the best route for civil defense centers and hospitals given road network conditions. Figure 9(a) illustrates that the average distance traveled was between 7-22 km, with arrival times ranging from 13 to 36 minutes. Figure 9(b) shows that the average distance traveled was 7-23 km with an arrival time of 14-40 minutes. This is a considerably long period of time, assuming an arrival time of 10 minutes for areas outside city boundaries.
Numerous studies have examined the optimal distribution of civil defense centers and hospitals during crises. They concluded that these places must be relocated or new sites must be established to ensure rapid access and expanded coverage.
In this section, the distribution of these facilities will be assessed after making changes to vehicle characteristics on roads without changing the locations of these facilities or adding new ones. It is obvious that the travel time to the appropriate location is affected by two main factors: the vehicle speed on the road and the delay time at intersections [34]. It is possible to rely on intelligent transportation systems and monitoring of roads to facilitate the smooth passage of relief and emergency vehicles without entering congested areas and experiencing delays at intersections, in other words, creating an emergency lane during crises to reduce travel time [35]. Therefore, two main proposals were studied: the first was to increase speed, and the second was to reduce stopping time at intersections.
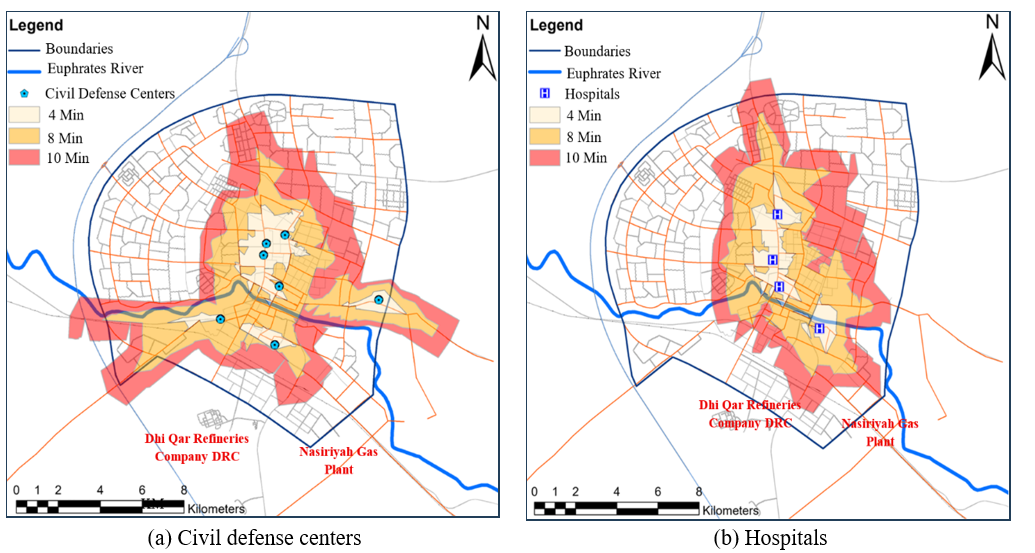
Many studies have examined the impact of speed variations on optimal travel time and service area expansion; for instance, a study by Hierink et al. [36] addressed speed adjustments involving a 20% increase or decrease. Observations of traffic speeds in the city of Nasiriyah revealed that most roads operate within the 30–60 km/h range, so a speed increase rate was adopted with three scenarios: 10%, 20%, and 30% to measure the impact on the service area of civil defense centers and hospitals in Nasiriyah. A second proposal focused on reducing intersection delay times, again through one scenario, the complete elimination of delay. Figure 10 depicts the service area after increasing the speed by 10% for the first scenario, as it was found that civil defense centers cover 8% in 4 minutes, 37% in 8 minutes, and 72% in 10 minutes, of the built-up area of the city, as shown in Figure 10(a). Meanwhile, the coverage area of hospitals reached 6% in 4 minutes, 30% in 8 minutes, and 58% in 10 minutes of the built-up area of the city as shown in Figure 10(b). It is clear that the increase in speed has made the service more efficient and more comprehensive, especially for emergency services.
Figure 10. Service area analysis for 4-8-10 minute periods after increasing the speed by 10%. (a) Civil defense (b) Hospitals
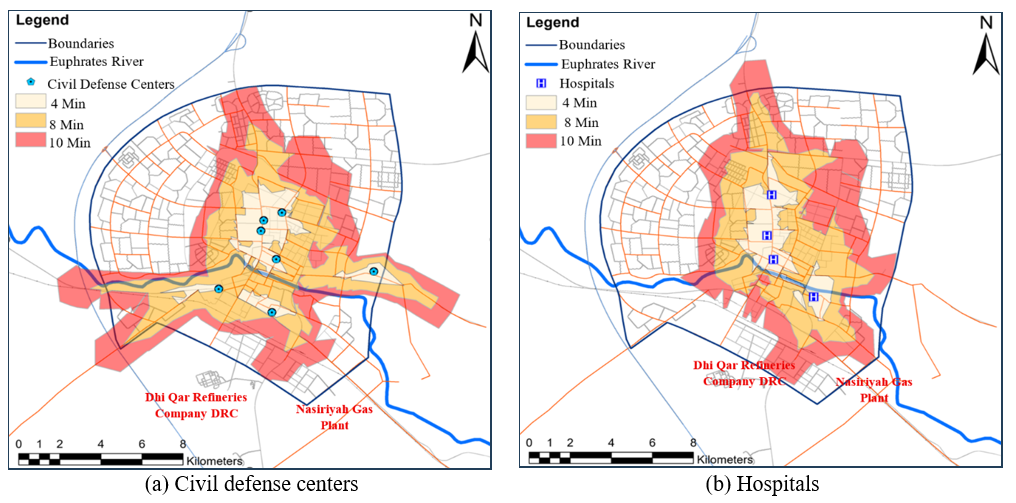
Figure 11 shows the service area after increasing the speed by 20%. It shows that the service area for civil defense centers reached 10% in 4 minutes, 43% in 8 minutes, and 81% in 10 minutes, as shown in Figure 11(a). Meanwhile, the service area for hospitals reached 9%, 36%, and 68% in 4, 8, and 10 minutes, respectively, of the built-up city area, as shown in Figure 11(b).
Figure 11. Service area analysis for 4-8-10 minute periods after increasing the speed by 20%. (a) Civil defense (b) Hospitals
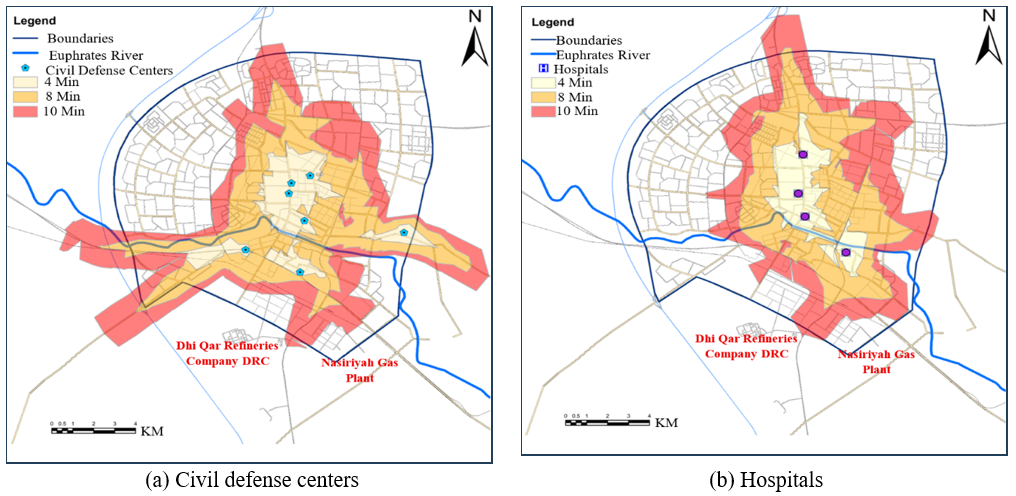
Figure 12. Service area analysis for 4-8-10 minute periods after increasing the speed by 30%. (a) Civil defense (b) Hospitals
In the last scenario of the proposed speed increase, after increasing the speed by 30%, it turned out that the service area for civil defense centers reached 12% in 4 minutes, 47% in 8 minutes, and 88% in 10 minutes, as shown in Figure 12(a). Meanwhile, the service area for hospitals reached 10%, 40%, and 72% in 4, 8, and 10 minutes respectively, of the built-up city area, as shown in Figure 12(b).
Figure 13. Service area analysis for 4-8-10 minute periods after applying the two scenarios. (a) Civil defense (b) Hospitals
The second proposal is to eliminate stop time at intersections, and the analysis at this stage was done alongside a 30% increase in speed. Figure 13 illustrates the service area after eliminating the delay time at intersections. Figure 13(a) clarifies the service area percentages for civil defense centers with 19%, 57%, and 94% of the built-up city area in 4, 8, and 10 minutes respectively. Meanwhile, hospital coverage reached 15% in 4 minutes, 50% in 8 minutes, and 87% in 10 minutes of the built-up city area, as shown in Figure 13(b). This confirms the impact of canceling delay times at intersections in enabling civil defense centers and hospitals to respond quickly and serve broader regions of the city, because traffic congestion within the network is the most vital factor that was limiting coverage.
In the shortest path analysis, applying the same scenarios to the previously selected sites within the city boundaries, the travel time decreased significantly, from 9-18 minutes to 6-11 minutes for the nearest civil defense center. Likewise, for hospitals, the time decreased from 7–22 minutes to 6–10 minutes, as shown in Figure 14. More precisely, applying these scenarios to the selected sites made them functionally closer to the residents within the traffic network. This confirms that improving traffic flow significantly enhances the efficiency of emergency services.
Figure 14. Analysis of the shortest path after increasing speed and canceling delay time for proposed locations within the city. (a) Civil defense (b) Hospitals
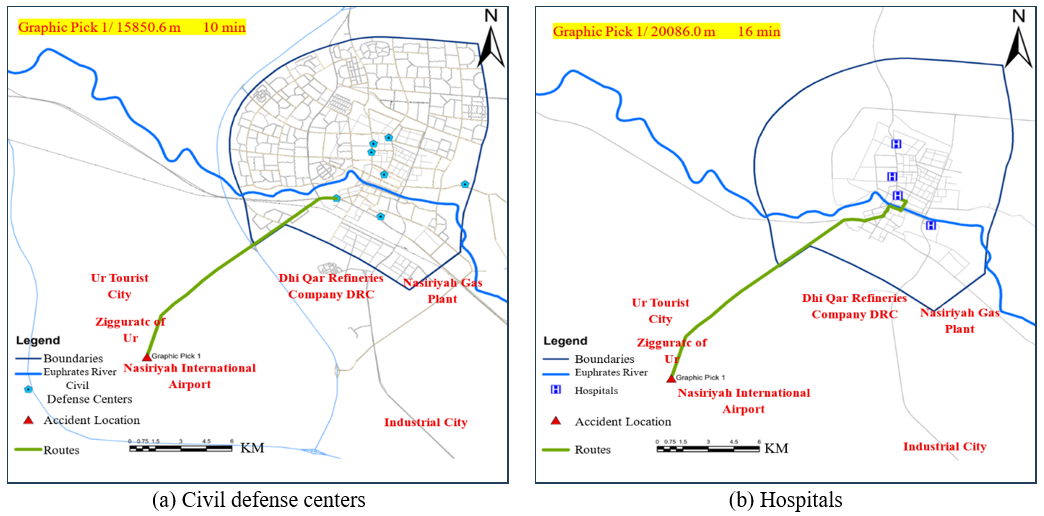
The site of Nasiriyah International Airport was also chosen as an out-of-city location to apply the proposed scenarios, as shown in Figure 15. From Figure 15(a), it can be seen that the distance traveled from Nasiriyah Airport to the nearest civil defense center was approximately 16 km, with an estimated travel time of 10 minutes, while the distance traveled from Nasiriyah Airport to the nearest hospital was approximately 20 km, with an estimated travel time of 16 minutes, as shown in Figure 15(b). In comparison with normal conditions, the travel time to the nearest civil defense center was 24 minutes, whereas the travel time to the nearest hospital was 40 minutes; this implies that the efficiency of emergency services does not depend only on the geographical location, but also on the quality of network connectivity and the speed of road access. Therefore, when traffic improves, the ability of civil defense teams and hospitals to respond quickly also improves, which directly reduces emergency response time and enhances service quality.
Figure 15. Analysis of the shortest path for proposed location outside the city boundaries after increasing speed and canceling delay time. (a) Civil defense (b) Hospital
The process of distributing land uses in cities relies on the principle of coverage area based on the radius of the coverage circle. However, this distribution is often ineffective because road network conditions are rarely straight; reaching a particular location may require travelling in the opposite direction to access the road leading to that point, passing through multiple turns and intersections that increase travel time. Accordingly, the study discussed the network analysis process that depends on road network conditions such as actual driving speed, intersections, roundabouts, and delay time. After conducting the network analysis, the following notes were observed:
•A network analysis of the road network in Nasiriyah revealed that most areas of the city are underserved, based on service area and travel time. Furthermore, most of the city's key sites lie outside the boundaries of the master plan, including the Industrial City, the Nasiriyah Gas Plant, the archaeological site, the Ziggurat of Ur, and Nasiriyah International Airport.
•Response time is affected by the circumstances of the road network. In congested conditions, civil defense centers had a coverage rate of 39% within 10 minutes. Meanwhile, hospitals had a coverage of 26% within 10 minutes. This implies that response time is influenced by transportation network conditions, making rescue difficult in such situations.
•In the analysis of the shortest path, it was found that the time and path determined when analyzing locations within the city boundaries exceeded 10 minutes and reached 40 minutes for locations outside the city, specifically Nasiriyah International Airport. This highlights the significant deficiency in rapid access to emergency sites and thus in saving people lives and property.
This research explored two road network improvements to assess their impact on achieving greater coverage. Increasing vehicle speed and eliminating delay time at intersections. Implementing these two proposals requires only the integration of road data, decision-makers, and vehicle traffic. These scenarios rely on directing drivers to alternative routes or opening lanes for emergency vehicles, particularly at intersections. When implementing these improvements. The findings are summarized as follows:
•The service area within 4 minutes increased significantly. Within 10 minutes it now covers a considerable portion of the city, reaching 94% coverage for civil defense centers and 87% for hospitals.
•Analysis of the shortest path showed that travel time from Nasiriyah International Airport to the nearest civil defense center decreased from 24 minutes in normal conditions to 10 minutes and from 40 minutes under normal conditions to 16 minutes for the nearest hospital. This confirms the impact of road and street network conditions, such as traffic volume, travel times, speed, and turning points, on travel time and, consequently, on better coverage of critical locations during crises.
Furthermore, increasing the number of civil defense centers and hospitals will also positively impact travel time and service area for these locations. However, this requires substantial funds for the construction of dedicated buildings and additional personnel, in addition to the time required to build such facilities.
The authors would like to thank Engineer Abbas Gharqan from the Nasiriyah Municipality Directorate and Engineer Ali Khalif from the Civil Defense Directorate in Nasiriyah City for their assistance and providing us with valuable data.
[1] Gangwal, U., Siders, A.R., Horney, J., Michael, H.A., Dong, S.J. (2023). Critical facility accessibility and road criticality assessment considering flood-induced partial failure. Sustainable and Resilient Infrastructure, 8(sup1): 337-355. https://doi.org/10.1080/23789689.2022.2149184
[2] Alshebani, M.M., Alanazi, M.Q., Alanazi, A.E., et al. (2025). Response time in emergency services: A narrative review. TPM–Testing, Psychometrics, Methodology in Applied Psychology, 32(S9): 2047-2056. https://tpmap.org/submission/index.php/tpm/article/view/3635.
[3] Rezvani, S.M.H.S., Silva, M.J.F., de Almeida, N.M. (2024). Urban resilience index for critical infrastructure: A scenario-based approach to disaster risk reduction in road networks. Sustainability, 16(10): 4143. https://doi.org/10.3390/su16104143
[4] van Wee, B. (2022). Accessibility and equity: A conceptual framework and research agenda. Journal of Transport Geography, 104: 103421. https://doi.org/10.1016/j.jtrangeo.2022.103421
[5] Zhang, W.H., Cheng, W.Y., Gai, W.M. (2022). Hazardous chemicals road transportation accidents and the corresponding evacuation events from 2012 to 2020 in China: A review. International Journal of Environmental Research and Public Health, 19(22): 15182. https://doi.org/10.3390/ijerph192215182
[6] Calafiore, A., Dunning, R., Nurse, A., Singleton, A. (2022). The 20-minute city: An equity analysis of Liverpool City Region. Transportation Research Part D: Transport and Environment, 102: 103111. https://doi.org/10.1016/j.trd.2021.103111
[7] Liu, C.F., Mostafavi, A. (2023). An equitable patient reallocation optimization and temporary facility placement model for maximizing critical care system resilience in disasters. Healthcare Analytics, 4: 100268. https://doi.org/10.1016/j.health.2023.100268
[8] Tsai, M.T., Chang, H.W. (2023). Contribution of accessibility to urban resilience and evacuation planning using spatial analysis. International Journal of Environmental Research and Public Health, 20(4): 2913. https://doi.org/10.3390/ijerph20042913
[9] Rezvani, S.M., Falcão, M.J., Komljenovic, D., de Almeida, N.M. (2023). A systematic literature review on urban resilience enabled with asset and disaster risk management approaches and GIS-based decision support tools. Applied Sciences, 13(4): 2223. https://doi.org/10.3390/app13042223
[10] Pozo, A.M.M., Priesmeier, P., Fekete, A. (2025). Measuring spatial accessibility to critical infrastructure: The Access Road Identification model. International Journal of Critical Infrastructure Protection, 49: 100760. https://doi.org/10.1016/j.ijcip.2025.100760
[11] Zhao, X.T., Hu, L.W., Wang, X.Z., Wu, J.B. (2022). Study on identification and prevention of traffic congestion zones considering resilience-vulnerability of urban transportation systems. Sustainability, 14(24): 16907. https://doi.org/10.3390/su142416907
[12] Ferreira, M.A., Oliveira, C.S., Francisco, R. (2025). Tsunami risk mitigation: The role of evacuation routes, preparedness and urban planning. Natural Hazards, 121: 6719-6751. https://doi.org/10.1007/s11069-024-07061-7
[13] Pouryarmohammadi, M., Ahmadi, H., Salaripour, A. (2022). Developing physical resilience strategies in passive defense according to identification of endangered areas of urban environments (Case study: Ahvaz city). International Journal of Disaster Resilience in the Built Environment, 13(1): 14-30. https://doi.org/10.1108/IJDRBE-08-2020-0086
[14] Tariverdi, M., Nunez-Del-Prado, M., Leonova, N., Rentschler, J. (2023). Measuring accessibility to public services and infrastructure criticality for disasters risk management. Scientific Reports, 13: 1569. https://doi.org/10.1038/s41598-023-28460-z
[15] Yu, W.H., Huang, Y.Y., Chen, Y.J., Xia, Z.L. (2022). Accessibility analysis of urban fire stations within communities: A fine-scale perspective. Journal of Geographical Systems, 24: 611-640. https://doi.org/10.1007/s10109-022-00381-x
[16] Mansourihanis, O., Wang, X.T., Tayarani, M., Tilaki, M.J.M., Gao, H.O., Zaroujtaghi, A. (2025). Equity in crisis response: A spatial analysis of emergency relief disparities. Cities, 165: 106128. https://doi.org/10.1016/j.cities.2025.106128
[17] Imani Alvecheh, H., Zarabadi, Z.S.S., Aghamahdi Sarraf, H. (2013). Integrating civil defense emergency management of cities. International Journal of Architecture and Urban Development, 3(2): 75-86.
[18] Nicoară, P.S., Haidu, I. (2014). A GIS based network analysis for the identification of shortest route access to emergency medical facilities. Geographia Technica, 9(2): 60-67. https://hal.univ-lorraine.fr/hal-02488179v1/document.
[19] Alyasiri, E.A.M., Hamza, A.M.A., Kadhim, A.A. (2023). Geospatial analysis of emergency services of the city of hillah using geographic information systems (GIS). IOP Conference Series: Earth and Environmental Science, 1202: 012014. https://doi.org/10.1088/1755-1315/1202/1/012014
[20] Satchet, M.S., Muhammad-Ali, A.H., Khalaf, Y.H., Jaber, A.S., Wanas, S.K. (2018). Assessment and development of the spatial coverage of fire service in Nasiriyah City by using Geographic Information Systems (GIS). International Journal of Civil Engineering and Technology, 9(7): 936-947.
[21] Saindane, A.D. (2019). Network analysis using GIS and remote sensing for emergency response system of Pune City. International Journal of Civil Engineering and Technology, 14(4): 18-25. https://doi.org/10.21172/1.144.05
[22] Bashir, B., Alsalman, A., Othman, A.A., Obaid, A.K., Bashir, H. (2021). New approach to selecting civil defense centers in Al-Riyadh city (KSA) based on multi-criteria decision analysis and GIS. Land, 10(11): 1108. https://doi.org/10.3390/land10111108
[23] Zhang, Y.L., Li, X., Kong, N., Zhou, M., Zhou, X.B. (2022). Spatial accessibility assessment of emergency response of urban public services in the context of pluvial flooding scenarios: The case of Jiaozuo urban area, China. Sustainability, 14(24): 16332. https://doi.org/10.3390/su142416332
[24] Estelaji, F., Naseri, A., Zahedi, R. (2022). Evaluation of the performance of vital services in urban crisis management. Advances in Environmental and Engineering Research, 3(4): 16. https://doi.org/10.21926/aeer.2204057
[25] Yunus, S., Falola, J.A., Jaro, I.M. (2023). Emergency response demand and supply: A GIS-based network analysis for fire station's service coverage delineation in Kano Metropolis, Nigeria. Geosfera Indonesia, 8(1): 61. https://doi.org/10.19184/geosi.v8i1.36694
[26] Liu, Z., Zhang, E.J., Pan, S., Li, S.C., Long, Y., Witlox, F. (2025). Assessing urban emergency medical services accessibility for older adults considering ambulance trafficability using a deep learning approach. Sustainable Cities and Society, 132: 106804. https://doi.org/10.1016/j.scs.2025.106804
[27] Zhu, J.J., Xu, X.D., Yang, X. (2025). Spatial accessibility measurement of urban fire stations considering multi-path characteristic of road networks. Journal of Transport Geography, 126: 104248. https://doi.org/10.1016/j.jtrangeo.2025.104248
[28] Pratiwi, I.D., Noviani, R. (2026). Accessibility analysis of fire stations in Surakarta City. IOP Conference Series: Earth and Environmental Science, 1586: 012060. https://doi.org/10.1088/1755-1315/1586/1/012060
[29] Ang, K.L.M., Seng, J.K.P., Ngharamike, E., Ijemaru, G.K. (2022). Emerging technologies for smart cities' transportation: Geo-information, data analytics and machine learning approaches. ISPRS International Journal of Geo-Information, 11(2): 85. https://doi.org/10.3390/ijgi11020085
[30] Nsaif, Q.A., Al-Obaidi, M.A. (2022). Site selection of fire station based on GIS approach for Baquba District eastern Iraq. Journal of Image Processing and Intelligent Remote Sensing, 2(3): 14-22. https://doi.org/10.55529/jipirs.23.14.22
[31] Taran, A. (2023). Measuring accessibility to health care centers in the city of Al-Mafraq using geographic information systems. International Journal of Geoinformatics, 19(1): 43-55. https://doi.org/10.52939/ijg.v19i1.2499
[32] Zayeri, F., Azizmohammad Looha, M., Derakhshan, H., Molla Mohammad Alian Mehrizi, Z., Khoundabi, B. (2024). Investigating the response time to disasters in the red crescent society by province and type of disasters: A descriptive study. Quarterly Scientific Journal of Rescue and Relief, 16(3): 169-180. https://doi.org/10.61186/jorar.16.3.169
[33] Jiang, L., Huang, Y.L. (2024). Healthcare call center efficiency improvement using a simulation approach to achieve the organization's target. International Journal of Healthcare Management, 17(2): 379-388. https://doi.org/10.1080/20479700.2023.2190250
[34] Almutairi, A., Yi, P., Owais, M. (2024). New approach for estimating intersection control delay from passive traffic sensors at network level. IEEE Access, 12: 2882-2900. https://doi.org/10.1109/ACCESS.2024.3349499
[35] Chowdhury, A., Kaisar, S., Khoda, M.E., Naha, R., Khoshkholghi, M.A., Aiash, M. (2023). IoT-based emergency vehicle services in intelligent transportation system. Sensors, 23(11): 5324. https://doi.org/10.3390/s23115324
[36] Hierink, F., Rodrigues, N., Muñiz, M., Panciera, R., Ray, N. (2020). Modelling geographical accessibility to support disaster response and rehabilitation of a healthcare system: An impact analysis of Cyclones Idai and Kenneth in Mozambique. BMJ Open, 10(11): e039138. https://doi.org/10.1136/bmjopen-2020-039138