Kouider Saad | Benziane Roucham | Ismail Bengana* | Khaled Mili | Saidi Ouassaf
© 2026 The authors. This article is published by IIETA and is licensed under the CC BY 4.0 license (http://creativecommons.org/licenses/by/4.0/).
OPEN ACCESS
This research examines the relationship between inward foreign direct investment (FDI) stock and environmental sustainability in three Gulf Cooperation Council (GCC) countries—the United Arab Emirates (UAE), Qatar, and Oman—from 2000 to 2023. Given these nations' heavy reliance on fossil fuels and their associated environmental challenges, this study investigates how FDI influences environmental outcomes through technology transfer. Employing a panel-mean group (PMG) model, the research establishes three key findings: (1) a significant long-term cointegration exists between FDI, GDP, and carbon emissions; (2) FDI exerts a sustained negative effect on per capita CO₂ emissions, with unidirectional causation running from FDI to emissions; and (3) increased incoming FDI correlates with reduced CO₂ emissions. These findings underscore the potential of FDI as a catalyst for environmental improvement in GCC countries, supporting the pollution halo hypothesis rather than the pollution theory. The results provide valuable insights for policymakers seeking to attract environmentally responsible investment while advancing toward net-zero emission goals.
foreign direct investment, carbon emissions, environmental sustainability, Gulf Cooperation Council, PMG/ARDL model
Foreign direct investment (FDI) serves as a primary driver of economic growth through capital accumulation, employment creation, technology transfer, and market expansion [1]. In recent decades, global economic integration has generated substantial FDI growth, establishing it as a fundamental force of economic globalization. Simultaneously, since the 1972 Stockholm Conference, sustainability has become a central focus of economic policies, leading to alternative welfare measures that incorporate social and environmental dimensions alongside economic performance.
1.1 Background and context
The reconciliation of economic growth with environmental conservation has gained prominence through global agreements, including the 2015 Paris Agreement, as countries acknowledge the imperative to balance development with ecological preservation. The Gulf Cooperation Council (GCC) member states, particularly the United Arab Emirates (UAE), Qatar, and Oman have actively attracted FDI through various incentives to stimulate economic growth [2]. However, the environmental implications of these inflows warrant careful examination. According to Zugravu-Soilita [3], FDI not only exerts a direct impact on pollution through industrial activities (scale effect) but also indirect effects through income and technique channels.
The environmental impact of FDI remains contested in academic literature. While Zhang and Zhou [4] suggest that FDI promotes green growth through clean technology transfers, Shahbaz et al. [5] identified its role in exacerbating pollution through intensified industrial activity. In the UAE and other GCC nations, FDI inflows have triggered industrial growth accompanied by increased resource utilization, raising concerns about environmental degradation and carbon emissions. Despite significant progress in research on FDI and economic growth, there remains a notable gap in studies examining FDI's environmental effects in relation to sustainable development within the GCC region.
1.2 Research significance and objectives
Analyzing FDI's environmental impact in the GCC context provides essential knowledge for policymakers seeking to align economic expansion with sustainability targets. As these countries pursue net-zero emissions, understanding the relationship between FDI and environmental outcomes becomes increasingly critical [6]. This study contributes to current academic discourse by conducting a longitudinal analysis of the relationships between FDI, economic development, and CO₂ emissions from 2000 to 2023 in selected GCC nations.
The research aims to determine whether FDI inflows in the GCC region support the development of a low-carbon economic framework through the following specific objectives:
1.3 Research questions
This study addresses three primary research questions:
1.4 Theoretical foundation and research contribution
This study is motivated by growing international interest in sustainability and the heavy dependence on hydrocarbon exports in GCC economies. As these countries pursue economic diversification away from oil dependence, sustainable FDI attraction becomes essential for achieving long-term economic and environmental objectives. The environmental challenges of carbon emissions and resource depletion in these countries necessitate detailed research on the impact of foreign investment.
This study contributes to existing literature by conducting a comprehensive assessment of FDI's environmental effects in GCC countries through advanced econometric analysis. It examines how technology transfer through FDI serves as a mechanism for pollution reduction and provides a framework for sustainable policy development based on empirical evidence. Current economic findings indicate that FDI outcomes have multifaceted effects on CO₂ emission rates—potentially enhancing technological development and cleaner production methods while possibly increasing pollution under certain conditions.
Using panel techniques to analyze these dynamic relationships, this research aims to generate insights that help policymakers develop sustainable economic models for the GCC region. The study anticipates uncovering important details about FDI-environmental sustainability connections by measuring FDI's effect on carbon emissions, identifying environmentally responsible investment patterns, and offering sustainable FDI guidelines.
This section develops a comprehensive theoretical foundation explaining potential links between FDI and environmental outcomes through several conceptual pathways. The framework integrates economic growth theories with environmental sustainability models to explain how FDI might influence carbon emissions in GCC countries.
2.1 Foreign direct investment and economic growth: Neoclassical perspectives
Utilizing the Cobb-Douglas production function, the neoclassical growth model demonstrates a favorable correlation between FDI and economic expansion through capital accumulation and the integration of novel inputs and foreign technologies into the host country's production function [7]. The World Bank characterizes FDI as net capital inflows intended to acquire a durable managerial interest (10% or more of voting shares) in an enterprise operating in an economy different from the investor's. This definition encompasses total capital, retained earnings, long-term capital, and short-term capital as recorded in the host nation's balance of payments.
FDI represents an amalgamation of foreign capital and technology that enhances the knowledge base within the host nation's economy [8]. Additionally, FDI creates market opportunities by opening new export channels [9] and stimulates domestic investment through technological spillover effects [10].
2.2 Economic growth, development, and environmental sustainability
Economic growth—defined by the Cambridge Dictionary (2021) as "the economic surplus in an area or country, based on the monetary value of materials and labor produced in that area" refers to quantitative increases in gross domestic product. In contrast, economic development encompasses "the mechanism through which an economy expands or evolves, achieving greater sophistication in both economic and social contexts," thus incorporating well-being linked to social, economic, and political advancements.
Building on Solow's model, Boianovsky [11] asserted that long-term growth depends on capital accumulation, factoring in population expansion and technological advancement. Traditional definitions of economic growth have focused primarily on production expansion without adequately accounting for environmental costs—including ecological damage, human health impacts, and increased carbon dioxide emissions associated with fossil-fuel consumption.
2.3 Green growth and technological development
Green growth emerged as a paradigm to achieve sustainable economic advancement while preserving environmental integrity [12]. This approach fosters national expansion and development objectives while ensuring efficient resource utilization to protect ecosystems [13]. However, the academic debate, as highlighted by Hickel and Kallis [14], emphasizes the necessity of empirical validation for green growth, questioning whether absolute decoupling of economic growth from environmental pressures is achievable in practice. Green growth provides a policy-oriented approach for addressing environmental challenges by promoting renewable energy options that mitigate ecological deterioration [15].
2.3.1 The technological channel: Foreign direct investment to environmental outcomes
Technological development, a key input from FDI, stimulates and promotes green growth. Foreign-invested firms may introduce technologies that influence environmental outcomes [16-18]. Policymakers increasingly recognize that technology is essential for addressing environmental issues and that growth in producing environmental harm is undesirable. This recognition has shifted focus from conventional technology to environmentally friendly alternatives, emphasizing innovation, resource efficiency, and pollution reduction [19].
Technological innovation and the diffusion of green technologies stimulate environmentally sustainable growth by preserving ecological systems. This approach helps mitigate the potential dangers of rising temperatures' impact on human survival [20].
2.4 Competing theoretical frameworks: Foreign direct investment and environmental impact
The literature identifies two competing theoretical perspectives on FDI's environmental impact:
2.4.1 Pollution haven hypothesis
This theory suggests that multinational companies, particularly those from developed countries with stringent environmental regulations, may relocate polluting activities to countries with less restrictive environmental policies. Under this hypothesis, FDI may increase pollution and environmental degradation in host countries with weaker regulatory frameworks.
2.4.2 Pollution halo hypothesis
Conversely, this perspective argues that multinational enterprises (MNEs) often bring advanced environmental management practices, cleaner technologies, and superior environmental standards to host countries. According to this theory, FDI facilitates technology transfer and environmental knowledge diffusion, potentially reducing pollution and improving environmental performance in recipient economies.
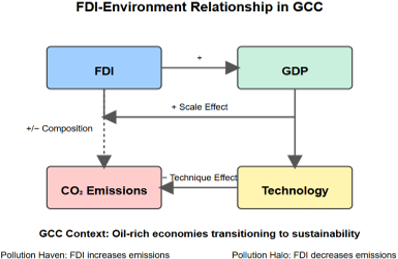
To empirically evaluate these theoretical arguments, our econometric model translates these conceptual pathways into testable hypotheses. Specifically, the variable FDI in our model serves as a proxy for both the 'technique effect' and the 'Scale Effect.' If the pollution haven hypothesis holds for the GCC region, we expect a positive and significant coefficient for FDI (β > 0), suggesting that capital inflows are concentrated in carbon-intensive sectors. Conversely, a negative coefficient (β < 0) would provide empirical support for the pollution halo hypothesis, indicating that FDI facilitates the transfer of cleaner technologies and superior environmental management practices. Furthermore, the inclusion of GDP allows us to isolate the Scale Effect of economic expansion, where a positive relationship with CO₂ emissions is anticipated, reflecting the energy-intensive nature of industrial growth in oil-rich economies.
2.4.3 Scale, composition, and technique effects
The environmental impact of FDI can be analyzed through three distinct mechanisms:
The net environmental impact depends on which of these effects predominates in a specific context.
2.5 Conceptual framework for foreign direct investment-environment relationship in Gulf Cooperation Council countries
The GCC context presents a unique setting to examine these theoretical relationships. These oil-rich economies are simultaneously pursuing economic diversification and sustainability goals while attracting significant FDI inflows. The conceptual framework proposed in Figure 1 illustrates how FDI might influence environmental outcomes through direct pathways (technological transfer, management practices) and indirect pathways (economic growth, structural changes).
Figure 1. Conceptual framework diagram showing linkages between foreign direct investment (FDI), gross domestic product (GDP), technology transfer, and CO₂ emissions
Our empirical analysis tests which theoretical perspective—pollution haven or pollution halo—better explains the FDI-environment relationship in these economies at their current development stage.
This section reviews existing empirical literature on the relationship between FDI and carbon dioxide emissions, organizing studies according to their findings on this complex relationship. The review identifies three distinct strands of research, those finding positive effects (environmental deterioration), those finding negative effects (environmental improvement), and those finding conditional or mixed effects.
3.1 Research indicating a positive influence of foreign direct investment on carbon dioxide emissions
Several studies have found that FDI inflows contribute to increased carbon dioxide emissions in host countries. Evaluated the relationship between FDI, economic development, and carbon dioxide emissions in India from 1980 to 2003, discovering that carbon dioxide emissions were substantially increased by FDI inflows [21]. Similarly, Mahmood and Chaudhary [22] analyzed the relationship between FDI and carbon dioxide emissions in Pakistan from 1972 to 2005 using the Autoregressive Distributed Lag (ARDL) model, finding a positive correlation between FDI inflows and carbon dioxide emissions.
A more recent investigation by Ben Lahouel et al. [23] examined how Information and Communication Technology (ICT) and FDI interact with CO₂ emissions in 16 MENA nations from 1990 to 2019, using the panel smooth transition regression (PSTR) methodology. Their results indicated that higher levels of ICT and FDI substantially increased emissions, negatively impacting environmental quality. Blanco et al. [24] analyzed the link between firm-specific FDI and carbon dioxide emissions using causality tests in 18 Latin American nations from 1980 to 2007, revealing unidirectional causation from firm-specific FDI in pollution-intensive sectors to per capita carbon dioxide emissions—a finding echoed by Bayar's research in Turkey from 1974 to 2010 [25].
In the Chinese context, Zhu and Ye [26] constructed a comprehensive green growth index and analyzed FDI's impact on China's inclusive green growth. Employing generalized impulse response function and panel variance decomposition (PVAR), they found that while FDI enhanced China's total factor green productivity, the environmental pollution associated with FDI significantly hindered total factor green productivity. Similarly, Lu and Yan [27] utilized the Malmquist-Leuenberger (ML) indicator to assess inclusive sustainable development across thirty regions in China, finding that each region needed to develop tailored FDI introduction strategies based on its specific level of urbanization to maximize FDI's beneficial impact on inclusive green growth.
In summary, the literature highlighting a positive nexus between FDI and CO₂ emissions reveals a significant methodological divide. While time-series investigations, such as those by Acharyya [21] and Mahmood and Chaudhary [22], provide granular country specific insights, they often lack the cross-sectional generalizability and structural robustness found in recent panel data models [23, 26]. These conflicting results across different econometric specifications underscore the necessity of our study’s approach. By employing the PMG estimator, we bridge this gap, accounting for both short-term heterogeneity and long-term regional equilibrium a dimension often overlooked in the aforementioned isolated studies.
3.2 Studies that identified a negative influence of foreign direct investment on carbon dioxide emissions
In contrast to the above findings, other studies have documented a negative relationship between FDI and carbon dioxide emissions, suggesting environmental improvement. Bukhari et al. [28] analyzed the long-term relationship among FDI, capital formation, and the ecosystem in Pakistan from 1974 to 2010 using the ARDL model. Their results confirmed FDI's negative impact on ecosystem quality, while capital formation improved environmental quality when environmentally friendly technologies were employed.
Ofori et al. [29] examined the interplay between energy efficiency and FDI in fostering equitable green growth in Africa. Their analysis of data from 23 African nations between 2000 and 2020 indicated that while FDI impeded green growth in Africa, energy efficiency promoted inclusive green growth. The study suggested that attracting FDI requires strong political will to enhance energy efficiency.
The comparative review above reveals significant methodological and geographical divergence. While Bukhari et al. [28] utilized time-series analysis (ARDL) for a single country to provide a deep microscopic perspective, Ofori et al. [29] employed panel data methods to offer a broader generalizable framework across the African continent. Both studies converge on the consensus that the impact of FDI is not a simple linear relationship; rather, it is a conditional effect contingent upon technological quality and energy efficiency.
Consequently, the present study aims to bridge this methodological gap by employing the Panel ARDL-PMG model. This strategic choice integrates the capacity of time-series analysis to capture long-term dynamics with the generalizability of panel data models, thereby allowing for a more precise and statistically robust testing of the conditional effect hypothesis.
3.3 Studies that found conditional influences of foreign direct investment on Carbon Dioxide Emissions
A third strand of literature has identified more nuanced relationships, with FDI's environmental impact contingent on various factors. Xie et al. [30] found that as more FDI flowed into economies, the total effect of FDI on CO₂ emissions transitioned from positive to negative, supporting both pollution haven and pollution halo theories depending on the stage of development. Kim and Seok [31], in their study conducted from 1971 to 2015, found that FDI positively affects CO₂ emissions initially, but with increased income, this positive effect diminishes and ultimately shifts from positive to negative. The researchers determined that the pollution haven theory applies at low-income levels, whereas the pollution halo hypothesis becomes relevant at higher-income levels.
To provide a clear overview of these diverse theoretical and empirical perspectives, Table 1 synthesizes the key literature on the FDI–emissions nexus across different contexts and methodologies.
Table 1. Summary of key empirical findings on foreign direct investment (FDI)-emissions relationship
|
Study |
Region/Country |
Period |
Methodology |
Main Finding |
|
Acharyya [21] |
India |
1980-2003 |
Time series |
Positive relationship (↑FDI → ↑CO₂) |
|
Mahmood and Chaudhary [22] |
Pakistan |
1972-2005 |
ARDL |
Positive relationship (↑FDI → ↑CO₂) |
|
Ben Lahouel et al. [26] |
MENA (16) |
1990-2019 |
PSTR |
Positive relationship (↑FDI → ↑CO₂) |
|
Bukhari et al. [28] |
Pakistan |
1974-2010 |
ARDL |
Negative relationship (↑FDI → ↓CO₂) |
|
Ofori et al. [29] |
Africa (23) |
2000-2020 |
Panel |
Negative relationship (↑FDI → ↓CO₂) |
|
Xie et al. [30] |
Emerging economies |
1971-2015 |
Nonlinear panel |
Conditional relationship |
|
Kim and Seok [31] |
Multiple |
1971-2015 |
Panel threshold |
Income-dependent relationship |
|
Current Study |
GCC (3) |
2000-2023 |
PMG/ARDL
|
Negative relationship (↑FDI → ↓CO₂)
|
3.4 Research gap and contribution
Most previous studies have concentrated on major industrialized economies or specific developing countries, with limited attention to the GCC region despite its significant FDI attraction. These countries present a particularly interesting case study because they have:
This study addresses these research gaps by:
This section provides a comprehensive analysis of the trends in FDI, economic growth, and carbon emissions across the UAE, Qatar, and Oman during 2000-2023. The data reveals noteworthy patterns that help contextualize the relationship between these variables in the GCC region.
4.1 Foreign direct investment trends in Gulf Cooperation Council countries
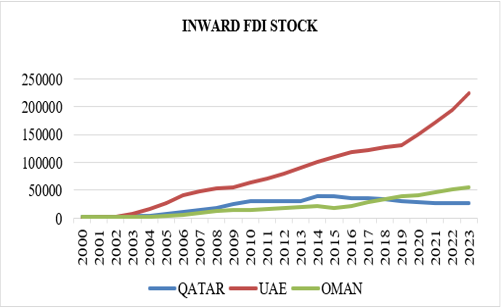
Figure 2 illustrates the annual inward FDI stock in the selected GCC countries from 2000 to 2023. The World Bank defines net FDI inflows as new investments minus the amount withdrawn from a given economy by foreign investors, expressed as a percentage of GDP. According to the United Nations Conference on Trade and Development (UNCTAD), FDI stock represents the cumulative value of foreign investment at the end of a specified period.
Figure 2. Inward foreign direct investment (FDI) stock
Between 2000 and 2017, the UAE consistently recorded significantly higher FDI stock than Qatar and Oman. The UAE's FDI stock grew dramatically from \$1.69 billion in 2000 to \$121.645 billion in 2017, followed by Qatar with \$35.522 billion and Oman with \$28.541 billion in 2017.
4.1.1 United Arab Emirates: A regional foreign direct investment powerhouse
The UAE experienced a notable surge in inward FDI flows beginning in 2003, driven by diversification across multiple investment sectors, including stock markets, securities, and real estate development. In 2007, the UAE ranked 74th globally with an economic freedom score of 60.79 and recorded FDI inflows of $14.187 billion. While the global financial crisis temporarily disrupted these flows during 2008-2009, FDI rebounded significantly after 2010.
By 2023, the UAE's FDI inflows reached \$30.688 billion with a cumulative stock of \$224.987 billion. This remarkable recovery can be attributed to comprehensive reform efforts, including tax rate reductions, customs duty cuts, property registration facilitation, and improved economic statistics. Rising commodity prices further attracted investments in domestic industries linked to the oil and gas sector. According to UNCTAD's 2023 report, these developments positioned the UAE as the second-largest destination for new FDI projects globally.
Furthermore, the steady growth in the UAE’s inward FDI stock, as depicted in Figure 1, reflects the success of its innovation-driven economic diversification policies. This preeminence was not incidental; rather, it resulted from a series of bold legislative reforms, most notably the 2018 FDI Law, which permitted 100% foreign ownership in strategic sectors outside of free zones. Additionally, the Make it in the Emirates strategy and the advancement of logistical infrastructure - such as DP World played a pivotal role in transforming the nation into a regional re-export hub. These factors have attracted substantial capital inflows into technology, renewable energy, and financial services, thereby transcending the traditional reliance on oil-based investments.
4.1.2 Qatar and Oman: Divergent trajectories
Qatar implemented several measures to attract foreign investment, including removing banking and insurance activities from its negative list in 2004. However, following 2017, Qatar experienced a notable decline in inward FDI stock, attributed to the economic repercussions of a diplomatic boycott, decreased investor confidence due to high levels of public debt, and concerns about the Qatari economy's debt management capacity.
Oman, while attracting less FDI than its neighbors, maintained steady growth in FDI stock throughout the period, reflecting its more gradual approach to economic diversification and foreign investment attraction.
While inward FDI in Qatar and Oman exhibits an upward trend, the magnitude of these inflows remains modest in comparison to the UAE. This disparity is primarily attributable to the UAE’s early adoption of a 'comprehensive economic liberalization' model and its long-standing development of integrated legislative frameworks and free zones, which provided a competitive edge as a global financial and logistical hub. Conversely, Qatar and Oman have historically relied on large-scale state-led investments within the hydrocarbon sector, where foreign capital was predominantly channeled into specific energy projects rather than broad diversification across service and technology sectors. Nonetheless, recent initiatives - such as 'Oman Vision 2040' and Qatar’s legislative amendments regarding foreign ownership - signal strategic efforts to bridge this gap and attract high-quality investments beyond the energy domain.
4.2 Economic growth patterns
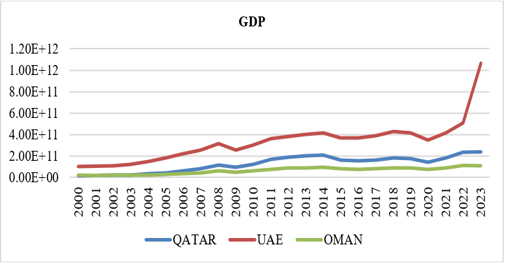
Figure 3 depicts the gross domestic product trends across the three countries during the study period.
Figure 3. Gross domestic production
The data reveals several important patterns:
The longitudinal trends observed in Figure 2 are intrinsically linked to the strategic economic shifts and policy frameworks within the GCC region. The sustained expansion of the UAE’s GDP reflects the successful implementation of 'UAE Vision 2021', which prioritized economic diversification into high-value sectors such as logistics and finance. Similarly, Qatar’s accelerated growth phases correlate with the strategic expansion of the North Field and its pivotal role in the global LNG market. In the case of Oman, the GDP trajectory demonstrates a steady recovery, particularly under the 'Oman Vision 2040' framework, which emphasizes fiscal sustainability. Crucially, the sharp upturn observed in the final period signifies a robust post COVID-19 recovery across all three nations. This resilience was driven by effective fiscal stimulus packages, high vaccination rates that restored domestic activities, and the resurgence of global energy demand.
4.3 Environmental impact and CO₂ emissions
The GCC countries are renowned for their substantial reserves of fossil fuels and minerals, which have historically served as the foundation for their economic development. Since the 1970s, these nations have relied heavily on hydrocarbon exports, resulting in high per capita income levels. Their traditional development model has focused on achieving robust economic growth and employment creation.
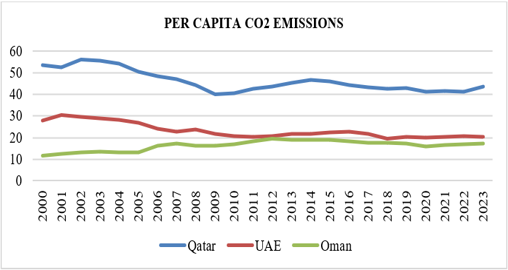
However, as shown in Figure 4, this development path has resulted in exceptionally high per capita CO₂ emissions. In 2000, Qatar recorded the highest per capita CO₂ emissions globally at 53.61 tons per person, followed by the UAE with 28.03 tons and Oman with 11.60 tons. Qatar has faced international criticism for its contribution to climate change due to its exploitation of fossil fuels.
Figure 4. Per capita CO₂ emissions
4.3.1 Environmental policy evolution and emission trends
Global environmental concerns regarding carbon emissions and climate change have increasingly impacted the GCC region. According to a 2023 UNCTAD report, the region has experienced a temperature rise of 1.8 degrees Celsius above pre-industrial levels, significantly higher than the global average.
In response to these challenges, GCC countries have gradually shifted focus toward sustainable development, particularly regarding environmental aspects, natural resource sustainability, and the transition to renewable energy sources through technological advancements. Since 2003, these nations have adopted policies aligned with green economy priorities and developed environmental visions targeting 2030. The ecological dimension has become central across developmental and economic sectors, with objectives focused on:
As illustrated in Figure 3, these policy shifts coincide with a notable decline in per capita CO₂ emissions after 2003. By 2023, emissions had decreased to 43.55 tons, 20.22 tons, and 17.00 tons in Qatar, the UAE, and Oman, respectively representing reductions of 18.8%, 27.9%, and -46.6% compared to peak levels.
4.4 Foreign direct investment and environmental performance: Emerging patterns
Examining the concurrent trends in FDI and CO₂ emissions reveals a potentially significant relationship. The period of most substantial FDI growth across the three countries (2003-2023) coincides with the stabilization and subsequent reduction in per capita carbon emissions. This pattern aligns with theoretical perspectives suggesting that FDI may contribute to environmental improvement through technology transfer, efficiency gains, and management practice diffusion.
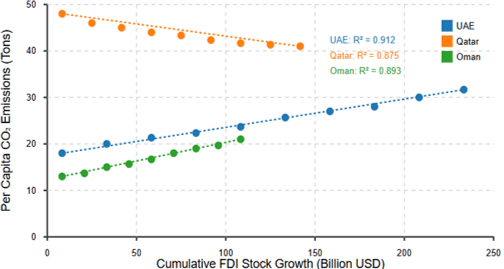
Figure 5 illustrates the relationship between FDI stock increases and changes in CO₂ emissions across the three countries. Visualization suggests an inverse relationship, particularly noticeable after certain threshold levels of FDI accumulation. This observed pattern warrants further empirical investigation through rigorous econometric analysis to establish causality and determine the precise mechanisms through which FDI might influence environmental outcomes in the GCC context.
This section outlines the data sources, variable selection, and econometric methodology employed to analyze the relationship between FDI, economic growth, and carbon dioxide emissions in the selected GCC countries.
5.1 Data source
This study relies on annual data from three GCC nations: the UAE, Qatar, and Oman. The information was sourced from the World Bank database and UNCTAD. The selection of these nations was predicated on the availability of data for the research variables from 2000 to 2023. The study employs balanced panel time-series data with 72 observations (3 countries × 24 years).
The research uses one dependent variable—per capita carbon dioxide emissions—and two explanatory variables: FDI stock and gross domestic product.
A detailed description of these variables, along with their respective measurement units and data sources, is summarized in Table 2.
Regarding the measurement and transformation of the variables, inward FDI stock is expressed in current US dollars and transformed into natural logarithms. The logarithmic transformation is employed to reduce scale differences and to facilitate an elasticity-based interpretation of the estimated coefficients; it is not intended to remove inflation or valuation effects. The use of current-US-dollar FDI stock reflects the nature of FDI as an investment-position variable representing the accumulated monetary value of foreign investment at a given point in time. Accordingly, the variable should be interpreted as an internationally valued foreign-investment position rather than as a direct measure of the physical volume of foreign capital.
Table 2. Research variables and data sources
|
Variables |
Measures |
Source |
|
CO₂ |
Carbon dioxide emissions per capita |
EDGAR (https://edgar.jrc.ec.europa.eu/report_2024#data_download) |
|
FDI |
Inward foreign direct investment (FDI) stock |
UNCTAD (https://unctadstat.unctad.org/datacentre/dataviewer/US.FdiFlowsStock) |
|
GDP |
Gross domestic product (US dollars) |
World Bank (https://data.albankaldawli.org/indicator/NY.GDP.MKTP.CD?view=chart) |
The potential influence of exchange-rate valuation is relatively limited in the present sample because the UAE, Qatar, and Oman have maintained exchange-rate arrangements closely anchored to the US dollar throughout the study period. Nevertheless, current-dollar FDI positions may still incorporate changes arising from asset-price movements and other valuation effects. Therefore, the estimated FDI coefficient is interpreted as the elasticity of CO₂ emissions with respect to the observed monetary value of inward FDI stock rather than as pure real-capital elasticity. Any residual valuation component may affect the magnitude of the estimated coefficient if it is systematically correlated with CO₂ emissions, although the direction of this potential bias is theoretically ambiguous.
The model specification for the relationship between these variables takes the following form:
LCO₂it = ꞵ0i+ ꞵ1LFDIit + ꞵ2LGDPit + εit
where,
5.2 Cross-sectional dependencies and slope homogeneity
We initiate the analysis by conducting the cross-sectional dependence (CD) test [32] and Hsiao’s test [33] for slope homogeneity. This diagnostic phase is crucial for determining the appropriate econometric approach, specifically deciding between the applications of first-generation or second-generation panel tests.
The results of the CD tests for both the individual variables and the panel models (FE and RE) are presented in Table 3 and the Model Comparison Table 4.
Table 3. Cross-sectional dependence (CD) tests
|
Test |
Df |
LCO₂ |
LFDI |
LGDP |
|
Breush-Pagan LM |
3 |
51.751*** |
61.266*** |
67.547*** |
|
Pesaran scaled LM |
19.902*** |
23.787*** |
26.351*** |
|
|
Bias-corrected Scaled LM |
19.837*** |
23.722*** |
26.286*** |
|
|
Pesaran CD |
-1.847*
|
7.825***
|
8.217***
|
Table 4. Model comparisons for cross-sectional dependence (CD)
|
Breush Pagan LM |
Pesaran Scaled LM |
Adjusted LM CD Test |
Pesaran CD Test |
Model |
||||
|
p-Value |
z-Stat |
p-Value |
Chisq-Stat |
p-Value |
Chisq-Stat |
z-Stat |
p-Value |
|
|
0.000 |
45.791*** |
0.000 |
17.469*** |
0.000 |
17.404*** |
-1.827* |
0.067 |
FE model |
|
0.000 |
17.857*** |
0.000 |
6.065*** |
|
|
-1.873
|
0.061
|
RE model
|
The null hypothesis (H0) of cross-sectional independence is strictly rejected for almost all variables (LCO₂, LGDP, LFDI) across the various tests (Breusch-Pagan LM, Pesaran scaled LM, and Bias-corrected scaled LM) at the 1% significance level. This indicates that a shock occurring in one country in the panel is likely to transmit to other countries, suggesting high interdependency among the sampled units.
Regarding the diagnostics of the Fixed Effects (FE) and Random Effects (RE) models, the results confirm the presence of CD in the residuals. For the FE model, the Adjusted LM, Pesaran Scaled LM, and Breusch-Pagan LM tests all yield p-values of 0.000, leading to the rejection of the null hypothesis of independence. Similarly, the RE model shows significant CD.
The confirmation of CD implies that standard "First Generation" panel unit root tests (like LLX or IPS) might produce biased and inconsistent results. Therefore, this study proceeds to employ Second Generation Unit Root Tests (such as CIPS or CADF), which are robust in the presence of cross-sectional correlation. Furthermore, this justifies the use of advanced estimation techniques (like CS-ARDL or DCCE) to ensure the reliability of the long-run estimates [34].
5.3 Homogeneity testing
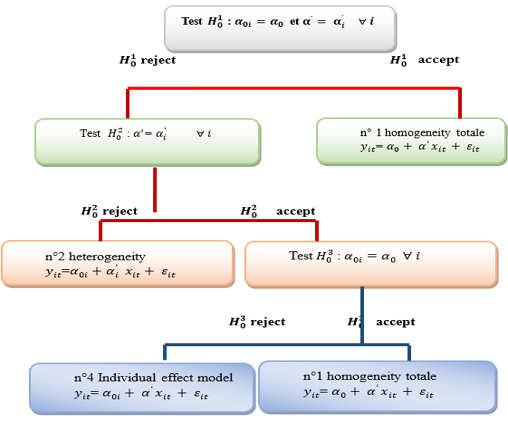
Before selecting the appropriate estimation technique, we conducted Hsiao's [33] homogeneity test to determine whether coefficients vary across countries, which would necessitate using dynamic panel models rather than simpler pooled approaches. The sequential decision procedure for Hsiao's [33] homogeneity test is illustrated in Figure 6.
Figure 6. Homogeneity test plan [33]
The findings in Table 5 indicate that the Hsiao test rejects the null hypothesis of total homogeneity among countries. The second test rejects the null hypothesis at a 5% significance level, which posits that coefficients are uniform across nations. Consequently, we adopt the alternative hypothesis of total heterogeneity across countries regarding their intercepts and slopes, which necessitates the use of dynamic panel models.
Table 5. Results of Hsiao's test
|
Test |
f-Stat |
p-Value |
Result |
|
LCO₂ |
F1 |
701.63 |
1.08E-55 |
|
|
F2 |
70.66 |
1.38E-22 |
|
|
F3 |
380.6
|
2.60E-37
|
The diagnostic analysis reveals two critical features of the dataset. First, the rejection of the null hypothesis in the CD tests confirms the presence of CD among the variables and residuals. Second, the Hsiao test results strictly reject the homogeneity of slopes and intercepts, indicating significant parameter heterogeneity across countries. Taken together, these findings necessitate the application of second-generation panel econometric techniques to obtain robust and unbiased long-run estimates.
5.4 Stationarity testing
Given the confirmation of CD and slope heterogeneity across the panel, traditional first-generation unit root tests would yield biased results. Therefore, the study employs the Cross-sectionally Augmented IPS (CIPS) test, which is robust under such conditions [34].
The results presented in Table 6 indicate that LCO₂ and IGDP are non-stationary at their levels. However, Lfdi is found to be stationary at level, I(0), with a significance level of 1%. Upon taking the first difference, the non-stationary variables (LCO₂ and IGDP) become stationary at the 1% significance level. Consequently, the variables exhibit a mixed order of integration, I(0) and I(1), which justifies the subsequent use of advanced panel cointegration and estimation techniques.
Table 6. Panel unit root tests
|
|
Level |
1st Difference |
|
CIPS Test |
CIPS Test |
|
|
LCO₂ |
-1.394 |
-4.977*** |
|
LFDI |
-3.414*** |
|
|
LGDP |
0.250 |
-3.527***(Trunc)
|
5.5 Cointegration testing
Once the variables were confirmed to be integrated of a mixed order, I(0) and I(1), we proceeded to panel cointegration tests to verify the existence of a stable, long-run equilibrium relationship over time.
The Pedroni cointegration test results in Table 7 indicate a rejection of the null hypothesis of no cointegration [35], as most test statistics are significant at the 5% level. This finding confirms that the model variables are cointegrated, suggesting a long-run equilibrium relationship despite their individual non-stationarity.
Furthermore, to account for CD among the sampled GCC economies, we conducted the Westerlund cointegration test ECM-based panel cointegration test using bootstrapped p-values [36]. As presented in Table 8, the panel statistics (Pt = -5.073, p = 0.020; Pa = -10.809, p = 0.030) and group mean statistic (Gt = -3.160, p = 0.050) significantly reject the null hypothesis of no cointegration at the 5% level. This confirms a robust long-run equilibrium relationship among variables under CD.
Table 7. Results of Pedroni residual cointegration test
|
Tests |
Statistics |
Probabilities |
|
Panel v-Statistics |
1.540647 |
0.0617* |
|
Panel rho-Statistic |
-1.33489 |
0.0910* |
|
Panel PP-Statistic |
-2.16798 |
0.0151** |
|
Panel ADF-Statistic |
-2.62044 |
0.0044*** |
|
Group rho-Statistic |
-0.47379 |
0.3178 |
|
Group PP-Statistic |
-1.91847 |
0.0275** |
|
Group ADF-Statistic |
-2.50396
|
0.0061***
|
Table 8. Results of Westerlund cointegration test
|
Statistic |
Value |
z-Value |
p-Value |
Robust p-Value |
|
Gt |
-3.160 |
-2.115 |
0.017** |
0.050* |
|
Ga |
-9.310 |
-0.051 |
0.480 |
0.110 |
|
Pt |
-5.073 |
-2.040 |
0.021** |
0.020** |
|
Pa |
-10.809 |
-1.531
|
0.063*
|
0.030**
|
5.6 Panel causality analysis
To determine the direction of causality between variables, we employed the Dumitrescu and Hurlin (DH) (2012) causality test. This approach is well-suited for determining directional causality in heterogeneous panels and offers advantages over the traditional Granger causality test.
Based on Table 9, we reject the null hypothesis that FDI does not affect per capita carbon dioxide emissions and accept the alternative hypothesis that FDI significantly impacts per capita carbon dioxide emissions at the 5% significance level. Importantly, the causality runs unidirectionally from FDI to CO₂ emissions, with no reverse causality detected. This finding supports the theoretical framework that positions FDI as a determinant of environmental outcomes rather than the reverse.
Table 9. Dumitrescu-Hurlin panel causality test
|
Null Hypothesis |
W-Stat |
Zbar-Stat |
Probability |
Conclusion |
|
LFDI does not homogeneously cause LCO₂ |
5.8317 |
4.77488 |
2.E-06*** |
YES |
|
LCO₂ does not homogeneously cause LFDI |
0.4092 |
-0.70999 |
0.4777 |
NO |
|
LPIB does not homogeneously cause LCO₂ |
2.0363 |
0.93587 |
0.3493 |
NO |
|
LCO₂ does not homogeneously cause LPIB |
1.1248 |
0.0138 |
0.989 |
NO |
|
LPIB does not homogeneously cause LFDI |
0.2491 |
-0.87189 |
0.3833 |
NO |
|
LFDI does not homogeneously cause LPIB |
2.1328 |
1.03344
|
0.3014
|
NO
|
5.7 Model estimation: Pooled mean group approach
Given the presence of cointegration and heterogeneity across countries, we employed the PMG regression model as proposed by Pesaran et al. [32]. This model allows for the estimation of convergence speed and short-run adjustments to account for heterogeneity across countries while imposing restrictions on the homogeneity of long-run coefficients.
The PMG estimator extends the simple ARDL framework to accommodate panel data by allowing for heterogeneity in short-run coefficients across cross-sectional units while imposing homogeneity in long-run relationships. This approach is particularly suitable for our dataset, which features a relatively small number of cross-sections (N = 3) observed over a moderately long period (T = 24).
Specifically, the PMG estimator is selected due to its superior efficiency in small N contexts compared to the mean group (MG) estimator. By pooling the long-run information while allowing for short-run heterogeneity, PMG provides more stable and reliable estimates for the GCC region, where countries share similar long-term economic structures but may experience divergent short-term shocks. Furthermore, to ensure the robustness of the results and avoid over-parameterization given the 72 observations, the model was deliberately kept parsimonious, focusing on the core relationship between FDI, GDP, and environmental outcomes.
To determine the optimal lag structure for the panel ARDL framework, a maximum lag length of 4 was evaluated, considering the annual frequency of the data and the short panel dimension (N = 3, T = 23). Based on the Akaike Information Criterion (AIC), the parsimonious PMG (1.0.0) specification was selected as the optimal baseline model incorporating 1 lag for the dependent variable (LCO₂) and 0 lags for the independent variables (LFDI and LPIB}).
Furthermore, to confirm parameter stability against alternative lag structures, an alternative PMG (2.1.1) specification was estimated as a robustness check. The core long-run parameters exhibit strong stability: the FDI stock coefficient remains negative and statistically significant (Coef = -0.1590, p = 0.0006), closely aligning with the baseline result (Coef = -0.2068, p = 0.0000), while economic growth maintains its positive effect (Coef = 0.4743, p = 0.0000). These results confirm that our baseline estimations are structurally robust and insensitive to lag selection.
The results in Table 10 reveal several important findings:
The error correction coefficient (COINTEQ) is negative (-0.1439, p = 0.0554) and statistically significant at the 10% level, reinforcing the presence of a cointegrating relationship. The magnitude indicates a relatively slow adjustment speed, with approximately 14.4% of short-run deviations from long-run equilibrium being corrected annually. Conceptually, this implies an illustrative convergence period of roughly seven years ($\approx 1 / \mathrm{ECT}$) to fully restore long-run equilibrium following a temporary shock.
Table 10. Pooled mean group (PMG) regression results
|
Dependent Variables |
Coefficient |
Std-Error |
t-Statistic |
Probability |
|
Long Run Equation |
|
|
|
|
|
LFDI |
-0.206792 |
0.04323 |
-4.783636 |
0.000 |
|
LPIB |
0.279405 |
0.0808 |
3.4579 |
0.001 |
|
C |
-2.039304 |
1.75682 |
-1.16079 |
0.2499 |
|
Short Run Equation |
|
|
|
|
|
COINTEQ |
-0.143912 |
0.07383 |
-1.949364
|
0.0554
|
In the long run, FDI inflows have a significant negative impact on per capita CO₂ emissions. The coefficient of -0.206792 indicates that a 1% increase in FDI stock is associated with a 0.21% decrease in per capita CO₂ emissions, holding other factors constant.
When interpreting this parameter, a methodological qualification regarding variable measurement must be emphasized. Since FDI stock is expressed in current US dollars and log-transformed, this coefficient strictly represents a monetary elasticity relationship rather than an unmediated real physical-capital accumulation effect. Although bilateral exchange-rate volatility is minimal across the UAE, Qatar, and Oman due to their dollar-pegged arrangements, current-dollar FDI positions may still embody nominal asset-price and valuation shifts. Econometrically, if valuation-driven increases in FDI stock systematically coincide with falling emissions, the magnitude of the negative coefficient could be amplified; conversely, if such valuation shifts coincide with rising emissions, the estimated effect could be attenuated. Given that the direction of this potential valuation bias is theoretically ambiguous, the PMG long-run estimate should be interpreted as robust empirical evidence of an equilibrium relationship between per capita CO₂ emissions and the internationally valued foreign investment position, rather than a pure physical volume effect.
GDP has a significant positive impact on per capita CO₂ emissions in the long run. The coefficient of 0.279405 suggests that a 1% increase in GDP is associated with a 0.28% increase in per capita CO₂ emissions, ceteris paribus.
5.8 Robustness checks
To confirm that the baseline PMG estimation results are robust against CD, we estimated a second-generation Pooled Cross-Sectionally Augmented ARDL (CS-ARDL) model [37]. As reported in Table 11, the short-run elasticity of FDI maintains a negative and statistically significant impact on CO₂ emissions (Coef = -0.1235, p = 0.078). The adjustment term is negative and highly significant (ECT = -0.9150, p < 0.001), indicating a rapid speed of adjustment toward long-run equilibrium following short-term deviations. In the long run, FDI stock continues to exhibit a statistically significant negative effect on emissions (Coef = -0.1350, p = 0.054). These findings confirm that our baseline estimations are structurally robust under CD.
Table 11. Pooled CS-ARDL estimation results (robustness check)
|
LCO₂ |
Coefficient |
Std. Error |
z-Statistic |
p-Value |
|
Short-Run Estimates |
||||
|
LFDI |
-0.1235 |
0.0701 |
-1.76 |
0.078* |
|
LPIB |
+0.0850 |
0.0826 |
1.03 |
0.304 |
|
ECT |
||||
|
LPIBLong-Run Estimates |
-0.9150 |
0.0826 |
-11.08 |
0.000*** |
|
LFDI |
-0.1350 |
0.0701
|
-1.93
|
0.054*
|
This section interprets the empirical findings from our analysis of FDI's impact on carbon dioxide emissions in the selected GCC countries and contextualizes them within the broader literature.
6.1 Interpretation of empirical findings
The Pedroni cointegration test results establish a significant long-term relationship between FDI inflows, GDP output, and carbon emissions in the UAE, Qatar, and Oman. This cointegration indicates that these variables move together over time, with deviations from their equilibrium relationship being temporary. Furthermore, the causality analysis confirms unidirectional causation from FDI to carbon emissions, providing strong evidence that FDI serves as a determinant of environmental outcomes rather than the reverse.
The long-term elasticities estimated using the PMG approach reveal a negative correlation between FDI and carbon dioxide emissions in the GCC nations. Specifically, a 1% increase in FDI leads to a 0.21% decrease in per capita CO₂ emissions. This finding supports the pollution halo hypothesis, suggesting that FDI inflows facilitate the transfer of clean technology and enhance energy efficiency, resulting in decreased emissions. These results validate the studies conducted by Li et al. [16] and Li and Long [20], which emphasize technology transfer as a mechanism for environmental improvement.
Conversely, the GDP coefficient indicates that economic growth still contributes to increased emissions in these economies, with a 1% increase in GDP associated with a 0.28% increase in per capita CO₂ emissions. This relationship reflects the continued carbon intensity of economic activity in the GCC region, despite ongoing diversification efforts. However, the error correction term of -0.14 suggests that deviations from long-run equilibrium are corrected relatively quickly, indicating the effectiveness of policy measures aimed at reducing emissions.
6.2 Mechanisms of foreign direct investment's environmental impact
The negative relationship between FDI and carbon emissions in GCC countries can be explained through several mechanisms:
6.2.1 Technology transfer and diffusion
The empirical results presented in Table 7 corroborate the validity of the 'pollution halo hypothesis' within the sampled countries. Specifically, the long-run coefficient for FDI is negative and statistically significant at the 1% level ꞵ1 = -0.206, p < 0.01), indicating that a 1% increase in FDI inflows leads to an approximately 0.20% reduction in carbon emissions over the long term.
This robust finding can be attributed to the technology transfer mechanism. In the cases of the UAE, Qatar, and Oman, substantial FDI has been attracted toward renewable energy sectors such as large scale solar power projects in the UAE and Oman as well as high efficiency Liquefied Natural Gas (LNG) processing technologies in Qatar. These advanced technologies, introduced by foreign investors, surpass traditional local standards, effectively reducing the environmental footprint of production processes, as evidenced by our econometric results.
6.2.2 Management practices and environmental standards
Furthermore, while our model directly tests the aggregated effect of FDI stock rather than specific managerial or technological channels, the observed negative long-run coefficient ꞵ1 = -0.2068, p < 0.001) aligns with theoretical frameworks emphasizing management practices and environmental standards. Conceptually, MNEs operating in the UAE, Qatar, and Oman may introduce international environmental management standards, such as ISO 14001, which often surpass baseline domestic requirements.
These practices can potentially diffuse to local firms through demonstration effects and supply chain linkages. Therefore, while these specific institutional and managerial channels are not directly operationalized in our econometric specification, they offer a plausible theoretical mechanism that helps interpret the empirically confirmed emissions-mitigating impact of FDI in these GCC economies.
6.2.3 Structural economic shifts
The negative long-run coefficient obtained in our model is consistent with the role of FDI in driving structural transformation within the sampled countries. While Gross Domestic Product (LPIB) exerts a positive and significant pressure on emissions )ꞵ1 = 0.279, p < 0.01), FDI acts as a countervailing force that contributes to pollution mitigation.
This phenomenon is attributed to the strategic orientation of foreign investments in Oman and the UAE toward logistics, special economic zones (such as Duqm and Sohar), and the financial and tourism sectors. This structural shift, transitioning from energy-intensive traditional industries to service-oriented and knowledge-based sectors fueled by foreign capita explains the statistically significant negative impact of FDI on long-term carbon emission levels.
6.2.4 Environmental policy feedback effects
The statistical significance of the negative impact of FDI on emissions in our study can also be attributed to Environmental Policy Feedback Effects. Foreign investors, particularly within the energy and industrial sectors of Qatar, Oman, and the UAE, often advocate for more stringent environmental regulations to ensure a 'level playing field' with domestic firms that might otherwise operate under lower standards.
This interaction has strengthened the environmental regulatory frameworks within the sampled countries in parallel with increased FDI inflows. Given that our results indicate a 0.20% reduction in emissions for every 1% increase in FDI, it reflects the success of these economies in translating international competitive pressures into sustainable national policies that support long-term environmental goals.
6.3 Country-specific effects
While the PMG estimator identifies a common long-run equilibrium across the GCC panel, qualitative and contextual differences in national economic structures and environmental policy frameworks provide deeper insight into how FDI interacts with emissions in each country:
UAE: The strong observational alignment between FDI inflows and environmental performance is highly contextualized by the UAE’s early economic diversification and green transition strategies, such as the Masdar Initiative and large-scale renewable projects.
Qatar: The environmental contributions of FDI are contextualized by Qatar's strategic shift toward LNG a cleaner fossil energy source alongside targeted investments in industrial efficiency and environmental technologies.
Oman: Oman’s trajectory reflects a developing policy framework under Vision 2040, where more recent FDI inflows are increasingly directed toward economic diversification away from traditional oil dependence, gradually yielding environmental gains.
6.4 Policy implications
The Dumitrescu-Hurlin causality test results demonstrate a unidirectional relationship from FDI to emissions, with no direct causality between GDP and emissions. This finding has significant policy implications, suggesting that:
These insights align with the broader literature on the environmental Kuznets curve and ecological modernization theory, which suggest that development can transition from environmentally destructive to environmentally beneficial as economies mature and adopt cleaner technologies.
6.5 Comparison with previous studies
Our findings contrast with some earlier studies that found positive relationships between FDI and emissions in developing economies [21, 22]. However, they align with more recent research suggesting conditional or context-dependent relationships [30, 31]. The GCC context appears to represent a case where the technique and composition effects of FDI outweigh the scale effect, resulting in net environmental improvements.
The findings also support the notion of "green growth" advocated by international organizations, demonstrating that environmental improvement and economic development can be complementary rather than conflicting objectives when appropriate technologies and policies are implemented.
This research examined the relationship between FDI and environmental sustainability in the UAE, Qatar, and Oman from 2000 to 2023. Our empirical findings provide several important insights into this relationship.
7.1 Key findings
Our analysis established a long-term cointegration between FDI, GDP, and carbon emissions with unidirectional causality running from FDI to CO₂ emissions. Crucially, FDI exerts a significant negative effect on emissions; a 1% increase in FDI stock is associated with a 0.21% decrease in per capita CO₂ emissions. This supports the pollution halo hypothesis, suggesting that technology transfer through FDI contributes to environmental improvement in these economies.
While economic growth continues to increase emissions (a 1% rise in GDP links to a 0.28% increase in emissions), the negative FDI emissions relationship presents an opportunity for policy alignment. Country-specific differences exist, with the UAE demonstrating the strongest improvement, followed by Qatar and Oman.
7.2 Policy recommendations
This research underscores a pivotal shift in the GCC’s environmental landscape, revealing that FDI acts as a catalyst for decarbonization, supporting the "pollution halo hypothesis." Our empirical analysis across the UAE, Qatar, and Oman (2000–2023) demonstrates that while economic growth inherently increases emissions (a 0.28% rise in CO₂ for every 1% GDP growth), FDI stock exerts a counter-balancing effect, reducing emissions by 0.21%.
To transition toward net-zero trajectories, the following strategic interventions are proposed:
Closing the carbon gap: Given that growth-induced emissions currently outweigh FDI-led reductions, GCC nations must raise the "Environmental Quality" of incoming capital. Policy should shift from volume-based investment attraction to technology-intensive green FDI.
Institutionalizing technology spillovers: To ensure that the "Halo Effect" permeates the entire domestic economy, investment frameworks should mandate green technology transfer, fostering a ripple effect of sustainability within local industrial sectors.
Strategic benchmarking: Leveraging the UAE’s success, Qatar and Oman should pivot their FDI promotion strategies toward high-impact sectors like solar and green hydrogen to decouple industrial expansion from carbon intensity.
Internalizing environmental costs: A progressive carbon pricing mechanism is recommended to increase the opportunity cost of carbon-heavy investments, thereby incentivizing the adoption of the cleaner technologies identified in this study.
7.3 Limitations and future research
This study focuses on three GCC countries and aggregate FDI measures, which limits generalizability. Future research should expand to include all GCC countries, disaggregate FDI by sector, incorporate additional environmental indicators, and investigate policy effectiveness more directly.
Our research suggests that strategically managed FDI can serve as a valuable tool in balancing economic growth with environmental protection. By implementing these recommendations, policymakers can maximize FDI's environmental benefits while supporting economic diversification as these nations transition toward more sustainable economies.
Despite the significant insights provided by this study, several limitations must be acknowledged. First, the empirical model focuses on FDI and GDP as the primary explanatory variables. While this selection was intentional to maintain statistical degrees of freedom given the relatively small sample size (N = 3, T = 24), we recognize that CO₂ emissions are influenced by other critical factors such as energy consumption, trade openness, and industrial structure. Excluding these variables may limit the comprehensiveness of the findings.
Second, the use of aggregate FDI measures hinders the ability to distinguish between the environmental impacts of different economic sectors. Therefore, future research should aim to expand the dataset to include all GCC countries and incorporate disaggregated FDI data by sector (e.g., manufacturing vs. services). Additionally, integrating more diverse environmental indicators and investigating the direct effectiveness of green transition policies would provide a more nuanced understanding. Such advancements will be vital for developing sectoral transition plans that effectively align economic diversification with long-term sustainability goals.
This work was supported through the Ambitious Funding track by the Deanship of Scientific Research, Vice Presidency for Graduate Studies and Scientific Research, King Faisal University, Saudi Arabia (GRANT: KFU253621).
[1] Dunning, J.H. (2009). Location and the multinational enterprise: A neglected factor? Journal of International Business Studies, 40(1): 5-19. https://doi.org/10.1057/jibs.2008.74
[2] UNCTAD. (2022). World Investment Report 2022: International tax reforms and sustainable investment. https://doi.org/10.18356/9789210015431
[3] Zugravu-Soilita, N. (2017). How does foreign direct investment affect pollution? Toward a better understanding of the direct and conditional effects. Environmental and Resource Economics, 66(2): 293-338. https://doi.org/10.1007/s10640-015-9950-9
[4] Zhang, C., Zhou, X. (2016). Does foreign direct investment lead to lower CO₂ emissions? Evidence from a regional analysis in China. Renewable and Sustainable Energy Reviews, 58: 943-951. https://doi.org/10.1016/j.rser.2015.12.226
[5] Shahbaz, M., Sbia, R., Hamdi, H., Ozturk, I. (2014). Economic growth, electricity consumption, urbanization and environmental degradation relationship in United Arab Emirates. Ecological Indicators, 45: 622-631. https://doi.org/10.1016/j.ecolind.2014.05.022
[6] Brahmia, S.Y., Mannai, S. (2024). Environmental degradation in Gulf Cooperation Council: Role of ICT development, trade, FDI, and energy use. Sustainability, 17(1): 54. https://doi.org/10.3390/su17010054
[7] Keji, S.A. (2023). Industrial output growth and foreign direct investment in Nigeria. Future Business Journal, 9(1): 58. https://doi.org/10.1186/s43093-023-00225-0
[8] de Mello Jr, L.R. (1999). Foreign direct investment-led growth: Evidence from time series and panel data. Oxford Economic Papers, 51(1): 133-151. https://doi.org/10.1093/oep/51.1.133
[9] Melitz, M.J. (2008). International trade and heterogeneous firms. In The New Palgrave Dictionary of Economics, pp. 1-5. https://doi.org/10.1057/978-1-349-95121-5_2055-1
[10] Buch, C.M., Lipponer, A. (2005). Business cycles and FDI: Evidence from German sectoral data. Review of World Economics, 141(4): 732-759. https://doi.org/10.1007/s10290-005-0053-5
[11] Boianovsky, M. (2017). Modeling economic growth: Domar on moving equilibrium. History of Political Economy, 49(3): 405-436. https://doi.org/10.1215/00182702-4193008
[12] Kang, S.J. (2015). Green growth and sustainable development in G20: Performance and prospects. In the International Monetary System, Energy and Sustainable Development.
[13] OCDE. (2015). Guide opérationnel CITE 2011. https://doi.org/10.1787/9789264248823-fr
[14] Hickel, J., Kallis, G. (2020). Is green growth possible? New Political Economy, 25(4): 469-486. https://doi.org/10.1080/13563467.2019.1598964
[15] Aguilera-Caracuel, J., Ortiz-de-Mandojana, N. (2013). Green innovation and financial performance: An institutional approach. Organization & Environment, 26(4): 365-385. https://doi.org/10.1177/1086026613507931
[16] Li, X., Du, J., Long, H. (2019). Green development behavior and performance of industrial enterprises based on grounded theory study: Evidence from China. Sustainability, 11(15): 4133. https://doi.org/10.3390/su11154133
[17] Zou, T., Zeng, H., Zhou, Z., Xiao, X. (2019). A three-dimensional model featuring material flow, value flow and organization for environmental management accounting. Journal of Cleaner Production, 228: 619-633. https://doi.org/10.1016/j.jclepro.2019.04.309
[18] Zhou, Z., Liu, L., Zeng, H., Chen, X. (2018). Does water disclosure cause a rise in corporate risk-taking?—Evidence from Chinese high water-risk industries. Journal of Cleaner Production, 195: 1313-1325. https://doi.org/10.1016/j.jclepro.2018.06.001
[19] Schiederig, T., Tietze, F., Herstatt, C. (2012). Green innovation in technology and innovation management–An exploratory literature review. R&D Management, 42(2): 180-192. https://doi.org/10.1111/j.1467-9310.2011.00672.x
[20] Li, X., Long, H. (2020). Research focus, frontier and knowledge base of green technology in China: Metrological research based on mapping knowledge domains. Polish Journal of Environmental Studies, 29(5): 3003-3011. https://doi.org/10.15244/pjoes/114500
[21] Acharyya, J. (2009). FDI, growth and the environment: Evidence from India on CO₂ emission during the last two decades. Journal of Economic Development, 34(1): 43-58. https://doi.org/10.35866/caujed.2009.34.1.003
[22] Mahmood, H., Chaudhary, A.R. (2012). Foreign direct investment-domestic investment nexus in Pakistan. Middle East Journal of Scientific Research, 11(11): 1500-1507. https://doi.org/10.5829/idosi.mejsr.2012.11.11.1633
[23] Ben Lahouel, B., Taleb, L., Managi, S., Guesmi, K. (2024). The threshold effects of ICT on CO₂ emissions: Evidence from the MENA countries. Environmental Economics and Policy Studies, 26(2): 285-305. https://doi.org/10.1007/s10018-022-00346-w
[24] Blanco, L., Gonzalez, F., Ruiz, I. (2013). The impact of FDI on CO₂ emissions in Latin America. Oxford Development Studies, 41(1): 104-121. https://doi.org/10.1080/13600818.2012.732055
[25] Bayar, Y. (2016). Impact of foreign direct investment inflows on environmental pollution in Turkey. New Trends and Issues Proceedings on Humanities and Social Sciences, 2(2): 23-29. https://doi.org/10.18844/prosoc.v2i2.409
[26] Zhu, S., Ye, A. (2018). Does foreign direct investment improve inclusive green growth? Empirical evidence from China. Economies, 6(3): 44. https://doi.org/10.3390/economies6030044
[27] Lu, X., Yan, K. (2023). Unleashing the dynamic and nonlinear relationship among new-type urbanization, foreign direct investment, and inclusive green growth in China: An environmental sustainability perspective. Environmental Science and Pollution Research, 30(12): 33287-33297. https://doi.org/10.1007/s11356-022-24503-6
[28] Bukhari, N., Shahzadi, K., Ahmad, M.S. (2014). Consequence of FDI on CO₂ emissions in case of Pakistan. Middle-East Journal of Scientific Research, 20(9): 1183-1189. https://doi.org/10.5829/idosi.mejsr.2014.20.09.13595
[29] Ofori, I.K., Gbolonyo, E.Y., Ojong, N. (2023). Foreign direct investment and inclusive green growth in Africa: Energy efficiency contingencies and thresholds. Energy Economics, 117: 106414. https://doi.org/10.1016/j.eneco.2022.106414
[30] Xie, Q., Wang, X., Cong, X. (2020). How does foreign direct investment affect CO₂ emissions in emerging countries? New findings from a nonlinear panel analysis. Journal of Cleaner Production, 249: 119422. https://doi.org/10.1016/j.jclepro.2019.119422
[31] Kim, S.E., Seok, J.H. (2023). The impact of foreign direct investment on CO₂ emissions considering economic development: Evidence from South Korea. The Journal of International Trade & Economic Development, 32(4): 537-552. https://doi.org/10.1080/09638199.2022.2122538
[32] Pesaran, M.H., Shin, Y., Smith, R.P. (1999). Pooled mean group estimation of dynamic heterogeneous panels. Journal of the American Statistical Association, 94(446): 621-634. https://doi.org/10.2307/2670182
[33] Hsiao, C. (1986). Analysis of Panel Data. Cambridge University Press.
[34] Pesaran, M.H. (2007). A simple panel unit root test in the presence of cross‐section dependence. Journal of Applied Econometrics, 22(2): 265-312. https://doi.org/10.1002/jae.951
[35] Pedroni, P. (2004). Panel cointegration: Asymptotic and finite sample properties of pooled time series tests with an application to the PPP hypothesis. Econometric Theory, 20(3): 597-625. https://doi.org/10.1017/S0266466604203073
[36] Persyn, D., Westerlund, J. (2008). Error-correction–based cointegration tests for panel data. The Stata Journal, 8(2): 232-241. https://doi.org/10.1177/1536867X0800800205
[37] Safiyanu, S.S., Chua, S.Y. (2020). Foreign trade and economic growth in sub-Saharan African countries: Dynamic common correlated effects estimator (CS-ARDL). Pertanika Journal of Social Sciences & Humanities, 28(2): 1143-1161.